Testing the fragmentation limit in the Upper Sco association ††thanks: Based on observations collected with the United Kingdom InfraRed Telescope, Canada France Hawaii Telescope, and Very Large Telescope.
Abstract
We present the results of a deep ( 21 at 5) infrared photometric survey of a 0.95 square degree area in the central region of the Upper Sco association. The photometric observations consist of a deep -band images obtained with the WFCAM camera on the UKIRT InfraRed Telescope (UKIRT) with partly coverage in complemented by methane ON and OFF conducted with WIRCam on the Canada France Hawaii Telescope. We have selected five potential T–type objects belonging to the Upper Sco association on the basis of their blue methane colours and their colours. We have also identified a sample of 7–8 Upper Sco member candidates bridging the gap between known cluster M–types and our new T–type candidates. These candidates were selected based on their positions in various colour–magnitude diagrams and they follow the sequence of known Upper Sco members identified in the UKIRT Infrared Deep Sky Survey (UKIDSS) Galactic Clusters Survey (GCS). We present additional membership constraints using proper motion estimates from the multiple epochs available to us. We also present optical and near–infrared spectra obtained with the X–Shooter spectrograph on the Very Large Telescope for five L–type candidates covering the 0.6 to 2.5 micron wavelength range, none of them being confirmed as a young brown dwarf. We discuss the lack of detection of new candidate members as well as the possible turn down in the USco mass function as we are approaching the fragmentation limit.
keywords:
Stars: low-mass stars and brown dwarfs — techniques: photometric — techniques: spectroscopic — Infrared: Stars — surveys — stars: luminosity function, mass function1 Introduction
Knowledge of the shape of the present–day mass function and the masses of the coolest substellar objects in young clusters and star forming regions is of prime importance to put constraints on the formation mechanisms responsible for the existence of brown dwarfs and planetary mass objects. According to the standard theory of star formation, the fragmentation limit, i.e. the mass at which one object is unable to contract further because it can not radiate its heat to collapse further, is of the order of a few Jupiter masses (5–10 MJup; Low & Lynden-Bell, 1976; Rees, 1976). However, this limit might be lower, possibly of the order of 1 MJup in presence of magnetic fields (Boss, 2001), but more realistic 3D calculations of the collapse of molecular clouds are required to thoroughly address this issue from the theoretical point of view.
Observationally, several regions have been probed to faint magnitudes at both optical and near–infrared wavelengths to look for a possible cut–off at the low mass end of the mass function. Bihain et al. (2010) reported a possible cut–off below 6 MJup in the mass function of the 1–8 Myr–aged Orionis cluster from a deep ( 21.5 mag) optical/infrared survey over 0.23 square degree. These authors added one further very young objects pre-emptively classified as a T–type candidate to the previously known S Ori 70. The latter object has a T6 spectral type and displays unusual infrared colours pointing towards a younger age (Zapatero Osorio et al., 2002, 2008) but its membership of Orionis remains a matter of debate (Burgasser et al., 2004; Scholz & Jayawardhana, 2008; Luhman et al., 2008; Peña Ramírez et al., 2011). Alves de Oliveira et al. (2010) presented spectroscopy for a subsample of low mass brown dwarf candidates identified in a survey extending over the full projected area of the Ophiuchus cloud and reaching to 20.5 mag. These authors derive luminosities and effective temperatures for their candidate members but do not present a mass function. Independently, Geers et al. (2011) has confirmed through infrared spectroscopy several candidates as substellar members including one at the deuterium burning limit. Marsh et al. (2010) published the discovery of a T2 dwarf in the same region, finding not confirmed by Alves de Oliveira et al. (2010). Scholz et al. (2009) reported, on the basis of a deep optical and infrared survey of 0.25 square degrees in NGC 1333 complemented by spectroscopy, a possible dearth of planetary mass objects corresponding to a potential cut–off in the cluster mass function in the 20–12 MJup mass range. Burgess et al. (2009) identified a mid-T–type candidate from a methane survey of 0.11 square degrees in IC 348, suggesting that an extrapolation of the field mass function (Chabrier, 2003) may hold in the substellar and planetary mass regimes. Casewell et al. (2007) extracted several L/T–type candidates in 2.5 square degree in the Pleiades cluster from deep optical and infrared photometry complemented by proper motion using the 5 year baseline between both surveys. Evolutionary models (Baraffe et al., 2002) predict masses as low as 10 MJup for these candidates if indeed members of the Pleiades. The mass function appears to keep rising at such low masses with a slope index which agrees, within the uncertainties, with the values inferred from earlier studies (e.g. Dobbie et al., 2002; Moraux et al., 2003; Lodieu et al., 2007).
The Upper Sco association (hereafter USco) is part of the Scorpius Centaurus OB association: it is located at 145 pc from the Sun (de Bruijne et al., 1997) and its age is estimated to 52 Myr from isochrone fitting and dynamical studies (Preibisch & Zinnecker, 2002). The association was targeted in X rays (Walter et al., 1994; Kunkel, 1999; Preibisch et al., 1998), astrometrically ith Hipparcos (de Bruijne et al., 1997; de Zeeuw et al., 1999), and more recently at optical (Preibisch et al., 2001; Preibisch & Zinnecker, 2002; Ardila et al., 2000; Martín et al., 2004; Slesnick et al., 2006) and near–infrared (Lodieu et al., 2006; Lodieu et al., 2007) wavelengths. Several tens of brown dwarfs have now been confirmed spectroscopically as members of the association (Martín et al., 2004; Slesnick et al., 2006; Lodieu et al., 2006; Slesnick et al., 2008; Lodieu et al., 2008; Martin et al., 2010; Lodieu et al., 2011) and the mass function of this population determined well into the substellar regime (Slesnick et al., 2008; Lodieu et al., 2011).
In this paper we report the outcome of a deep photometric survey of approximately 0.95 square degrees in the central region of USco to (1) find young T–types, (2) test the theory of the fragmentation limit in a young nearby star forming region, and (3) bridge the gap between previous surveys and the new T–type candidates. In Section 2 we describe methane ON and OFF imaging survey obtained with the Canada France Hawaii Telescope (CFHT), the near-infrared imaging survey carried out with the United Kingdom (UK) InfraRed Telescope (UKIRT), the optical -band imaging obtained with the Wide-Field Camera (WFC) on the Isaac Newton Telescope (INT) and the optical to near-infrared spectroscopy obtained with the X-Shooter instrument on the Very Large Telescope. In Section 3 we outline the photometric selection of T–type candidates using the methane survey complemented by the deep optical band. In Section 4 we attempt to bridge the gap between our previous studies of USco and the search for T–types presented in this paper using various colour–magnitude diagrams drawn from all datasets presented here. We also make use of the multiple epochs to estimate the proper motion of some of the new candidates. In Section 6 we present the X-Shooter spectra of several photometric candidates covering the optical to near–infrared (0.6–2.2 microns) wavelength range. We summarise our investigation in Section 8 and propose future avenues for exploration.
2 Imaging observations
In this section, we describe methane ON and OFF, deep , and optical photometric observations aiming at identifying potential substellar members in USco.
2.1 CFHT WIRCam methane survey
2.1.1 WIRCam Observations
The Wide–field InfraRed Camera (WIRCam; Puget et al., 2004) is a near–infrared (0.9–2.4 microns) camera installed on the prime focus of the 3.6m CFHT on Mauna Kea, Hawaii. WIRCam is equipped with four 20482048 HAWAII 2RG detectors. The pixel scale is 0.3 arcsec, thus yielding an almost contiguous field-of-view of 20.5 arcmin aside. We performed observations in February, April, June, and July 2008 with the methane OFF and ON filters which are centered at 1.58 and 1.69 microns, respectively, and covered nine pointings (i.e. one square degree) which are co-incident with our deep imaging (the overlapping region is exactly 0.95 square degrees). The centre of the WIRCam coverage is located at 16h 08m,22∘ 45’, equinox J2000.0. The total time per WIRCam field, including overheads, amounted to 72 min. We used a five point dither pattern with on-source single integrations of 38 sec (see Table LABEL:tab_deepUsco:log_CFHT). The exceptions are for the tiles numbers 5 and 6; our subsequent strategy was optimised to better monitor sky variations at infrared wavelengths. Seeing conditions were generally between 0.6 and 0.8 arcsec at zenith in the –band. Dome flats in the methane OFF and ON filters were taken as part of our program.
| Tile | R.A. | dec | CH4on | CH4off | Date |
|---|---|---|---|---|---|
| USco_M1 | 16:06:40 | 23:05 | 514m24s | 514m24 | 18/02, 1921/06, 1215/07/2008 |
| USco_M2 | 16:06:40 | 22:45 | 514m24s | 514m24 | 24/06, 1015/07/2008 |
| USco_M3 | 16:06:40 | 22:25 | 514m24s | 514m24 | 1516/07/2008 |
| USco_M4 | 16:08:00 | 23:05 | 514m24s | 514m24 | 1617/07/2008 |
| USco_M5 | 16:08:00 | 22:45 | 11h12s | 11h12 | 2021/02/2008 |
| USco_M6 | 16:08:00 | 22:25 | 11h12s | 514m24 | 2125/02, 2021/04/2008 |
| USco_M7 | 16:09:20 | 23:05 | 514m24s | 514m24 | 1718/07/2008 |
| USco_M8 | 16:09:20 | 22:45 | 514m24s | 514m24 | 1112/07/2008 |
| USco_M9 | 16:09:20 | 22:25 | 514m24s | 514m24 | 2224/04, 182424/06/2008 |
2.1.2 Data reduction
The data processing of the WIRCam images is done in two steps. First, the detrending (or removal of instrument imprints), done with the “I”iwi pipeline, provides raw and detrended images for our CFHT/WIRCam run. The second stage which involves sky-subtraction, astrometry and photometry is performed with SExtractor (Bertin & Arnouts, 1996) at Terapix111http://terapix.iap.fr/ and outputs fully photometrically and astrometrically calibrated catalogues.
Our observing program produced 729 data cubes, including 702 containing two images and 27 composed of 8 images. The 729 cubes are divided up into 387 and 342 cubes in methane OFF and ON, respectively. However, several images (roughly 100 or 0.06% of the total number of images) had to be removed at different stages of the processing for various reasons, e.g. large extinction due to cloud, the presence of strong electronic noise stripes or other instrument malfunctions.
The detrending steps involve several corrections to remove the cosmetics of the WIRCam infrared detector222More details on the pre-processing of WIRCam images at www.cfht.hawaii.edu/Instruments/Imaging/WIRCam/IiwiVersion1Doc.html and includes flagging of the saturated pixels, non-linearity and reference pixel corrections, dark and flat-field subtraction, bad pixels removal and guiding window masking. The resulting images are then processed by Terapix, following closely the sequence and data flow chart outlined below:
-
1.
Creation of masks to identify saturated pixels and reject saturated sources
- 2.
-
3.
Generate a first stack with the detrended and sky-subtracted images for each filter to estimate the sky background after removal of the faintest sources. The stacked images represent the weighted median of the individual images combined with the Lanczos3 interpolation kernel. The reference coordinate system is the FK5 or J2000 system with the distorted tangential projection type
-
4.
Sky subtraction is made in two steps and created from a sample of 30 images before subtracting the sky from the detrended images
-
5.
In some cases sky masking has to be implemented in addition to the normal procedure if it turned out to be impossible to estimate the sky level for some pixels
-
6.
Assessment of the quality of sky-subtracted images and catalogues. After visual inspections, a few images ( 20) had to be rejected due to luminosity gradients, cosmetics defects or large scale patterns
The final step consists of generating sky–subtracted images to compute the astrometric and relative photometric calibration with field to field rescaling. Individual stacks were created for the 18 images in methane OFF and ON as well as two mosaics containing the nine pointings of each filter. The catalogues, generated with SExtractor (Bertin & Arnouts, 1996), contain the pixel and world coordinates, aperture fluxes and magnitudes with their associated errors as well as quality flags. The final merged catalogue with the methane ON and OFF data contains 166,265 sources, of these 131,937 have quality flags equal to zero indicating that they are robust detections. There are 92,918 sources with photometric error bars less than 0.3 mag in the methane colour. The completeness limit of the methane survey is 20.3 and 20.2 mag in the CH and CH, respectively. These limits are deduced from the points where the histograms deviate from a powerlaw fit to the counts.
2.2 Deep UKIRT WFCAM survey
2.2.1 WFCAM Observations
The UKIRT wide–field camera (WFCAM) is equipped with four 20482048 Rockwell detectors spaced by 94% and sensitive to near-infrared (1.0–2.5 microns) wavelengths (Casali et al., 2007). The pixel size is 0.4 arcsec, giving a coverage of 0.19 square degree in a single exposure (called pawprint). Four pawprints are required to fill in the gaps between the detectors and cover a filled square of 0.75 square degree (or tile). The camera is equipped with several filters, including the and filters specific to WFCAM as well as the standard Mauna Kea Observatory (Tokunaga et al., 2002) filters (Hewett et al., 2006).
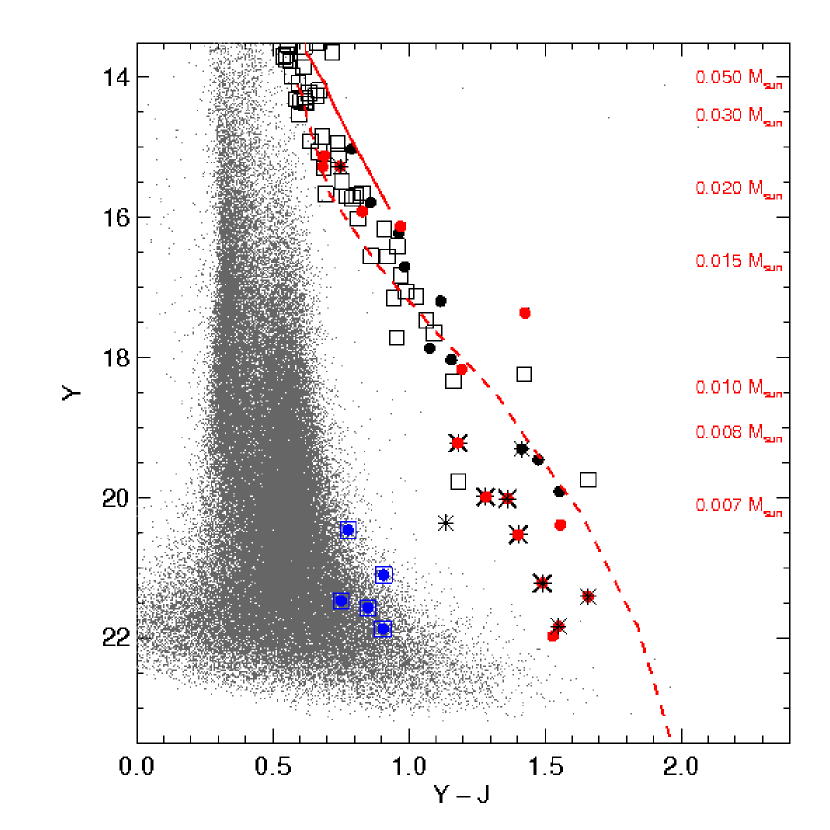
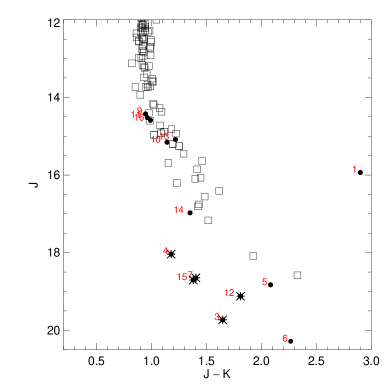
We have conducted a deep imaging survey with WFCAM of the central region in the USco previously surveyed by the UKIRT Infrared Deep Sky Survey (UKIDSS) Galactic Clusters Survey (GCS) (Lodieu et al., 2007). The observations took place in May and June 2008 (Table LABEL:tab_deepUsco:log_WFCAM). Weather conditions were generally good with clear skies and seeing better than 1.0 arcsec as measured on the images. We have obtained eight pawprints in the and filter, covering a total of 1.7 square degrees. An additional –band image was obtained for four pawprints because of the high airmass of USco from Mauna Kea and our seeing requirements which hampered achieving regularly seeing better than 1.2 arcsec in this filter. The central coordinates of each pawprint are provided in Table LABEL:tab_deepUsco:log_WFCAM. The on–source individual exposure times were set to 22.25, 20, and 10 seconds in the , , and filters, respectively, repeated twice in and three times in . We used a 22 microstepping pattern and a 5 point dither arrangement with offsets of 3.2 arcsec to subtract the sky properly. We reached depths of 5 at 22.0–22.3 mag and 21.5–21.7 mag in and , respectively. The resulting (,) colour–magnitude diagram is displayed in Figure 1. We observe a gap between potential members and field stars as previously reported in our studies of USco (Lodieu et al., 2006; Lodieu et al., 2007) and the Pleiades (Lodieu et al., 2007). However, as we discuss in the next sections, most of the new photometric candidates identified in this deep survey which follow the sequence of USco spectroscopic members turn out to be non-members.
| Tile | R.A. | dec | Repeat | Date | Seeing |
|---|---|---|---|---|---|
| #1 | 16:06:00 | 23:09:00 | 4 | 03May2008 | 1.0′′ |
| #1 | 1 | 04May2008 | 0.9′′ | ||
| #1 | 4 | 04May2008 | 0.9′′ | ||
| #1 | 1 | 03Jun2008 | 1.0′′ | ||
| #2 | 16:13:12 | 22:15:00 | 5 | 05May2008 | 0.5–1.0′′ |
| #2 | 2 | 30May2008 | 1.0′′ | ||
| #2 | 2 | 31May2008 | 0.7′′ |
2.2.2 Data reduction
All data taken with WFCAM were reduced automatically by the Cambridge Astronomy Survey Unit (CASU)333http://casu.ast.cam.ac.uk even if there are not part of the UKIDSS project (Lawrence et al., 2007). The description of the automatic pipeline data reduction is explained in Irwin et al. (2004) with additional updates detailed on the CASU webpage444http://casu.ast.cam.ac.uk/surveys-projects/wfcam/technical. The processing involve several technical steps before generating the final photometric catalogues, including flat fielding, sky subtraction, correction for field distortion, removal of low level pseudo-periodic ripples in dark images (or decurtaining), and removal of persistence and crosstalk artifacts due to the presence and reminiscence of bright stars on infrared detectors. The catalogues can then be retrieved from the WFCAM Science Archive (WSA; Hambly et al., 2008) to extract the astrometry and photometry.
As a consequence of multiple repeats of each pawprint for each filter, an additional step was necessary to combine all images of each pawprint in each filter. At WFAU (Wide Field Astronomy Unit) pawprints from each minimum scheduled block (MSB) were first subjected to quality control using an automated set of procedures, and those that were deemed acceptable were used in all further curation and released and the others were deprecated (see Collins et al., 2009, for details). The quality controlled pawprints were then grouped together, using the metadata in the WSA tables. The grouping occurred in two stages: first by position to find all unique pointings (where pointings were within 4 arcmin of each other) and then grouped by pointing, filter and level of microstepping to determine deep products. If a particular pointing and filter combination contains more than one level of microstepping, then the level of microstepping that corresponds to data with the greatest total exposure time is selected on a product-by-product basis. The stacking code used can only deal with one level of microstepping, so this is a necessity.
Deep pawprint stacks and confidence images were then created by looping through the list of stacks and selecting pawprint science frames (the stacks created from processing each MSB) that match the pointing, filter and microstep criteria. The CASU code “fitsio_stack” was used for the stacking, and then a catalogue was created for each stack using the codes “cir_imcore”, “cir_classify” and “cir_catcoord”, all produced at CASU (see Irwin et al. in prep). The new deep stacks and catalogue data were then ingested into the WSA.
The merged passband source table was produced from the deepest data in each pointing/filter, i.e. from the deep stack catalogues. Hambly et al. (2008) provides details on the production and contents of the Source table. Multi–epoch tables were produced as described in Cross et al. (2009). The final combined catalogues could then be retrieved directly with a Structured Query Language (SQL) query sent through the WSA webpage.
2.3 INT WFC optical -band imaging
2.3.1 INT Observations
The Issac Newton Telescope (INT) is a 2.54-m optical telescope currently equipped with two instruments, one of which being a wide–field camera (WFC) located at its prime focus. The WFC consists of four thinned EEV 2048x4096 Charge-Coupled Devices (CCDs), offering a field-of-view of approximately 34 arcmin and a pixel size of 0.33 arcsec. The inter-spacing between the CCDs is small, resulting in a loss of coverage of the order of 1 arcmin.
We carried out a -band imaging survey of the full coverage of the GCS Science Verification phase presented in Lodieu et al. (2007) over several nights on 19–25 April 2006. In this paper, we mainly focus on the area overlapping with the methane and deep survey to complement the near-infrared photometry and add constraint on the membership of potential cluster member candidates. The nights of 19 and 25 April offered excellent weather with good seeing and stable conditions. The weather conditions on 20 April were also good but the seeing was variable. The night of 21 April was completely lost due to high humidity. The nights on 22 and 23 April were windy and the night on 24 April had humidity of 80%.
2.3.2 Data reduction
The WFC data were reduced using the Cambridge Astronomical Survey Unit CCD reduction toolkit (Irwin & Lewis, 2001) to follow standard steps, namely, subtraction of the bias, non-linearity corrections, flat-fielding and astrometric calibration. However, in addition, each frame was corrected for fringing using a fringe map constructed from a clipped stack of the images from all our pointings. Subsequently, photometry was performed on the reduced images using a circular window with a diameter of 1.5 the full width half maximum of the mean point spread function. Finally, we created catalogues of all the sources detected in the frames and morphologically classified these as either stellar or non-stellar. We haven’t calibrated photometrically the INT images with a specific standard star but instead used the WFCAM -band from the Science Verification phase to estimate the depth of the INT observations. We estimate the 3 depths to =20.7–21.1 mag on the 19, 23–25 April 2008 while images taken on 20 and 22 April are shallower with depths of 20.00.2 and 19.50.3, respectively. Thus, the INT images are usually deeper than the UKIDSS GCS survey, except for the observations on 20 and 22 April 2008. Note that these depths are given in the WFCAM filter and not the INT filter.
2.4 Spectroscopic observations
2.4.1 X-shooter observations
We carried out optical to near-infrared spectroscopy with the UV- to -band intermediate resolution (R3500), high efficiency spectrograph X-shooter (D’Odorico et al., 2006) mounted on the Cassegrain focus of the Very Large Telescope (VLT) Unit 2. Observations were carried out over several nights during period 85 (April to September 2010) in service mode by the staff at Paranal, Chile. The log of the observations is detailed in Table LABEL:tab_deepUSco:log_XSHOOTER. Weather conditions met our initial requirements: no constraints on the moon, seeing better than 1 arcsec (satisfied in most cases), and thin cirrus acceptable.
X Shooter is a multi wavelength cross–dispersed echelle spectrograph made of three independent arms covering simultaneously the ultraviolet (UVB; 0.3–0.56 microns), visible (VIS; 0.56–1.02 microns), and near–infrared (NIR; 1.02–2.48 microns) wavelength ranges thanks to the presence of two dichroics splitting the light. The spectrograph is equipped with three detectors: a 40962048 E2V CCD44-82, a 40962048 MIT/LL CCID 20, and a 20962096 Hawaii 2RG for the UVB, VIS, and NIR arms, respectively. We used the 1.5 arcsec slit (1.6 arcsec for the UVB arm) to achieve a nominal resolution of 3300 (9.9 pixel per full–width–half–maximum) in the UVB and NIR arms and 5400 (6.6 pixel per full–width–half–maximum) in the VIS arm.
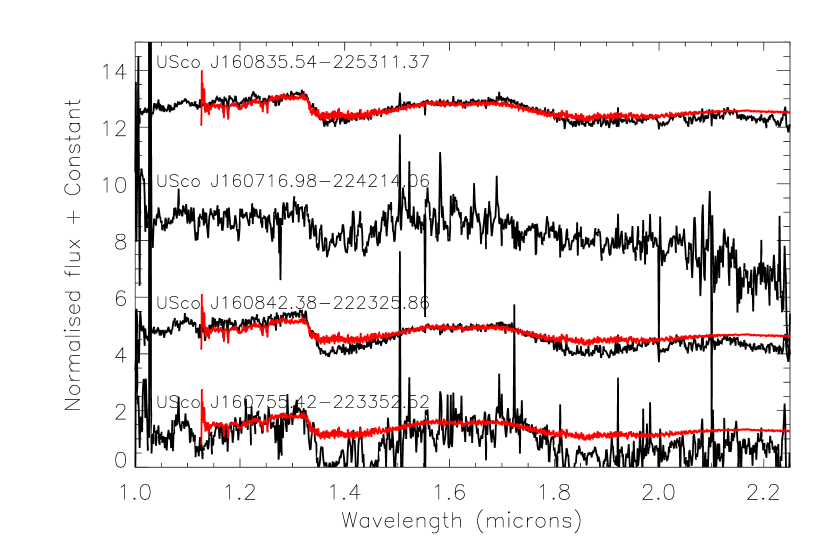
All observations were carried out at parallactic angles. The X–Shooter acquisition is made through an optical CCD, implying that our targets are not visible on the images obtained by the acquisition camera screen. Therefore, we used nearby reference stars to put our targets on the slit. Unfortunately, due to an error in the offset computation, one candidate, USco J160812.99230431.43, observed in April 2010 was out of the slit and we do not have spectra for it. The exposure times were scaled according to the brightness of the target (see Table LABEL:tab_deepUSco:log_XSHOOTER) to achieve a minimum signal–to–noise of 20 after degrading the resolution by a factor of 5. Calibrations were taken according to the instrument calibration plan, including bias, dark, flat field and arc frames. The spectra of four confirmed photometric candidates, normalised at 1.265 microns, are displayed in Figure 4.
| ID | R.A. | dec | Date | ExpT | Seeing | Airmass | Reference star | |
|---|---|---|---|---|---|---|---|---|
| 4 | 16:07:55.42 | 22:33:52.52 | 18.039 | 24Apr2010 | 20min | 0.60–0.69 | 1.010 | 16:07:56.07 22:33:24.6 (=10.60 mag) |
| 7 | 16:08:42.38 | 22:23:25.86 | 18.649 | 29Jul2010 | 45min | 0.64–0.67 | 1.087 | 16:08:43.92 22:23:29.4 (=14.47 mag) |
| 3 | 16:07:16.98 | 22:42:14.06 | 19.730 | 11Jun2010 | 60min | 0.66-0-.68 | 1.212 | 16:07:14.41 22:41:59.8 (=15.45 mag) |
| 8 | 16:09:00.40 | 23:11:50.95 | 19.751 | 26Jul2010 | 60min | 1.14–1.26 | 1.122 | 16:09:02.01 23:12:04.11(=14.06 mag) |
| 6 | 16:08:35.54 | 22:53:11.37 | 20.284 | 19Aug2010 | 40min | 1.25–1.30 | 1.038 | 16:08:38.72 22:53:04.0 (=15.09 mag) |
| 6 | 16:08:35.54 | 22:53:11.37 | 20.284 | 19Aug2010 | 40min | 1.25–1.30 | 1.111 | 16:08:38.72 22:53:04.0 (=15.09 mag) |
| 6 | 16:08:35.54 | 22:53:11.37 | 20.284 | 20Aug2010 | 40min | 0.85–0.96 | 1.056 | 16:08:38.72 22:53:04.0 (=15.09 mag) |
2.4.2 Data reduction
We reduced the X–Shooter spectra on each arm independently using version 1.3 of the pipeline and following the instructions described in the manual ((Issue 4; 30 november 2010) Goldoni et al., 2006; Modigliani et al., 2010). None of the five targets have flux in the ultraviolet arm (UVB) so we do not discuss these data further.
We followed the steps enumerated in the manual using the physical model option to construct a final 2D spectrum for each target and its respective standard star both in the visible (VIS) and infrared (NIR) arm. First, we created a bad pixel map for the NIR detector using a set of 40 linearity frames aimed at identifying non-linear pixels. This step is not required for the VIS arm. Next, we created a master bias and master dark for the VIS and NIR arm, respectively. Afterwards, we determined a first guess order and then we refined the line tables by illuminating the X–Shooter pinhole with a continuum lamp. Later, we created a master flat and an order table tracing the flat edges before establishing the two–dimensional map of the instrument. Subsequently, we determined the efficiency of the whole system made of the telescope, instrument, and detector. Finally, we generated a 2D spectrum in stare mode for the target and its associated standard, both in the VIS and NIR arms.
The next steps were carried out under the IRAF environment555IRAF is distributed by National Optical Astronomy Observatory, which is operated by the Association of Universities for Research in Astronomy, Inc., under contract with the National Science Foundation. although an optimal extraction option is available in the pipeline’s release. First, we extracted a 1D spectrum from the 2D images of the VIS and NIR arm for the target and the star star using the IRAF routine APSUM. Only few spectrophotometric standard stars have been been fully calibrated from the UV to the near-infrared spectral range at the time of writing. For this reason, all of our targets are associated with the GD 153 white dwarf standard, except candidate number 6 which was observed just before another white dwarf standard, Feige 110. We downloaded the calibrated spectra of GD 153 and Feige 110 originating from observations conducted with the Hubble Space Telescope and covering the UVB, VIS, and NIR arms666Ascii files containing fluxes from the ultraviolet to the near-infrared can be downloaded from http://www.stsci.edu/hst/observatory/cdbs/calspec.html. Afterwards, we divided the 1D spectrum of the standard star from the 1D spectrum of the science target and multiplied by the Hubble spectrum of GD 153 and Feige 110 for candidates 1 to 5 and candidate, respectively.
The X–Shooter spectra are contaminated by the presence of sky lines. We attribute this to the current version (Issue 1.3) of the pipeline which is not yet optimised to minimise the residuals of the numerous sky lines present over the full wavelength range covered by X–Shooter, particularly in the stare mode reduction. The near–infrared (1.0–2.25 microns) spectra of four photometric candidates resembling L–types are displayed in Figure 4. The optical spectra of USco J160842.38222325.86 and USco J160716.982242.1406 are shown in Figure 5; the other two objects exhibiting no flux blueward of 1m. The spectrum of USco J160900.40231150.95 classifies it as a quasar at a redshift of 0.8789 and is discussed in more detail in Section 6.2.
3 Search for cluster T–type candidates
A search for T–type candidate members of the USco Association is likely easier than for the Trapezium Cluster and the Pleiades due to a combination of it’s age and distance. Indeed, the apparent magnitude of a 3 MJup T–type (effective temperature below 1100 K) at 5 Myr and 145 pc is predicted to be 0.5 and 4.5 mag brighter in than in the Trapezium Cluster and the Pleiades, respectively, based on the COND models for dust–free brown dwarfs (Baraffe et al., 2002). Furthermore, USco exhibit a significant proper motion (11,25 mas/yr de Zeeuw et al., 1999) so that the membership of any T–type candidate could be confirmed (or otherwise) with a 3 to 5 year baseline. Finally, star formation has ended in USco (Walter et al., 1994) and the region we have focused our deep survey on has low foreground extinction (Av 2 mag; Preibisch et al., 1998).
In this section, we describe our photometric selection of cluster T–types starting from the methane imaging alone. Then, we look at their optical photometry using the INT data. Afterwards, we investigate their photometry to check if these are consistent with T–type members of USco.
The absolute magnitudes of old (1 Gyr) field T–type brown dwarfs are fainter than MJ 13.5–14.0 mag (Vrba et al., 2004; Liu et al., 2007; Leggett et al., 2010; Marocco et al., 2010), corresponding to an apparent magnitude of 19.3–19.8 mag at the distance of USco. The -band absolute magnitude is roughly 0.5 mag brighter. Therefore, we proceed as follows to select potential “methane” candidates. We considered only sources with error bars on their methane colour less than 0.3 mag. First, we computed the median values of the methane colour, per 0.5 mag interval of the methane OFF band from 17.5 to 21 mag (Table LABEL:tab_deepUSco:CH4_stats). We set the brightness limit to 17.5 mag to account for the fact that substellar objects are brighter when younger, and the blue and trends exhibited towards lower temperatures – for example, there is a difference of about one magnitude for a 5 Myr–old 1000 K brown dwarf compared to a 1 Gyr T–type brown dwarf at the same effective temperature (Burrows et al., 1997; Chabrier & Baraffe, 1997). Then, we calculated the median absolute deviation (MAD) i.e. the median of the set of absolute values of deviation from the central value computed as above. Finally, we selected as potential candidates all those objects lying 3 to the blue of the median methane value in each bin where was robustly computed as 1.48MAD. The median and values are reported in Table LABEL:tab_deepUSco:CH4_stats along with the number of candidates.
| range | Median | Nb | Candidates | |
|---|---|---|---|---|
| 17.5–18 | -0.060 | 0.058 | 3478 | 863 |
| 18–18.5 | -0.079 | 0.080 | 4497 | 1088 |
| 18.5–19 | -0.109 | 0.114 | 6027 | 1398 |
| 19–19.5 | -0.148 | 0.155 | 8226 | 1846 |
| 19.5–20 | -0.209 | 0.217 | 9943 | 1934 |
| 20–20.5 | -0.288 | 0.290 | 10452 | 870 |
| 20.5–21 | 0.338 | 0.339 | 7121 | 19 |
| 17.5–21 | — | — | 49744 | 8018 |
To eliminate contaminants, we cross correlated this large list of candidates with the INT optical photometric catalogue using a matching radius of 2 arcsec. We found 5410 sources with optical photometry out of the 8018 methane candidates, implying that 2608 have no detected optical counterpart. About 65% of those candidates without optical counterpart down to the depth of the INT survey are covered by the deep data, leaving about 1750 sources to investigate further. Among these 1750 sources, 806 have a counterpart within 2 arcsec in the deep survey.
We investigated the near–infrared photometry of these 806 candidates to reject contaminants. We computed the colours for each candidate and considered only sources bluer than 0.5 mag in (Tinney et al., 2005; Goldman et al., 2010; Peña Ramírez et al., 2011). Applying this colour cut leaves one object with a negative colour, one object with 0.2 mag, 4 candidates with = 0.25-0.30 mag, 12 candidates with = 0.3-0.4 mag, and 26 candidates with = 0.4-0.5 mag. However, we discarded the candidate with the bluest colour because it turned out to be a mismatch. Additionally, we rejected 13 of these sources as they were detected in the WFCAM imaging and a further 29 with colours that are too blue ( 0.7 mag; including 4 already detected on the WFCAM images) to be consistent with T-type members. Thus there are 5 candidates which remain of interest to us. We checked those five sources in the WFCAM (no -band images available) and the WIRCam methane images to detect any false positive but did not find any. The bluest object in and thus the most interesting candidate, has a methane colour of 0.87 mag and = 0.850.10. The coordinates and photometry of these candidates is provided in Table LABEL:tab_deepUSco:CH4_candidates.
We looked at the images of the recent data release of the Wide-Field Infrared Survey Explorer (WISE; Wright et al., 2010) to check whether these T–type candidates are detected at 3.4 and 4.6 microns. None of the five candidates are detected. However, non–detections do not constitute a strong constraint on their spectral type since T–types exhibit and colours in the 2–4.5 and 0–3 mag range (Patten et al., 2006; Leggett et al., 2010; Mainzer et al., 2011) which does not guarantee a mid-infrared detection at to the WISE sensitivities (16.5 and 15.5 mag at 3.4 and 4.6 microns, respectively).
| R.A. | dec | CH4off | CH4on | P | ||
|---|---|---|---|---|---|---|
| 16:08:35.98 | 22:29:11.1 | 21.869 | 20.964 | 20.471 | 21.108 | 3 |
| 16:08:45.73 | 22:29:53.5 | 21.469 | 20.718 | 20.290 | 21.145 | 3 |
| 16:08:47.80 | 22:29:04.5 | 21.568 | 20.718 | 20.585 | 21.450 | 1 |
| 16:09:55.91 | 22:33:45.7 | 21.103 | 20.194 | 19.811 | 20.395 | 2 |
| 16:10:04.76 | 22:32:30.6 | 20.462 | 19.685 | 19.257 | 19.754 | 3 |
4 Bridging the gap between M and T–types
In this section we describe the photometric selection employed to identify further USco member candidates in the area common to the deep survey and methane imaging. Additional membership constraints are derived from the infrared photometry as well as crossmatching with the UKIDSS GCS (Lodieu et al., 2007) and its associated spectroscopic follow–up (Lodieu et al., 2008; Lodieu et al., 2011).
We found that the USco sequence is well separated from field stars in several colour–magnitude diagrams (including the (,) diagram) from the central region surveyed during the Science Verification (SV) phase of the UKIDSS GCS (Lodieu et al., 2007). The cluster sequence extends down to 10 MJup and possibly below depending on the validity of the mass estimates provided by current theoretical models (Baraffe et al., 2002). We note that we clearly detect the M7/M8 gap at 15.5 mag and 14 mag proposed to by Dobbie et al. (2002).
We started off our photometric selection using the (,) colour–magnitude diagram (Figure 1). We used the sample of spectroscopic members extracted from the UKIDSS GCS (Lodieu et al., 2008) to define our selection criteria. The sequence appearing in the deep (,) colour–magnitude diagram matches well the sequence previously seen in the GCS SV data (Lodieu et al., 2007) after applying the offset of 0.08 mag to the SV data (see “Known Issues” for UKIDSS Data Release 3 in the WSA). We queried the WSA to extract coordinates and photometry of all point sources with good quality fainter than = 10.5 mag (saturation level of the deep survey). This catalogue contains 172,209 objects. However, we focused our search only on sources fainter than = 15 mag because we aim to uncover USco members with masses below 30 MJup and, more specifically, 5 Myr–old L– and T–types. Similarly, we considered only sources brighter than the 5 detection limit in i.e. 22.2 mag. As a consequence, we picked out all objects to the right of a line extending from (,) = (0.65,15.0) to (1.50,22.0) in the (,) diagram. This selection returned 30 sources detected in and , including three with -band photometry. Among these 30 sources, four have been removed from the final candidate list because they were either residual crosstalk artifacts (three objects) or at the edge of the detector (one object). Thus, we are left with 26 reliable candidates which warrant further investigation.
We crossmatched these 26 candidates against the list of members identified in the GCS SV, resulting in ten common sources (Table LABEL:tab_deepUsco:tab_candYJ_SV2). We have recovered all candidates from our GCS SV work in our selection. Eight of them are known spectroscopic members with spectral types ranging from M8 to L1 (Lodieu et al., 2008), one is classified as a spectroscopic non member (USco J160956.34222245.5; dL2; Lodieu et al., 2008), and the remaining one has an optical spectral type (USco J161154.39223649.3; M6.25) from our multi-fibre spectroscopic follow-up (Lodieu et al., 2011). We note that the new colour (1.550.06 mag) of USco J160843.43224516.1 differs from the old measurement from the GCS SV ( = 1.180.20), putting this object back on the cluster sequence in the (,) diagram. We conclude that this spectroscopic member may be variable and/or may possess circumstellar material.
| R.A. | dec | SpT | ||
|---|---|---|---|---|
| 16:06:48.18 | 22:30:40.2 | 15.7870.003 | 14.9280.002 | M8/M8.5 |
| 16:07:27.83 | 22:39:04.0 | 18.0300.008 | 16.8730.006 | L1 |
| 16:07:37.98 | 22:42:47.0 | 17.8650.008 | 16.7880.006 | L0 |
| 16:08:18.43 | 22:32:25.1 | 17.1940.005 | 16.0770.004 | L0 |
| 16:08:43.43 | 22:45:16.1 | 19.9120.030 | 18.3580.015 | L1 |
| 16:08:47.45 | 22:35:47.9 | 16.7010.004 | 15.7160.004 | M9 |
| 16:09:18.68 | 22:29:23.8 | 19.4570.020 | 17.9810.012 | L1 |
| 16:09:56.34 | 22:22:45.6 | 19.3020.019 | 17.8870.011 | dL2 (NM) |
| 16:10:47.14 | 22:39:49.5 | 16.2180.003 | 15.2540.003 | M9/M8.5 |
| 16:11:54.39 | 22:36:49.3 | 15.0150.002 | 14.2250.002 | M6.25 |
a This object remains as photometric candidate
b This object is a field L dwarf spectroscopically
c Classified as quasar spectroscopically.
| ID | R.A. | dec | CH4off | CH4on | ||||||
|---|---|---|---|---|---|---|---|---|---|---|
| 1 | 16:06:30.92 | 22:58:15.2 | — | 17.3620.006 | 15.9350.004 | 14.3740.005 | 13.0350.003 | 16.6580.011 | — | |
| 2 | 16:06:46.45 | 22:31:23.8a | — | 21.9770.187 | 20.4480.081 | — | — | — | 19.5620.094 | 19.4050.071 |
| 3 | 16:07:16.98 | 22:42:14.1b | — | 21.2210.095 | 19.7300.045 | — | 18.0820.208 | — | — | |
| 4 | 16:07:55.42 | 22:33:52.5 | 20.3570.027 | 19.2200.018 | 18.0390.013 | 17.5220.070 | 16.8600.065 | 20.1590.178 | — | |
| 5 | 16:08:12.99 | 23:04:31.4 | — | 20.3850.053 | 18.8280.022 | 17.8580.102 | 16.7450.065 | — | 17.8470.020 | 17.5010.013 |
| 6 | 16:08:35.54 | 22:53:11.4 | — | 21.8350.171 | 20.2840.069 | 18.2200.144 | 18.0180.196 | — | 19.7600.092 | 19.7470.061 |
| 7 | 16:08:42.38 | 22:23:25.9 | — | 20.0120.030 | 18.6490.018 | 17.8700.094 | 17.2450.091 | — | 17.8040.019 | 17.6850.008 |
| 8 | 16:09:00.40 | 23:11:51.0c | — | 21.4100.112 | 19.7510.044 | — | — | — | 19.9620.279 | 20.1000.204 |
| 9 | 16:09:03.86 | 22:23:22.2 | 15.6930.003 | 15.1160.002 | 14.4250.002 | 13.8170.003 | 13.4790.003 | 15.6330.006 | — | |
| 10 | 16:09:05.67 | 22:45:16.7 | — | 16.1260.003 | 15.1560.003 | 14.5720.006 | 14.0140.005 | 17.3410.019 | — | |
| 11 | 16:10:00.17 | 23:12:19.3 | — | 15.2700.002 | 14.5220.002 | 13.9710.004 | 13.5600.004 | 15.9470.007 | — | |
| 12 | 16:11:05.28 | 22:22:57.3 | — | 20.5260.051 | 19.1230.027 | 18.4610.192 | 17.3130.109 | 20.000 — | — | |
| 13 | 16:11:27.61 | 22:43:33.6 | — | 15.9130.003 | 15.0850.002 | 14.4690.005 | 13.8670.005 | — | — | |
| 14 | 16:12:44.88 | 23:02:14.0 | — | 18.1680.009 | 16.9730.007 | 16.2640.022 | 15.6220.025 | — | — | |
| 15 | 16:12:57.41 | 23:05:55.4 | — | 19.9890.032 | 18.7060.020 | 18.1370.116 | 17.3260.119 | — | — | |
| 16 | 16:13:30.35 | 22:44:06.7 | — | 15.2730.002 | 14.5900.002 | 13.9650.004 | 13.5990.004 | 15.8400.007 | — |
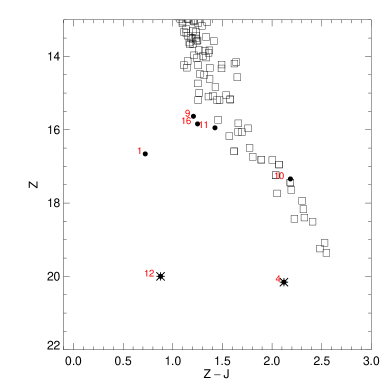
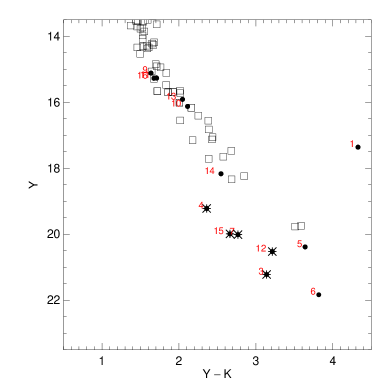
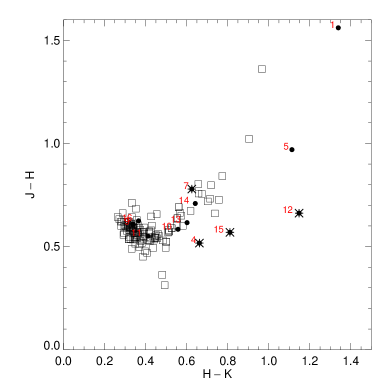
To further constrain the membership of the 16 new candidates, we looked for additional photometry in , , and in the deep -band survey, in the latest release of the UKIDSS GCS (Data Release 8 in September 2010) and in the GCS SV database. Two objects are detected in the deep image and show magnitudes consistent with the photometry extracted from the SV database within the error bars (Table LABEL:tab_deepUsco:tab_candYJ_new). Their positions in the (,) diagram (Top, left panel in Figure 3; see also Figure 3 of Lodieu et al., 2007) place them at the border between the field stars and the cluster sequence. Additionally, we extracted and photometry from GCS DR8 for 13 out of 16 new candidates. The other three sources lie in a gap within the GCS SV coverage due to control quality rejection in the SV data (see Figure 1 in Lodieu et al., 2007). We plotted these 13 sources in the (,) and (,) colour–magnitude as well as in the (,) colour–colour diagram (Figure 3) along with spectroscopically confirmed USco members to assess their membership. Four candidates (USco J160755.42223352.5; USco J161257.41230555.4; USco J160842.38222325.9; USco J161105.28222257.3) are classified as photometric non members because they exhibit blue colours in several diagrams (asterisks in Figure 3). There is another object (USco J160716.98224214.1) for which only –band data is available, suggesting that it is also a photometric non member due to its blue infrared colours (asterisk in Figure 3). The remaining eight candidates remain bona-fide members of the USco association. Finally, we have added a photometric constraint using the photometry from the GCS SV for seven sources out of the 16. The brightest candidates are confirmed as photometric candidates (top left panel of Figure 3) while the two faintest sources (USco J161105.28222257.3 and USco J160755.42223352.5) are rejected due to their blue colours (note that they were already rejected based on their and colours).
Some of the 16 new candidates are quite bright but were not selected as potential members in the SV survey. Seven of them are, however, in the SV coverage with photometry and should have been recovered if indeed members (Table LABEL:tab_deepUsco:tab_candYJ_new). The two faintest, USco J160755.42223352.5 and USco J160842.38222325.9, are photometric non members due to their blue infrared colours as discussed above. The remaining five are much brighter. One object, USco J161000.17231219.3, was included in our AAOmega optical follow–up and classified as a spectroscopic non member on the basis of its strong NaI doublet (Table C.1 in Lodieu et al., 2011). USco J160903.86222322.2 and USco J161330.35224406.7 are clear proper motion non members based on our estimate from the 2MASS/GCS SV crossmatch, a hypothesis corroborated by the US Naval Observatory measurements (Monet et al., 2003). USco J160905.67224517.0 was also classified as a proper motion non member from our 2007 study but lies very close to the 2 proper motion selection. Finally, USco J160630.92225815.2 appears as a bona-fide photometric and proper motion member from our SV study and the new deep survey. The and magnitudes became fainter by approximately 1.4 and 1.0 mag, respectively, between the SV and deep survey epochs. This source was also included in our AAOmega multi–fibre spectroscopic follow–up (Lodieu et al., 2011) and its spectrum suggests that it is a young active star with strong H, Helium, NII, and SII emission lines and whose continuum is rising steeply from 6000 to 9000 Å. Overall we have rejected sources which do not satisfy at least two colours criteria or a colour and proper motion or spectroscopic criteria. The final membership is given in the last column of Table LABEL:tab_deepUSco:PM_values and a note has been added to Table LABEL:tab_deepUsco:tab_candYJ_new for the three sources not in Table LABEL:tab_deepUSco:PM_values. The other bright candidates identified in this paper could not have been recovered by our SV study because we imposed a simultaneous detection in all four passbands (Lodieu et al., 2007).
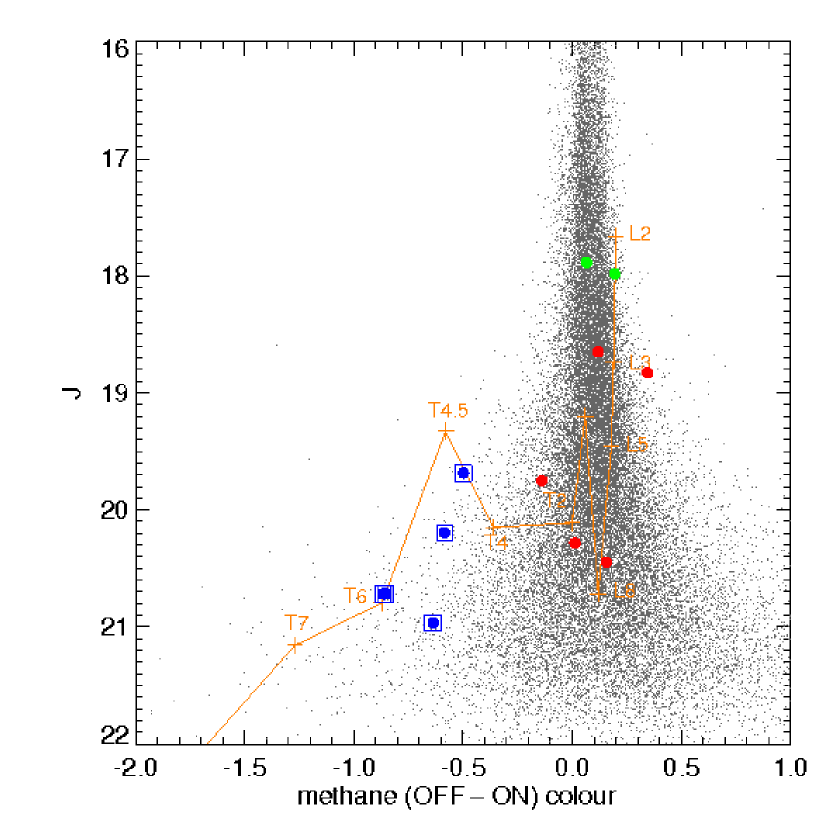
The next step was to crossmatch this catalogue of new candidates with the methane imaging data from WIRCam to look at the cluster sequence with respect to the methane colour (Figure 2). We crossmatched the full deep USco survey and the methane survey with a matching radius of 2 arcsec. The total number of common sources is 65,152 over one square degree. We also crossmatched the known spectroscopic members with the full methane survey, returning only one source, USco J160918.69222923.7 (L1; Lodieu et al., 2008) out of the 30 members covered by WIRCam (green open square in Figure 2). We identified another object with methane photometry, USco J160956.34222245.6, classified as a field L2 dwarf by Lodieu et al. (2008). Its methane colour is bluer than the young L1 type belonging to USco. We should mention that the CH4off and CH4on images saturate at about 16 mag, corresponding to roughly 17.7 and 16.7 mag in and , respectively. As a consequence, none of the bright members and new candidates will be retrieved in the methane survey. We found that five of the seven faintest ( 20 mag) new candidates from the survey have methane photometry (filled red dots in Figure 2.
5 Proper motions
In this section, we take advantage of the large epoch difference between the GCS SV and the deep survey to estimate proper motions for cluster member candidates listed in Table LABEL:tab_deepUsco:tab_candYJ_new. The baseline is of the order of three years: the GCS SV data were obtained on 12 and 19 April 2005 whereas the deep survey was carried out on 4 and 5 May 2008 taking the -band observations as reference. The baseline between the deep survey and methane observations is less than two months, too small to infer any reliable membership based on proper motion for the T dwarf candidates in Table LABEL:tab_deepUSco:CH4_candidates. The typical accuracy on the proper motion measurement is better than 10 mas/yr for the sources with photometric detections of 20 or more. This centroiding accuracy decrease linearly with the signal-to-noise, implying that sources with 10 and 5 detections have proper motion errors of the order of 14–18 mas/yr (depending on the epoch difference; 3 or 4 years) and 30 mas/yr for objects fainter than = 19 mag using the 4 year baseline, respectively. Thus, the faintest candidate identified in this survey, USco J160835.54225311.4, and classified as a proper motion non member is consistent with the USco mean motion within the error bars (Table LABEL:tab_deepUSco:PM_values).
There are 13 candidates with GCS SV astrometry. We computed their proper motions using the GCS SV as first epoch and the deep survey as second epoch. The proper motions in right ascension and declination are listed in Table LABEL:tab_deepUSco:PM_values. We show that 11 out of 13 photometric candidates exhibit proper motions within 3 of the USco mean proper motion (11,25 mas/yr), implying that they remain as probable members. We should emphasise that the same conclusion is reached when using the GCS DR8 instead of the deep as a second epoch. One of the proper motion non members, USco J161257.41230555.4, was classified as a photometric non member earlier in our analysis.
The one year baseline between the deep survey and the GCS DR8 suggests that USco J160716.98224214.1 may be a proper motion non member despite the large uncertainty. Adding this argument to its rejection as a photometric member (Section 4), this object very likely does not belong to the USco association.
| ID | R.A. (deep) | dec (deep) | Epoch deep | Epoch DR8 | Epoch SV | Comments | ||
|---|---|---|---|---|---|---|---|---|
| 9 | 16:09:03.86 | 22:23:22.2 | 2008.34153 | 2009.33973 | 2005.29863 | 23.57 | 39.19 | PM_NM |
| 11 | 16:10:00.17 | 23:12:19.3 | 2008.34426 | 2008.40713 | 2005.29863 | 6.27 | 2.42 | NM_L11a |
| 16 | 16:13:30.35 | 22:44:06.7 | 2008.34426 | 2009.33973 | 2005.27945 | 7.91 | 9.57 | PM_NM |
| 13 | 16:11:27.61 | 22:43:33.6 | 2008.34426 | 2009.33973 | 2005.27945 | 4.27 | 8.92 | |
| 10 | 16:09:05.67 | 22:45:16.7 | 2008.34153 | 2009.33973 | 2005.29863 | 0.88 | 4.58 | PM_borderline |
| 1 | 16:06:30.92 | 22:58:15.2 | 2008.34153 | 2008.40713 | 2005.29863 | 2.31 | 1.81 | |
| 14 | 16:12:44.88 | 23:02:14.0 | 2008.34426 | 2008.40713 | 2005.27945 | 13.11 | 4.20 | |
| 4 | 16:07:55.42 | 22:33:52.5 | 2008.34153 | 2009.33973 | 2005.29863 | 24.46 | 6.83 | photNM |
| 15 | 16:12:57.41 | 23:05:55.4 | 2008.34153 | 2008.40713 | 2005.27670 | 92.03 | 8.75 | photNM |
| 7 | 16:08:42.38 | 22:23:25.9 | 2008.34153 | 2009.33973 | 2005.29863 | 11.71 | 24.37 | photNM |
| 5 | 16:08:12.99 | 23:04:31.4 | 2008.34153 | 2008.40713 | 2005.29863 | 10.50 | 20.09 | |
| 12 | 16:11:05.28 | 22:22:57.3 | 2008.34426 | 2009.33973 | 2005.27945 | 3.69 | 14.03 | photNM |
| 6 | 16:08:35.54 | 22:53:11.4 | 2008.34153 | 2009.33973 | 2005.29863 | 44.36 | 3.29 | PM_NM |
6 Spectroscopic follow-up
In this section, we analyse the optical and near–infrared cross–dispersed spectra of four candidates identified in the 0.95 square degree area in the central part of the USco association common to the and methane surveys.
6.1 Spectral analysis
In this section, we discuss the spectral properties of the four photometric candidates whose spectral energy distribution resembles that of L-type dwarfs.
The X–Shooter spectra of USco J160755.42223352.52 and USco J160842.38222325.86 have much better signal–to–noise than the other two sources. In the visible arm, the spectrum of USco J160842.38222325.86 appears redder towards longer wavelengths, suggesting a later spectral type. The same trend is seen in the –band region of the near–infrared arm whereas the –band region appears quite similar. The near–infrared spectra of the two fainter photometric candidates are very similar to the spectrum of USco J160755.42223352.52 despite the low signal–to–noise and the presence of many sky lines not well removed by the current version of the X-shooter pipeline. A more quantitative comparison is unfortunately not possible at this stage.
All of the four photometric candidates discussed here look like field mid- to late-L dwarfs. For example, they do not harbour the peaked-shape in the –band typical of young L–type brown dwarfs identified in star forming regions (e.g. Allers et al., 2007; Lodieu et al., 2008), pointing towards age later than a few hundred Myrs. We compared our spectra to low resolution near–infrared of “template” brown dwarfs observed with the NIRSPEC spectrograph (McLean et al., 2003). We found that the and regions of our near–infrared spectra are best fit by the NIRSPEC spectra of 2MASS J150747691627386 (L5; Reid et al., 2000; Kirkpatrick et al., 2000; Knapp et al., 2004) overplotted in red on the best signal-to-noise spectra in Fig. 4. The uncertainty on the spectral type is of the order of one subclass, suggesting that the four object are L4–L6 field dwarf. The optical spectrum of USco J160755.42223352.52 confirm such a spectral type whereas USco J160842.38222325.86 may be slightly later by 1 or 2 subclass, possibly L8 according to its optical shape.
Moreover, we measured a few gravity–sensitive doublets, including the KI doublets at 1.168/1.177 and 1.243/1.254 microns and the NaI doublet at 1.268 microns, to add constraints on the age of these L-type candidates and their membership of the USco association. These doublets have been extensively used in the literature to disentangle field brown dwarfs from young substellar objects (e.g. McGovern et al., 2004; Allers et al., 2007; Cushing et al., 2005; Lodieu et al., 2008; Lafrenière et al., 2010; Bonnefoy et al., 2010). We resolved the KI doublets at the resolution of the X–Shooter spectra but not the NaI doublet which is also affected by a strong sky line which removes about 10% of the flux in this region. We measured their pseudo–equivalent widths after smoothing the –band spectra by a factor of 20 with a weighted sum procedure. We used the task SPLOT to carry out such measurements. Typical error bars on the measurements are 1–2 Å for the two brightest sources and 2–3 Å for the faintest candidates. The values reported in Table LABEL:tab_deepUSco:NIR_spectral_indices for these three doublets confirm that these sources are old L dwarfs because of the presence of strong equivalent widths. Hence, we classify these four photometric candidates as mid- to late-L field dwarfs and reject them as members of the USco association.
| USco J… | KI | KI | NaI |
|---|---|---|---|
| 1.168/1.177 | 1.243/1.254 | 1.268 | |
| 160716.98224214.06 | 12.613.4 | 12.615.0 | 13.7 |
| 160755.42223352.52 | 9.28.2 | 8.48.4 | 6.5 |
| 160835.54225311.37 | 19.49.3 | 7.37.5 | 12.7 |
| 160842.38222325.86 | 9.212.2 | 7.46.2 | 7.1 |

6.2 Properties of the quasar
In this section we discuss the properties of the quasar found in our search for ultracool brown dwarfs in USco. It is interesting to see that a methane search for substellar objects can be contaminated by quasars at low redshift (Goldman et al., 2010). Its spectrum is shown in Fig. 6
In the extracted spectrum of USco J160900.40–231150.95, we identify strong, broad Balmer emission lines typical of quasars. As shown in Fig. 6, narrower Oxygen, Neon, and Carbon lines are found in addition to the Balmer lines, and from these lines we determine an average redshift of 0.87890.0002.
Compared to a composite spectrum of quasars from the SDSS Vanden Berk et al. (2001) the H and [OIII] 4959,5007 lines have similar strengths relative to the continuum flux, while the H emission is stronger by a factor of 8. Apart from the strong lines, the continuum slope is consistent with the average quasar spectral slope. These characteristics arise when the emission from the quasar broad line region is partly absorbed by dust in a non-uniform dust configuration, which allows the quasar continuum emission to pass though relatively un absorbed. Since H falls within the band at the redshift of the quasar, the red colour is dominated by the excess emission from this line.

7 Discussion: testing the fragmentation limit at 5 Myr
In this section, we summarise the results and put our results into context discussing the possible turn down of the mass function in the context of theory of fragmentation limit.
Out of the 16 candidates identified in the deep survey presented here, we are left with four candidates with photometry and proper motions consistent with the USco mean motion. Three of these four candidates are brighter than the GCS limit and outside the GCS coverage; one being fainter and new. We identified another photometric candidates based on its colour only as well as five potential young T dwarfs in the methane survey without optical counterpart.
Our new deep survey is approximately 2 magnitudes deeper in both and filters than the 5 completeness limits of the UKIDSS GCS. We identified one candidate with a magnitude comparable to the depth of the GCS and another at the limit of the deep survey, suggesting that this new study has revealed at most one new low-mass brown dwarf in USco. Indeed we do not confirm any new candidates in the = 20–22 mag range and identified only one new photometric candidate (not counting the T dwarf candidates that require additional follow-up). The lowest mass brown dwarf identified in the GCS and confirmed spectroscopically (Lodieu et al., 2008) has an effective temperature of 1800 K and a mass of 8 MJup according to the DUSTY models (Chabrier et al., 2000). If we consider that our new survey is roughly two magnitudes deeper, this would correspond to masses of 3–4 MJup following predictions from the dust-free COND models (Baraffe et al., 2002). Overall, this result is puzzling because we find many candidates that look like USco photometric members in various colour-magnitude diagrams which we rejected later on the basis of their astrometry and/or spectroscopy.
In our studies of the central region of the USco association, we confirmed spectroscopically 14 members with masses in the 0.02–0.01 M⊙ over 6.5 square degrees (Lodieu et al., 2007, 2008; Lodieu et al., 2011). This mass range corresponds roughly to = 15–17.2 mag according to the DUSTY models of the Lyon group (Chabrier et al., 2000). We want to address the following question: how many new brown dwarfs do we expect down to the limit of our deep survey covering 1.7 square degree. If we assume a constant mass function in the next mass bin chosen as 0.01–0.005 M⊙ (corresponding to 17.2–21.5 mag), we would expect 14/6.5*1.7=3.7 members. However, if we extrapolate the field mass function in the same mass bin considering that we found a factor of three difference in the number of objects compared to our spectroscopic mass function (Lodieu et al., 2011), we would expect 1.2 objects in our deep survey. Hence, the one photometric candidate we extracted in our deep survey is consistent with the low limit of those predictions.
We estimated the number of field T0–T8 dwarfs expected in our deep survey covering 1.7 square degrees down to = 21.5 mag. Pinfield et al. (2008) found 26–44 T0–T8 dwarfs in 280 square degrees surveyed by the UKIDSS Large Area Survey down to = 19 mag. Scaling these numbers to the area covered by our survey and the depth, we estimate that our survey may be contaminated by 5.0–6.6 to 8.4–11.1 field T dwarfs. However, if we consider only the methane coverage which is designed to focus on T dwarfs and which is shallower than the deep survey ( 20.2–20.3 mag), we would expect 1–2 T dwarfs compared to our five candidates listed in Table LABEL:tab_deepUSco:CH4_candidates. These numbers suggest a high level of contamination of at least 20 to 40% among our T dwarf candidates. This result is in line with the classification of four of the faint photometric candidates as spectroscopic non members.
Although we are missing additional membership constraints on the potential T dwarf candidates presented here, we are in a position to discuss a possible turn down in the mass function as we approach the fragmentation limit in USco as our deep survey has not revealed any new spectroscopic late-L or T dwarf. Independent works in Orionis by Bihain et al. (2009) and Peña Ramírez et al. (2011) presented deep infrared and methane surveys with similar depths in terms of mass as our study where the numbers of T-type member candidates seem to fall down below 6 Jupiter masses because none of the T dwarfs announced to date in this region has been unambiguously confirmed astrometrically and spectroscopically. However, the spectral sequence in Orionis extends down to late-L dwarfs (Barrado y Navascués et al., 2001; Martín et al., 2001) while our USco sequence currently stops at early-L dwarfs or possibly mid-L if we include the planetary-mass companion found by Lafrenière et al. (2010) around a solar analog despite the possible excess of brown dwarfs seen in USco (Preibisch & Zinnecker, 2002; Slesnick et al., 2008; Lodieu et al., 2011). Our survey seems to favour a turn down in the USco mass function below 10 Jupiter masses but a wider survey as deep the one presented here is needed to improve the statistics and confirm this possible turn down. We cannot yet argue that we have reached the fragmentation limit in USco. To conclude, T-type members with masses below a few Jupiter masses seem to be rare at very young ages (10 Myr), placing an upper limit on the smallest fragments that star formation processes can form (Low & Lynden-Bell, 1976; Rees, 1976; Boss, 2001).
8 Summary and outlook
We have presented the outcome of deep photometric survey of 0.95 square degree in the USco association combining near-infrared and methane imaging. We identified 16 new candidates in 1.7 square degrees surveyed in and , leaving four probable members including at the limit of our survey after applying additional photometric and astrometric constraints from various surveys taken at different epochs. Near-infrared spectroscopy of four of the faintest candidates has shown that their are old field mid-L dwarfs contaminating our photometric search while the other is a quasar at low redshift. Moreover, we also extracted five potential methane T dwarf candidates without optical counterparts and reasonable colours. The lack of new spectroscopic members in USco in a survey two magnitudes deeper than the UKIDSS GCS points towards a turn down in the USco mass function or may suggest that we have reached the fragmentation limit in the association.
Spectroscopy of these faint T dwarf candidates is difficult with ground-based facility, suggesting that these sources may be ideal targets for the James Webb Space Telescope and the future E-ELT. Proper motion confirmation is a more affordable option to confirm the membership of these T dwarfs to the USco association very soon with a second epoch. Furthermore, the advent of the Visible Infrared Survey Telescope for Astronomy (VISTA; Emerson, 2001) will allow to cover larger areas in smaller numbers of pointing to improve the statistics and confirm (or otherwise) that we have reached the fragmentation limit in USco.
Acknowledgments
NL was funded by the Ramón y Cajal fellowship number 08-303-01-02 and the national program AYA2010-19136 funded by the Spanish ministry of science and innovation. NL thanks Loïc Albert and Patrick Hudelot for their help in the preparation of the observing blocks and the data reduction, respectively. LS thanks NL for funding her one week stay at the IAC, Tenerife.
This work made use of data taken with various telescopes and instruments in visitor and service mode. The infrared data with Wide Field Camera (WFCAM) on the United Kingdom Infrared Telescope (UKIRT), operated by the Joint Astronomy Centre (JAC) on behalf of the Science and Technology Facilities Council (SFTC) of the United Kingdom (UK). The methane ON and OFF data are based on observations obtained with WIRCam, a joint project of CFHT, Taiwan, Korea, Canada, France, and the Canada France Hawaii Telescope (CFHT) which is operated by the National Research Council (NRC) of Canada, the Institute National des Sciences de l’Univers of the Centre National de la Recherche Scientifique of France, and the University of Hawaii. We acknowledge the Terapix team at the Institut d’Astrophysique de Paris that produced the images and catalogues used in this work, with special thanks to Patrick Hudelot. The X-Shooter spectroscopy is based on observations made with ESO telescopes at the La Silla Paranal Observatory under programme ID 385.C-0950 in service mode.
This research has made use of the Simbad and Vizier databases, operated at the Centre de Données Astronomiques de Strasbourg (CDS), and of NASA’s Astrophysics Data System Bibliographic Services (ADS).
This publication makes use of data products from the Two Micron All Sky Survey (2MASS), which is a joint project of the University of Massachusetts and the Infrared Processing and Analysis Center/California Institute of Technology, funded by the National Aeronautics and Space Administration and the National Science Foundation.
This publication makes use of data products from the Wide-field Infrared Survey Explorer, which is a joint project of the University of California, Los Angeles, and the Jet Propulsion Laboratory/California Institute of Technology, funded by the National Aeronautics and Space Administration.
References
- Allers et al. (2007) Allers K. N., et al. 2007, ApJ, 657, 511
- Alves de Oliveira et al. (2010) Alves de Oliveira C., Moraux E., Bouvier J., Bouy H., Marmo C., Albert L., 2010, A&A, 515, A75
- Ardila et al. (2000) Ardila D., Martín E., Basri G., 2000, AJ, 120, 479
- Baraffe et al. (1998) Baraffe I., Chabrier G., Allard F., Hauschildt P. H., 1998, A&A, 337, 403
- Baraffe et al. (2002) Baraffe I., Chabrier G., Allard F., Hauschildt P. H., 2002, A&A, 382, 563
- Barrado y Navascués et al. (2001) Barrado y Navascués D., Zapatero Osorio M. R., Béjar V. J. S., Rebolo R., Martín E. L., Mundt R., Bailer-Jones C. A. L., 2001, A&A, 377, L9
- Bertin & Arnouts (1996) Bertin E., Arnouts S., 1996, A&AS, 117, 393
- Bihain et al. (2010) Bihain G., Rebolo R., Zapatero Osorio M. R., Béjar V. J. S., Caballero J. A., 2010, A&A, 519, A93
- Bihain et al. (2009) Bihain G., et al. 2009, A&A, 506, 1169
- Bonnefoy et al. (2010) Bonnefoy M., Chauvin G., Rojo P., Allard F., Lagrange A.-M., Homeier D., Dumas C., Beuzit J.-L., 2010, A&A, 512, A52
- Boss (2001) Boss A. P., 2001, ApJL, 551, L167
- Burgasser et al. (2004) Burgasser A. J., Kirkpatrick J. D., McGovern M. R., McLean I. S., Prato L., Reid I. N., 2004, ApJ, 604, 827
- Burgess et al. (2009) Burgess A. S. M., Moraux E., Bouvier J., Marmo C., Albert L., Bouy H., 2009, A&A, 508, 823
- Burrows et al. (1997) Burrows A., Marley M., Hubbard W. B., Lunine J. I., Guillot T., Saumon D., Freedman R., Sudarsky D., Sharp C., 1997, ApJ, 491, 856
- Casali et al. (2007) Casali M., et al. 2007, A&A, 467, 777
- Casewell et al. (2007) Casewell S. L., Dobbie P. D., Hodgkin S. T., Moraux E., Jameson R. F., Hambly N. C., Irwin J., Lodieu N., 2007, MNRAS, 378, 1131
- Chabrier (2003) Chabrier G., 2003, PASP, 115, 763
- Chabrier & Baraffe (1997) Chabrier G., Baraffe I., 1997, A&A, 327, 1039
- Chabrier et al. (2000) Chabrier G., Baraffe I., Allard F., Hauschildt P., 2000, ApJ, 542, 464
- Collins et al. (2009) Collins R., Cross N. J., Sutorius E., Read M., Hambly N. C., 2009, in D. A. Bohlender, D. Durand, & P. Dowler ed., Astronomical Society of the Pacific Conference Series Vol. 411 of Astronomical Society of the Pacific Conference Series, Automated Data Deleases for the WFCAM Science Archive. p. 226
- Cross et al. (2009) Cross N. J. G., Collins R. S., Hambly N. C., Blake R. P., Read M. A., Sutorius E. T. W., Mann R. G., Williams P. M., 2009, MNRAS, 399, 1730
- Cushing et al. (2005) Cushing M. C., Rayner J. T., Vacca W. D., 2005, ApJ, 623, 1115
- Cutri et al. (2003) Cutri R. M., et al. 2003, 2MASS All Sky Catalog of point sources, 2246
- de Bruijne et al. (1997) de Bruijne J. H. J., Hoogerwerf R., Brown A. G. A., Aguilar L. A., de Zeeuw P. T., 1997, in ESA SP-402: Hipparcos - Venice ’97 Improved Methods for Identifying Moving Groups. pp 575–578
- de Zeeuw et al. (1999) de Zeeuw P. T., Hoogerwerf R., de Bruijne J. H. J., Brown A. G. A., Blaauw A., 1999, AJ, 117, 354
- Dobbie et al. (2002) Dobbie P. D., Kenyon F., Jameson R. F., Hodgkin S. T., Pinfield D. J., Osborne S. L., 2002, MNRAS, 335, 687
- Dobbie et al. (2002) Dobbie P. D., Pinfield D. J., Jameson R. F., Hodgkin S. T., 2002, MNRAS, 335, L79
- D’Odorico et al. (2006) D’Odorico S., et al. 2006, in Society of Photo-Optical Instrumentation Engineers (SPIE) Conference Series Vol. 6269 of Society of Photo-Optical Instrumentation Engineers (SPIE) Conference Series, X-shooter UV- to K-band intermediate-resolution high-efficiency spectrograph for the VLT: status report at the final design review
- Emerson (2001) Emerson J. P., 2001, in R. Clowes, A. Adamson, & G. Bromage ed., The New Era of Wide Field Astronomy Vol. 232 of Astronomical Society of the Pacific Conference Series, VISTA - Project Status of the Visible and Infrared Survey Telescope for Astronomy.. p. 339
- Geers et al. (2011) Geers V., Scholz A., Jayawardhana R., Lee E., Lafrenière D., Tamura M., 2011, ApJ, 726, 23
- Goldman et al. (2010) Goldman B., Marsat S., Henning T., Clemens C., Greiner J., 2010, MNRAS, 405, 1140
- Goldoni et al. (2006) Goldoni P., Royer F., François P., Horrobin M., Blanc G., Vernet J., Modigliani A., Larsen J., 2006, in Society of Photo-Optical Instrumentation Engineers (SPIE) Conference Series Vol. 6269 of Presented at the Society of Photo-Optical Instrumentation Engineers (SPIE) Conference, Data reduction software of the X-shooter spectrograph
- Hambly et al. (2008) Hambly N. C., et al. 2008, MNRAS, 384, 637
- Hewett et al. (2006) Hewett P. C., Warren S. J., Leggett S. K., Hodgkin S. T., 2006, MNRAS, 367, 454
- Irwin & Lewis (2001) Irwin M., Lewis J., 2001, New Astronomy Review, 45, 105
- Irwin et al. (2004) Irwin M. J., et al. 2004, eds, Optimizing Scientific Return for Astronomy through Information Technologies. Edited by Quinn, Peter J.; Bridger, Alan. Proceedings of the SPIE, Volume 5493, pp. 411-422 (2004). VISTA data flow system: pipeline processing for WFCAM and VISTA. pp 411–422
- Kirkpatrick et al. (2000) Kirkpatrick J. D., et al. 2000, AJ, 120, 447
- Knapp et al. (2004) Knapp G. R., Leggett S. K., Fan X., Marley M. S., Geballe T. R., Golimowski D. A., Finkbeiner D., Gunn J. E., 21 co-authors 2004, AJ, 127, 3553
- Kunkel (1999) Kunkel M., 1999, Ph.D. Thesis, Julius-Maximilians-Universität Würzburg
- Lafrenière et al. (2010) Lafrenière D., Jayawardhana R., van Kerkwijk M. H., 2010, ApJ, 719, 497
- Lawrence et al. (2007) Lawrence A., et al. 2007, MNRAS, 379, 1599
- Leggett et al. (2010) Leggett S. K., et al. 2010, ApJ, 710, 1627
- Liu et al. (2007) Liu M. C., Leggett S. K., Chiu K., 2007, ApJ, 660, 1507
- Lodieu et al. (2007) Lodieu N., Dobbie P. D., Deacon N. R., Hodgkin S. T., Hambly N. C., Jameson R. F., 2007, MNRAS, 380, 712
- Lodieu et al. (2011) Lodieu N., Dobbie P. D., Hambly N. C., 2011, A&A, 527, A24
- Lodieu et al. (2006) Lodieu N., Hambly N. C., Jameson R. F., 2006, MNRAS, 373, 95
- Lodieu et al. (2008) Lodieu N., Hambly N. C., Jameson R. F., Hodgkin S. T., 2008, MNRAS, 383, 1385
- Lodieu et al. (2007) Lodieu N., Hambly N. C., Jameson R. F., Hodgkin S. T., Carraro G., Kendall T. R., 2007, MNRAS, 374, 372
- Low & Lynden-Bell (1976) Low C., Lynden-Bell D., 1976, MNRAS, 176, 367
- Luhman et al. (2008) Luhman K. L., Hernández J., Downes J. J., Hartmann L., Briceño C., 2008, ApJ, 688, 362
- Mainzer et al. (2011) Mainzer A., et al. 2011, ApJ, 726, 30
- Marocco et al. (2010) Marocco F., et al. 2010, A&A, 524, A38
- Marsh et al. (2010) Marsh K. A., Plavchan P., Kirkpatrick J. D., Lowrance P. J., Cutri R. M., Velusamy T., 2010, ApJ, 719, 550
- Martín et al. (2004) Martín E. L., Delfosse X., Guieu S., 2004, AJ, 127, 449
- Martin et al. (2010) Martin E. L., et al. 2010, A&A, 517, A53
- Martín et al. (2001) Martín E. L., Zapatero Osorio M. R., Barrado y Navascués D., Béjar V. J. S., Rebolo R., 2001, ApJL, 558, L117
- McGovern et al. (2004) McGovern M. R., Kirkpatrick J. D., McLean I. S., Burgasser A. J., Prato L., Lowrance P. J., 2004, ApJ, 600, 1020
- McLean et al. (2003) McLean I. S., McGovern M. R., Burgasser A. J., Kirkpatrick J. D., Prato L., Kim S. S., 2003, ApJ, 596, 561
- Modigliani et al. (2010) Modigliani A., et al. 2010, in Society of Photo-Optical Instrumentation Engineers (SPIE) Conference Series Vol. 7737 of Presented at the Society of Photo-Optical Instrumentation Engineers (SPIE) Conference, The X-shooter pipeline
- Monet et al. (2003) Monet D. G., et al. 2003, AJ, 125, 984
- Moraux et al. (2003) Moraux E., Bouvier J., Stauffer J. R., Cuillandre J.-C., 2003, A&A, 400, 891
- Patten et al. (2006) Patten B. M., et al. 2006, ApJ, 651, 502
- Peña Ramírez et al. (2011) Peña Ramírez K., Zapatero Osorio M. R., Béjar V. J. S., Rebolo R., Bihain G., 2011, ArXiv e-prints
- Pinfield et al. (2008) Pinfield D. J., Burningham B., Tamura M., Leggett S. K., Lodieu N., Lucas P. W., Mortlock D. J., 28 co-authors 2008, MNRAS, 390, 304
- Preibisch et al. (2001) Preibisch T., Guenther E., Zinnecker H., 2001, AJ, 121, 1040
- Preibisch et al. (1998) Preibisch T., Guenther E., Zinnecker H., Sterzik M., Frink S., Roeser S., 1998, A&A, 333, 619
- Preibisch & Zinnecker (2002) Preibisch T., Zinnecker H., 2002, AJ, 123, 1613
- Puget et al. (2004) Puget P., et al. 2004, in A. F. M. Moorwood & M. Iye ed., Society of Photo-Optical Instrumentation Engineers (SPIE) Conference Series Vol. 5492 of Society of Photo-Optical Instrumentation Engineers (SPIE) Conference Series, WIRCam: the infrared wide-field camera for the Canada-France-Hawaii Telescope. pp 978–987
- Rees (1976) Rees M. J., 1976, MNRAS, 176, 483
- Reid et al. (2000) Reid I. N., Kirkpatrick J. D., Gizis J. E., Dahn C. C., Monet D. G., Williams R. J., Liebert J., Burgasser A. J., 2000, AJ, 119, 369
- Scholz et al. (2009) Scholz A., Geers V., Jayawardhana R., Fissel L., Lee E., Lafreniere D., Tamura M., 2009, ApJ, 702, 805
- Scholz & Jayawardhana (2008) Scholz A., Jayawardhana R., 2008, ApJL, 672, L49
- Skrutskie et al. (2006) Skrutskie M. F., et al. 2006, AJ, 131, 1163
- Slesnick et al. (2006) Slesnick C. L., Carpenter J. M., Hillenbrand L. A., 2006, AJ, 131, 3016
- Slesnick et al. (2008) Slesnick C. L., Hillenbrand L. A., Carpenter J. M., 2008, ApJ, 688, 377
- Tinney et al. (2005) Tinney C. G., Burgasser A. J., Kirkpatrick J. D., McElwain M. W., 2005, AJ, 130, 2326
- Tokunaga et al. (2002) Tokunaga A. T., Simons D. A., Vacca W. D., 2002, PASP, 114, 180
- Vanden Berk et al. (2001) Vanden Berk D. E., et al. 2001, AJ, 122, 549
- Vrba et al. (2004) Vrba F. J., et al. 2004, AJ, 127, 2948
- Walter et al. (1994) Walter F. M., Vrba F. J., Mathieu R. D., Brown A., Myers P. C., 1994, AJ, 107, 692
- Wright et al. (2010) Wright E. L., et al. 2010, AJ, 140, 1868
- Zapatero Osorio et al. (2002) Zapatero Osorio M. R., Béjar V. J. S., Martín E. L., Rebolo R., Barrado y Navascués D., Mundt R., Eislöffel J., Caballero J. A., 2002, ApJ, 578, 536
- Zapatero Osorio et al. (2008) Zapatero Osorio M. R., Béjar V. J. S., Bihain G., 10 co-authors 2008, A&A, 477, 895