On cyclic activity of the Sun and solar-type stars
E. A. Bruevich a and G. S. Ivanov-Kholodnyj b
a Sternberg Astronomical Institute, Moscow State University,
Universitetsky pr., 13, Moscow 119992, Russia
b Pushkov Institute of Terrestrial Magnetism,
Ionosphere and Radio Wave Propagation of Russian
Academy of Science, Troitsk, Moscow Region, Russia
e-mail: ared-field@yandex.ru, b gor@izmiran.trotsk.ru
Abstract. The cyclicity of 33 solar-type stars that are similar to 11-year and to the quasi-biennial variations of solar radiation have studied. Our calculation were based on new simultaneous observations of the flux variations of the photospheric and chromospheric emissions of 33 solar-type stars and the Sun during the HK project that were conducted over the last 20 years. The method of Fast Fourier Transform was applied to these observed data. In addition to the known cyclic chromospheric emission variations of stars at the 11-year time scale, which were discovered at the Mount Wilson Observatory, we found a recurrences on the quasi-biennial time scale. The results of calculations of periods of the star’s fluxes variations at the 11-year and quasi-biennial time scales are presented.
Key words. Sun and late-type stars: cyclic activity, chromospheric emission.
1. Introduction
The photospheric observations of stars with active atmospheres that have been conducted regularly in the optical range since the middle of the 20th century found out low-amplitude variability in some of them, which is mainly caused by the presence of dark spots on the surfaces of stars, such as sunspots. Later, at the Mount Wilson Observatory an extensive program of simultaneous observations of more than a hundred stars with solar-type chromospheric activity was launched. The chromospheric activity indices for solar-type stars were studied by ((Baliunas, Donahue & Soon W. 1995; Lockwood et al. 2007) at Mount Wilson observational program during 45 years, from 1965 to present time.
In the framework of the HK project the relationship of the flux in the centers of the H and K Ca II emission lines (396.8 and 393.4 nm respectively) to the fluxes in the nearby continuum (400.1 and 390.1 nm respectively) is determined. This relationship is called the index by authors of the project. It’s known that the index is a good indicator of the chromospheric activity of the Sun and stars.
Here, we use new data of simultaneous observations of photospheric and chromospheric fluxes variations of the Sun and 33 solar-type stars, obtained during the last 20 years at the Lowell (photometric observations) and Smithsonian observatories (observations of the H and K Ca II emission lines) of Stanford University during the HK project We use these data for the calculation of the cyclic activity periods of the fluxes variations of the Sun and stars.
Observations of stars give us information only about the magnitude of radiation fluxes from the full disk. By choosing stars that are closest in their characteristics to the Sun, we transfer knowledge about the physical processes in the solar atmosphere to these stars, which makes it possible to successfully interpret their in radiation flux variations. Naturally, the Sun and every single solar-like stars differ in their mass, average density, surface temperature, the total area of sunspots, their contrast, the dependence of the temperature of the photosphere and chromosphere on the different altitudes, sizes and contrast of faculae, and many other parameters.
Analysis of the observations of radiation flux variations of the Sun and solar-type stars suggests that the structures of the atmospheres of most of these stars are similar to that of the Sun. The parameters that differ depend on the mass of a star, its spectral class, age, chemical composition, and so on. Such an approach makes it possible to successfully interpret the observations of variations of radiation fluxes of many solar-type stars, considering the stars as analogs of the Sun, particulary at different stages of evolution.
In this work we confirm the existence of cyclic variations of the radiation in the quasi-biennial time scale for the majority of the studied solar-type stars, as well as to determine the periods of these variations.
2. Long-term changes in the activity of solar-type stars
In this paper we consider the cyclic variation of Sun’s and star’s atmospheres fluxes at 11-year and quasi-biennial time scales. Note than the duration of the so-called 11-year solar activity varies from 8 to 15 years according to many years of observations. This includes regular observations of solar activity during the last one and half centuries, as well as circumstantial evidence, including radionuclide and other types of evidence on timescales of 1000 years. The main indices of solar activity that characterize the study of the full solar disk radiation are the Wolf numbers (the longest series of observations) and the radio flux at 10,7 cm wavelength (). Extra-earth atmospheric observations in the ultraviolet and X-ray ranges of the whole solar disk and of individual active regions (characterizing the activity at different altitudes of the atmosphere) were started in the 1960s. Unfortunately, these observations, which are important for understanding the nature of the solar activity, are less regular compared with ground-based observations of Wolf numbers and . They depend on the operation time of the corresponding instruments in the circumterrestrial orbit. However, according to numerous studies of solar activity indices, in particular, flows in individual lines in short-wave region, all of them correlate well with Wolf numbers and with a more objective index of activity .
For the HK project stars, periods of 11-year cyclic activity (according to observations (Lockwood et al. 2007) during 40 years change a little for one stars and range from 7 to 20 years for various stars with established activity (about 30% of the total number of stars studied in this project). By analogy with the detailed study of formations on the Sun, the formations on the disk that are responsible for the atmospheric activity without flares of solar-type stars include spots and faculae in the photosphere, flocculi in the chromosphere, and prominences and coronal mass ejections in the corona. Areas where all these phenomena are observed together are known as centers of activity or active regions. Thus, when analyzing radiation fluxes in the H and K Ca II lines (which are sensitive to chromospheric activity) and flows from the entire disc in broadband filters of the photospheric ubvy-system close to standard UBV-system as was shown in (Lockwood et al. 2007) it’s necessary to take into account for the Sun and the stars the contribution from the existing disk’s active regions. Active regions are formed where strong magnetic fields emerge from underneath the photosphere. In other words, the different manifestations of the activities of the atmospheres of the Sun and stars are the result of the magnetic fields evolution. This involves both global and local magnetic fields. Their interaction with the magnetized substance in subphotospheric layers of stars involved in convective motion is also important. By their size and lifetime active regions vary greatly. They can be observed from several hours to several mouths.
It was shown that from all solar-type stars that belong to stars of spectral classes F,G and K of the main sequence on the Hertzsprung-Russell diagram, a regular cyclicity of chromospheric activity of the solar type is more common for stars of the late spectral classes G and K with sufficiently formed subphotospheric convective zones as was shown in (Bruevich, Katsova & Sokolov 2001). These stars rotate relatively slow on their axes (the rotation period is about 25 - 45 days, in contrast to 3 -10 days for stars with thin subphotospheric convective zones).
The Sun, a star of G2 class, rotates with the period of 25 days. The rotation period around their axes for a sample of studied stars, their spectral classes, the quality of their 11-year cyclicity and values of respective periods , according to prior calculations made in (Baliunas, Donahue & Soon W. 1995) are given in Table. We mentioned that all the interpretations of variations in radiations fluxes of stars are based on the assumption that solar-type stars (and it is confirmed by all observations) have the same active regions, which evolve in one or more periods of rotation around their axes by the same laws that operate on the Sun.
In addition, the time dependence of variations of the radiation flux from the Sun and stars, which takes into account the rotational modulation (the time scale is about 1 month), on large scales (of approximately several years) takes the form of a sine wave with a period of corresponding to the 11-year scale of cyclic activity. Based on the example of changes in radiation fluxes in the H and K CaII lines for the Sun and stars (as we see in (Lockwood et al. 2007) ) that the amplitude of the sine wave varies slightly from cycle to cycle. The change in the amplitude of the light curves of stars for each cycle depends on the contribution of preexisting and already decayed active regions in the so-called background radiation in chromospheric lines. An additional contribution to the amplitude increased in chromospheric lines is made by brightness increase from so-called chromospheric network at the peak of a cycle.
3. Method and calculations
Solar and stellar activity is a combination of regular manifestation of characteristic entities in the atmosphere, which are associated with the release of large amounts of energy, whose frequency and intensity change cyclically.
We use the Sun’s and star’s observed data taken from the (Lockwood et al. 2007). In this work (for the first time) the results of observations were published in the form of the smoothed curves overlaid on the everyday observed data. These smoothed curves were informative data which have been corrected with a glance of Sun’s and star’s rotation. (Kollath & Olah 2009) used the wavelet method for the determination of the EI Eri flux variations period on quasi-biennial time scale. They used both the data which were corrected with a glance of star’s rotation (smoothed curves of fluxes variations) and the data not corrected for star’s rotation. Their calculations showed that the use of the smoothed data curves were preferred in such calculations because of smaller volume of calculation actions without any losses of accuracy.
We used observations of radiation fluxes in chromospheric lines (the index). We have scanned (with help of the Microlab Origin 7.5 program’s package) the 33 star’s and the Sun’s observed data from (Lockwood et al. 2007). After the scanning of these data ( index observations of 33 stars and the Sun) we obtained the observational series with equal time interval data.
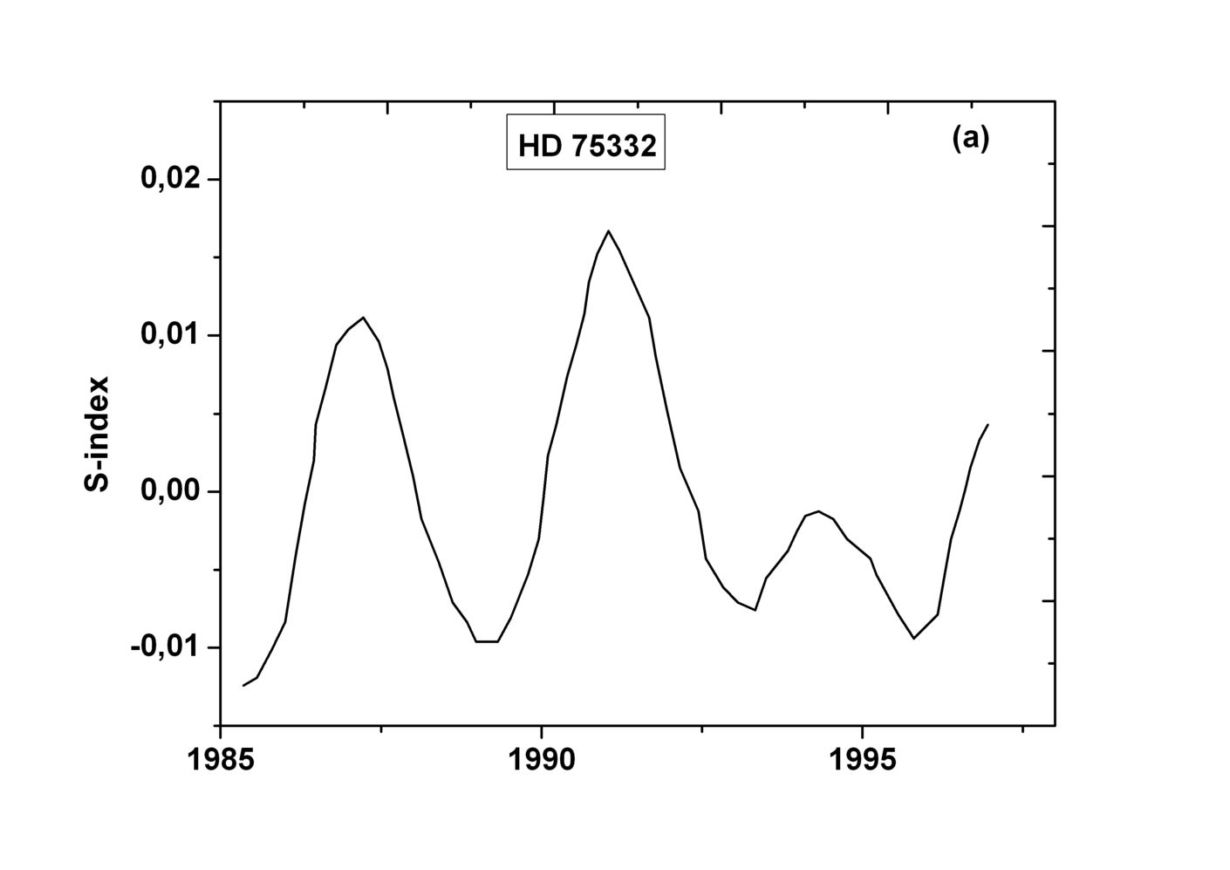
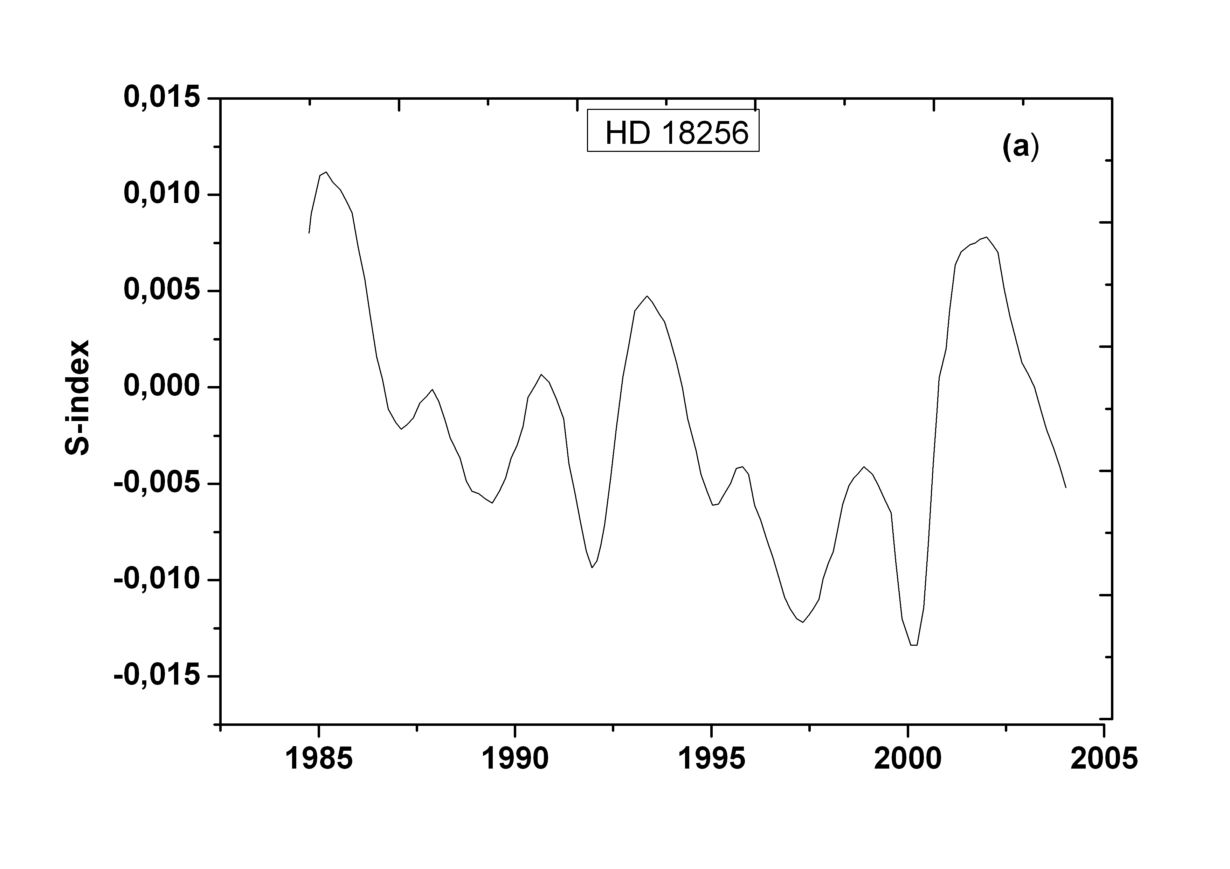
Figures 1a and 2a show the scanned smoothed curve of the stars HD 75332 and HD 18256 (these stars we selected as illustration of our calculations).
Then the method of Fast Fourier Transform (FFT) was applied to these scanned data.
A FFT is an easy way to show the dominant frequencies in a signal. We used the Microsoft Excel Data Analysis package to make a FFT graphs.
In the Microsoft Excel we opened a blank spreadsheet.
We added the following titles to the first cells in columns A, B, C, D and E of the spreadsheet: Time, Data, FFT Frequency, FFT Magnitude and FFT Complex. We formed the columns of Time (first column A) and Data (second column B - our scanned data).
In our case we took 128 points - our scanned data. We used the observed data obtained during about 20 years). The sampling rate by the number of samples was equal to 128/19,6 points per year for HD 18256 calculations and equal to 128/20,2 for HD 75332.
In the ”Time” column we determined the time at which each point was taken. Than we performed a Fourier Analysis of our data with commands: Data/Data Analysis/Fourier Analysis). The next columns C2 - C129 (FFT Frequency), D2 - D129 (FFT Magnitude) and E2 - E129 (FFT Complex) were formed with help of these commands. The output data formed the E column is called the FFT Complex because the Fourier Analysis function outputs a complex number.
In the first cell of the ”FFT Magnitude” column we typed the command of the following equation:=IMABS(E2), then we dragged this equation down so it fills every cell in this column. This action turned the complex number in the ”FFT Complex” column into a real number we can use to find the dominant frequencies. Than we calibrated the X axis of the graph to show the dominant frequencies.
We created a separate column (in our case column F) showing zero through the number of data points minus one (N-1). We created a separate cell with the following function:=(S/2)/(N/2) where S is the sampling rate, and N is the Number of samples.
In the ”FFT Frequency” column we typed the following function=F2* where F2 is the appropriate number from the number column, and denotes the function dividing the sampling rate by the number of samples. Than we dragged this function down to half of our data points (64 point only because of the overall number of data points was equal to 128.)
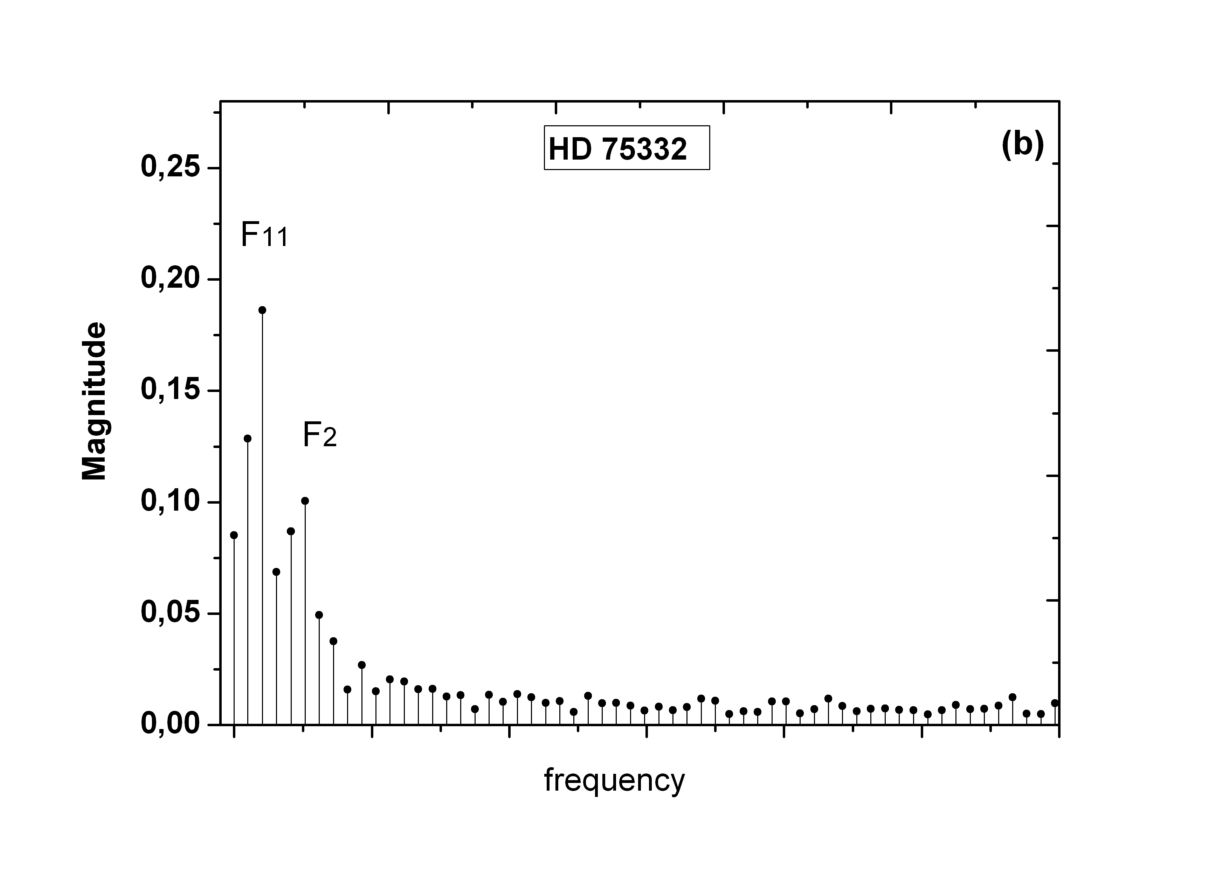
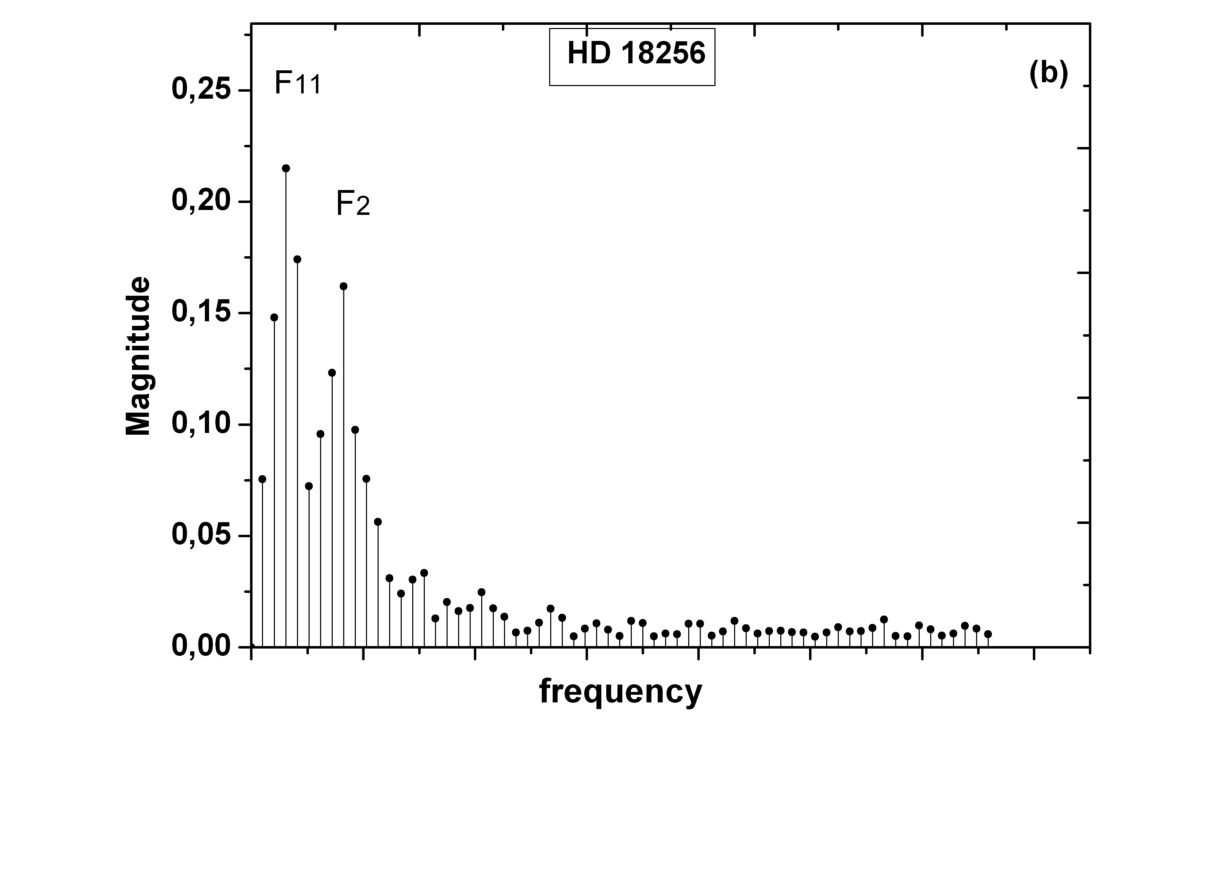
Than we created a graph (see Figures 1b and 2b) of the ”FFT Magnitude” column (Y-axis) versus the ”FFT Frequency” column (X-axis). We used this method for the determination of the periods of 11-year cyclicity (the ) and of the quasi-biennial cyclicity (the period) of chromospheric activity for the Sun and 33 stars. We also attempted to use the simultaneous photometric observations scanned (Lockwood et al. 2007) data of the 33 stars and the Sun for FFT calculations. But we understood than index observed data (very sensitive to atmospheric activity) have gone better to our purposes of determinations of periods of fluxes variations.
At Figures 1b and 2b we see graphs of HD 75332 and HD 18256 FFT calculation results with peaks where the dominant frequencies are shown. The value corresponds to and years for HD 75332 and HD 18256, the value corresponds to and year for HD 75332 and HD 18256 respectively.
For studies of the Sun, one of the most important problems is to examine the cyclical activity, which affects a number of terrestrial processes. (Kvitova & Solanski 2008) studied observed data of the regular monitoring of solar irradiance (since 1978 t0 2008) and showed that solar total and spectral irradiance varies at different time scales. (Ivanov-Kholodnyj & Chertoprud 2008) showed that the importance of the QBV problem studying was emphasized in solar-terrestrial processes. It turned out that QBV modulations of total flux of solar radiation are closely related to various quasi-biennial variations QBV processes on the Earth, in particular with the QBV of the Earth’s rotation speed, the QBV of the velocity of the stratospheric wind, etc.
In our issue we looked for cyclic variations at different time scales of HK project stars spectral irradiance. We also consider that the stars of the HK project with stable cyclical activity in the 11-year time scale, established after 40 years of continuous observations, are so similar in their cyclical activity to the Sun, that for the prediction of the radiation fluxes from these stars as was showed in (Bruevich & Bruevich 2004) methods that are used in the practice of solar forecasting are quite applicable too. These provisions confirm the similarity of the various manifestations in the evolution of the atmospheric activity of the Sun and solar-type stars. The existence of activity on the quasi-biennial time scale for stars emphasized the fact that solar activity is a phenomenon that is characteristic of the main sequence stars of late spectral classes with developed subphotospheric convective zones. The correct theory of the subphotospheric convection for Sun and solar-like stars not having been made for the present time as was mentioned in (Bruevich & Rozgacheva 2010).
The results of our calculations are shown in the Table 1. We used observations of radiation fluxes in chromospheric lines (the index). Also we have to note than and are the averaged values corresponding to the maximums of the dominant frequencies at 11-year and quasi-biennial time scales.
A dash in columns with and means that we have not identified the periodicity at a given time scale. The Table also presents results of the determination of 11-year periods of stars , determined for the first time by HK-project participants and the quality of the cyclicity of the index variations from (Baliunas, Donahue & Soon W. 1995). One can see a good agreement of these results with our calculations results of the periods.
Note that in some stars with well-determined 11-cyclicity (quality of the cyclicity is EXCELL or GOOD, as mentioned in Table 1) variations of fluxes are bimodal near the maximums of the cycle, in a similar manner to the data for the Sun (according to Sun’s and star’s observations from (Lockwood et al. 2007)).
| No | Star | Spectral | Cyclicity | |||||
|---|---|---|---|---|---|---|---|---|
| class | (days) | class [1] | (years) | (years) | (years) | |||
| 1 | Sun | G2-G4 | 25 | EXCELL | 5780 | 10.0 | 10.7 | 2.7 |
| 2 | HD1835 | G 2.5 | 8 | FAIR | 5750 | 9.1 | 9.5 | 3.2 |
| 3 | HD10476 | K1 | 35 | EXCELL | 5000 | 9.6 | 10.0 | 2.8 |
| 4 | HD13421 | G0 | 17 | UNACT | 5920 | - | 10.0 | - |
| 5 | HD18256 | F6 | 3 | FAIR | 6450 | 6.8 | 6.6 | 2.8 |
| 6 | HD25998 | F7 | 2 | UNACT | 6320 | - | 7.1 | - |
| 7 | HD35296 | F8 | 4 | UNACT | 6200 | - | 10.8 | - |
| 8 | HD39587 | G0 | 5 | UNACT | 5920 | - | 10.0 | - |
| 9 | HD75332 | F7 | 4 | UNACT | 6320 | - | 10.1 | 3.8 |
| 10 | HD76572 | F6 | 4 | POOR | 6450 | 7.1 | 8.5 | - |
| 11 | HD81809 | G2 | 41 | EXCELL | 5780 | 8.2 | 8.5 | 2.0 |
| 12 | HD82885 | G8 | 18 | FAIR | 5490 | 7.9 | 8.6 | - |
| 13 | HD103095 | G8 | 31 | EXCELL | 5490 | 7.3 | 8.0 | - |
| 14 | HD114710 | F9.5 | 12 | GOOD | 6000 | 16.6 | 12.6 | 2.0 |
| 15 | HD115383 | G0 | 3 | UNACT | 5920 | - | 10.3 | 3.5 |
| 16 | HD115104 | K1 | 18 | GOOD | 5000 | 12.4 | 11.8 | 2.7 |
| 17 | HD120136 | F7 | 4 | POOR | 6320 | 11.6 | - | 3.3 |
| 18 | HD124570 | F6 | 26 | UNACT | 6450 | - | - | 2.7 |
| 19 | HD129333 | G0 | 3 | UNACT | 5920 | - | 9.0 | 3.2 |
| 20 | HD131156 | G2 | 6 | UNACT | 5780 | - | 8.5 | 2.8 |
| 21 | HD143761 | G0 | 17 | UNACT | 5920 | - | - | - |
| 22 | HD149661 | K2 | 21 | GOOD | 4780 | 17.4 | 14.5 | 3.5 |
| 23 | HD152391 | G7 | 11 | EXCELL | 5500 | 10.7 | 10.8 | 2.8 |
| 24 | HD157856 | F6 | 4 | FAIR | 6450 | - | 11.9 | 2.6 |
| 25 | HD158614 | G9 | 34 | UNACT | 5300 | - | 12.0 | 2.6 |
| 26 | HD160346 | K3 | 37 | EXCELL | 4590 | 7.0 | 8.1 | 2.3 |
| 27 | HD161239 | G2 | 29 | FAIR | 5780 | 5.7 | 6.5 | - |
| 28 | HD182572 | G8 | 41 | UNACT | 5490 | - | 10.5 | 3.1 |
| 29 | HD185144 | K0 | 27 | UNACT | 5240 | - | 6,5 | 2.6 |
| 30 | HD190007 | K4 | 29 | FAIR | 4500 | 10.0 | 11.0 | 2.5 |
| 31 | HD201091 | K5 | 35 | EXCELL | 4410 | 12.0 | 13.7 | 2.8 |
| 32 | HD201092 | K7 | 38 | GOOD | 4160 | 12.4 | 11.7 | 2.5 |
| 33 | HD203387 | G8 | - | UNACT | 5490 | - | - | 2.6 |
| 34 | HD216385 | F7 | 7 | POOR | 6320 | - | 7.0 | 2.4 |
4. Discussion
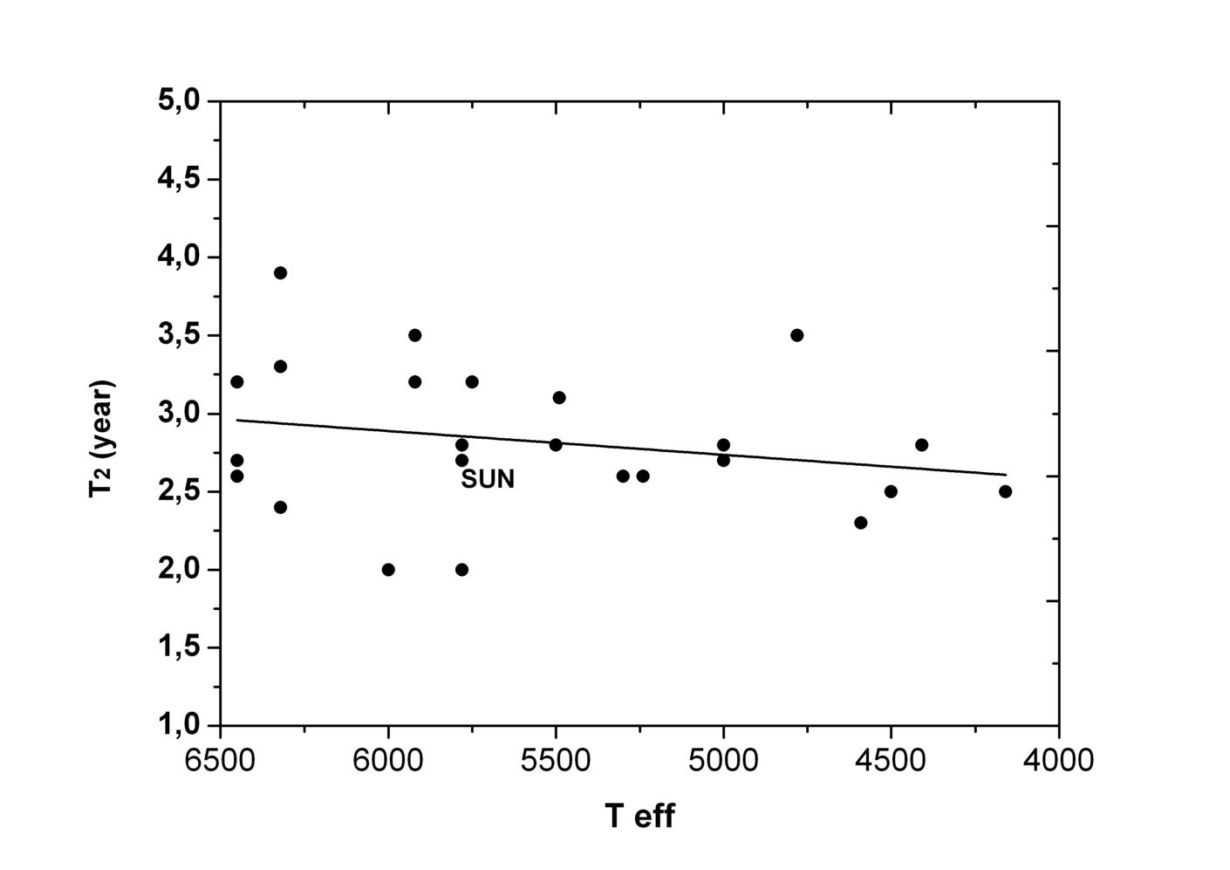
The HK project analyzed stars that belong to the solar type main sequence stars of the F5 -K7 spectral classes. We see that the values of quasi-biennial fluxes variations vary from 2,0 to 3,2 years. The observed data presented by (Lockwood et al. 2007) showed that HK project stars have about 5 - 7 complete quasi-biennial periods during the 20 years of observational time.
At Figure 3 we see dependence of quasi-biennial periods versus spectral classes of stars (or their ). We see that practically not depended from the spectral classes of stars.
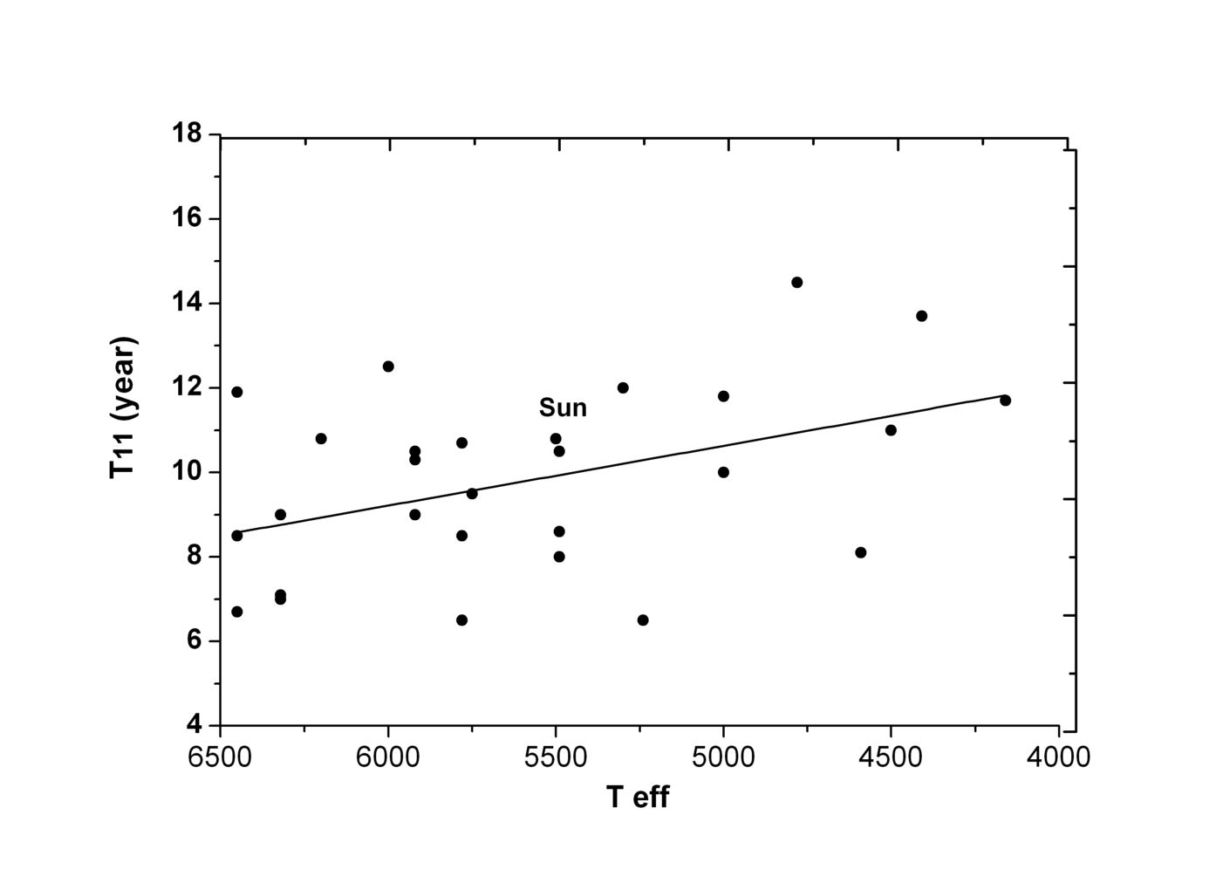
Many authors are of the opinion that the value of solar fluxes variations period in different spectral ranges (which is equal to 11 years at an average) is determined by the size and the structure of the subphotospheric convective zone. We assume that it’s interesting to analyze how the values of fluxes variations periods on the 11-year time scale differ for the stars studied here.
At Figure 4 we see the dependence of 11-year periods of fluxes variations for the solar type main sequence stars of the F5 -K7 spectral classes versus spectral classes of stars (or of their ). We see that the average values of these periods increase upon to 30-40% approximately for stars when their spectral classes change from F5 to K7.
From the theory of internal structure of the stars it’s known that the value of the size of subphotospheric convective zone change from (star’s radius) for the Sun and the stars of late F-stars and G-stars to for K and M-stars. The results of our calculations (see Figure 4.) confirm our assumption that the 11-year periods of fluxes variations for the solar type main sequence stars are connected with the sizes and structures of these star’s subphotospheric convective zones.
In the Table 1 we see that about 75% of stars from the sample from (Lockwood et al. 2007) have well-pronounced quasi-biennial fluxes variations, similar to variation of solar radiation at the same time scale. One can see that periods of quasi-biennial star’s cycles (values ) differ in the range from 2.2 to 3.8.
The preliminary analysis of the QBV of the star’s chromospheric fluxes showed that the duration of this quasi-biennial cycle is not constant during one 11-year cycle, similar to the case of QBV of Sun’s fluxes. (Khramova, Kononovich & Krasotkin 2002) showed that the duration of the QBV of Sun’s fluxes varies on average from 39 months at the beginning of the 11-year cycle to 25 months at the end of it.
5. Conclusions
A statistical analysis was conducted of observations of the Sun and 33 stars of the HK project using the fast Fourier transform. From the spectral analysis of the corresponding changes of radiation fluxes in Ca II lines we defined the periods of the 11-year cyclicity - and also revealed a recurrence that similar to the quasi-biennial solar cyclicity and determined the periods. The Table 1 shows that the periods of cycles on the 11-year scale identified by observers at Mount Wilson during the primary treatment of the HK project observations from (Baliunas, Donahue & Soon W. 1995) agree well with our periods.
It can be concluded that the QBV phenomenon of radiation fluxes is common among solar-type stars. According to our estimates, this QBV phenomenon is observed in stars about twice as often as well-determined cyclic activity in the 11-year scale. The periods of QBV cycles for the studied sampling of stars, according to our calculations, range from 2.2 to 3.8 years.
Acknowledgements The authors thank the RFBR grant 09-02-01010 for support of the work.
References
Baliunas, S.L., Donahue R.A. & Soon W. 1995, Chromospheric variations in main-sequence stars, Astrophysical Journal, 438, 269.
Bruevich, P.V. & Bruevich E.A. 2004, The possibility of simulation of the chromospheric variations for main-sequence stars, Astron. and Astrophys. Transactions, 23, N 2, 165, ArXiv e-prints (arXiv:1012.5080v1).
Bruevich, E.A., Katsova, M.M. & Sokolov D.D. 2001, Levels of coronal and chromospheric activity in late-type stars and various types of dynamo waves, Astron. Report, 78, 827.
Bruevich, E.A., & Rozgacheva I.K. 2010, On laminar convection in solar tipe stars, ArXiv e-prints (arXiv:1012.3693v1).
Ivanov-Kholodnyj, G.S. & Chertoprud, V.E. 2008, Quasi-biennial variations of the total solar flux: their manifestation in variations of the stratospheric wind and velocity of the earth rotation, Sol.-Zemn. Fiz., 2, 291.
Khramova, M.N., Kononovich, E.V. & Krasotkin, S.A. 2002, Quasi-biennial oscillations of global solar-activity indices, Astron. Vestn., 36, 548.
Kollath, Z., Olah, K. 2009, Multiple and changing cycles of active stars, ArXiv e-prints (arXiv:0904.1725v1).
Kvitova N.A., Solanki S.K. 2008, Models of solar irradiance variations: current status, J. Astrophys. Astr. 29, 151.
Lockwood, G.W., Skif, B.A., Radick R.R., Baliunas, S.L., Donahue R.A. and Soon W. 2007, Astrophysical Journal Suppl., 171, 260.