The link between the Star Formation History and Fe
Abstract
The abundance ratios between key elements such as iron and -process elements carry a wealth of information on the star formation history (SFH) of galaxies. So far, simple chemical evolution models have linked Fe with the SFH timescale, correlating large abundance ratios with short-lived SFH. The incorporation of full spectral fitting to the analysis of stellar populations allows for a more quantitative constraint between Fe and the SFH. In this letter, we provide, for the first time, an empirical correlation between Fe (measured from spectral indices) and the SFH (determined via a non-parametric spectral-fitting method). We offer an empirical version of the iconic outline of Thomas et al. (2005, 2010), relating star formation timescale with galaxy mass, although our results suggest, in contrast, a significant population of old (10 Gyr) stars even for the lowest mass ellipticals (MM⊙). In addition, the abundance ratio is found to be strongly correlated with the time to build up the stellar component, showing that the highest Fe () are attained by galaxies with the shortest half-mass formation time ( Gyr), or equivalently, with the smallest ( 40%) fraction of populations younger than 10 Gyr. These observational results support the standard hypothesis that star formation incorporates the Fe-enriched interstellar medium into stars, lowering the high abundance ratio of the old populations.
keywords:
galaxies: elliptical and lenticular, cD – galaxies: evolution – galaxies: formation – galaxies: stellar content – galaxies: structure.1 Introduction
The use of spectral indices has allowed a relatively successful description of the unresolved stellar populations of galaxies in terms of three luminosity-weighted parameters: the age, the global metallicity, and the Fe abundance ratio. The advent of new tools of analysis (e.g. spectral fitting), the increasing refinement of the population synthesis models and libraries (e.g. MILES, Sánchez-Blázquez et al., 2006a) and the access to vast spectroscopic surveys (e.g. SDSS, York et al., 2000) allows for a fresh look at well established standards. One of the current paradigms involves the existence of a relationship between Fe and the star formation timescale. On the basis of this relationship lies the assumption that the stellar abundance ratios quantify the contribution of different stellar chronometers (e.g. supernovae) to the chemical enrichment of the subsequent generations of stars. Core-collapse supernovae, triggered soon after the onset of star formation, release mostly Mg and other -process elements, whereas type Ia supernovae, with a more complex time delay, contribute large amounts of Fe (see e.g. Greggio & Renzini, 1983; Maoz et al., 2011; Mannucci et al., 2005). Hence the Fe abundance ratio is a useful tool to track star formation timescales 1Gyr (see e.g. Matteucci & Tornambé, 1987; Thomas et al., 1999; Ferreras & Silk, 2003).
By using simple chemical evolution models, Thomas et al. (2005) established a theoretical relationship between the mass of a galaxy and its SFH, described by a Gaussian function. This Gaussian curve is characterized by the mean, given by the SSP-equivalent age, and the FWHM, related to the Fe abundance ratios, such that Fe . Therefore a high abundance ratio would result from a concentrated burst of star formation, while solar, or sub-solar ratios would reveal a more extended SFH. The application of this rule to observational data by Thomas et al. (2005) and Thomas et al. (2010) produced an iconic outline (figure 9 in Thomas et al., 2010) in which massive galaxies show older and narrower stellar age distributions compared to their less massive counterparts.
There are tools currently available to produce more detailed SFHs than the Gaussian curves described above. The use of spectral fitting (e.g. Cid Fernandes et al., 2005) allows us to probe the full range of populations, giving a more robust estimate of mass-weighted properties. Furthermore, our methodology follows a non-parametric approach, with the goal of establishing a distribution of ages that better maps the spectroscopic data. These estimates are less prone to the biases inherent in the use of luminosity-weighted properties (when using SSPs) or in the parametric assumptions (e.g. when using exponentially decaying SFHs). The analysis of the abundance ratios follows instead the traditional method based on line indices. We emphasize that both properties (SFHs and Fe ratios) are therefore extracted independently. In the future, the development of -enhanced population synthesis models (e.g. Cervantes et al., 2007; Coelho et al., 2007) will open up the possibility of a fully-consistent analysis of the SFHs and the abundance ratios from a spectral fitting point of view 111 As a robustness check, we have derived galaxy SFHs also with the Cervantes et al. (2007) -enhanced SSP models, finding good agreement with the results based on the widely used, solar scaled, MILES models.
2 Sample and Analysis
Our methodology involves the analysis of the optical spectra to constrain the properties of the underlying stellar populations. The sample is extracted from the 40,000-strong SPIDER catalogue of early-type galaxies (La Barbera et al., 2010) (hereafter Paper I), which covers a redshift range of 0.05 to 0.095 and absolute magnitudes brighter than Mr = –20. The spectroscopic data come from the seventh data release (DR7) of the Sloan Digital Sky Survey (SDSS) (Abazajian et al., 2009). We take a subsample with a S/N high enough for a detailed analysis of the stellar populations. We select a set of 9,999 ETGs, belonging to the upper quartile of the distribution in S/N, as measured in the g-band (per-pixel S/N 18.3).
Stellar populations are characterized by the following information: (I) mass-weighted average ages (age) and metallicities, (II) mass-weighted star formation histories (SFHs) and (III) average Fe abundance ratios. Several techniques and models are available for the extraction of this information. In an ongoing study (de la Rosa et al. in preparation) the performance of several techniques and models has been evaluated for SDSS spectra of similar quality. The methodology chosen for the present study, as described below, results from that performance comparison.
-
I)
Average ages and metallicities are obtained through spectral fitting using the STARLIGHT synthesis code (Cid Fernandes et al., 2005) to find the optimal mixture of single stellar populations (SSPs). For the present study, the basis SSPs correspond to 76 solar-scaled MILES models (Vazdekis et al., 2010). These models have a Kroupa Universal Initial Mass Function (Kroupa, 2001) and span a range of 4 metallicities, from Z/Z⊙=1/50 to 1.6, and 19 different ages, from 0.5 to 12.6 Gyr. These models are based on the MILES222www.iac.es/proyecto/miles stellar library (Sánchez-Blázquez et al., 2006a), which combines both a dense coverage of the stellar atmospheric parameters and a relatively high and nearly constant spectral resolution (FWHM=2.3Å). The fitting interval spans from 3600 to 7350Å, with emission lines and bad pixels being masked out. The extinction due to foreground dust is modelled with the CCM-law (Cardelli, Clayton & Mathis, 1989). The standard output of the spectral fitting consists of the fractional contribution of each SSP to the flux at a normalization wavelength =4020Å, converted into a stellar mass fraction by the M/L of the given SSP at , as provided by the models. The detailed population mixture of a galaxy can thus be condensed into a single parameter, the mass-weighted average age, age. The mass-weighted metallicity, Z/H, is defined in a similar way.
-
II)
The use of spectral fitting with solar-scaled MILES models provides the fractional contribution of each SSP to the total flux, allowing for the reconstruction of the SFH. Note that STARLIGHT does not assume any parametric form, describing the SFH by an arbitrary mixture of the basis SSPs. In order to account for the range of redshifts of the sample, we add the corresponding lookback time to the population ages, ranging from 0.67 Gyr (z=0.05) to 1.24 Gyr (z=0.095). Throughout this paper we assume a standard CDM cosmology with and H0=70 km/s/Mpc.
-
III)
The Fe is measured with the recent models of Thomas et al. (2011), which provide absorption-line index values for a variety of ages and element abundance ratios. Our procedure fixes the age to its SSP-equivalent value, as obtained from spectral indices H and [MgFe]’. Then, the Mgb and Fe3 = (Fe4383 + Fe5270 + Fe5335)/3 indices are compared to the -enhanced model predictions to obtain the (SSP-equivalent) Fe . To this effect, all measured indices are preliminarly corrected for both velocity and instrumental dispersion broadening. The correction functions are estimated by convolving a variety of SSP-model spectra with broadening functions of different widths.
Dynamical masses are computed with the formula MK(n)R, where n is the Sérsic index and the function K(n) is taken from Bertin et al. (2002). This assumes that mass follows light in a galaxy, and accounts for structural non-homology of galaxy light profiles, as parametrized by the Sersic . The three relevant parameters, n, Re and , are taken from Paper I.
| Parameter | units | typical rms |
|---|---|---|
| SFH age-bars | percent | 13.4 |
| age | Gyrs | 2.7 |
| Z/H | dex | 0.10 |
| Fe | dex | 0.10 |
| log(Mdyn/M⊙) | dex | 0.07 |
| Bin (log Mdyn/M⊙) | 12.0 | 11.6 | 11.0 | 10.5 |
|---|---|---|---|---|
| Log Mass interval | 11.8 – 12.2 | 11.5 – 11.7 | 10.9 – 11.1 | 10.3 – 10.7 |
| Bin members | 1024 | 1466 | 1408 | 690 |
| age (Gyr) | 10.821.68 | 10.351.91 | 9.292.22 | 7.712.45 |
| SSP-equiv. age (Gyr) | 9.072.08 | 8.742.15 | 7.972.47 | 6.612.66 |
| SSP-equiv. Fe | 0.170.09 | 0.150.09 | 0.110.09 | 0.070.10 |
2.1 Error Estimation
To estimate uncertainties on stellar population parameters, we have resorted to the 2,283 ETGs in the SPIDER sample with repeated spectral observations from the SDSS database (see Paper I). After selecting for pairs of repeated observations with S/N18.3 (i.e. that of the sample used here), a sub-sample of 393 pairs of spectra is explored with the same methodology using differences in the extracted parameters as an estimate of the expected errors. These uncertainties are summarized in table 1. It is worth mentioning that the reported errors refer to single measurements of stellar population parameters, i.e. they reflect the statistical uncertainty inherent in the extraction of SFHs from the noisy spectrum of a given galaxy. On the other hand, binned quantities in (Figs. 1-2) have much smaller uncertainties, resulting from average-stacking a large sub-sample of galaxies in each bin. The comparison of repeated measurements also shows no systematics in stellar population parameters as a function of S/N, as shown, for , in Paper I.
3 Results
3.1 The dependence of SFH with Mdyn
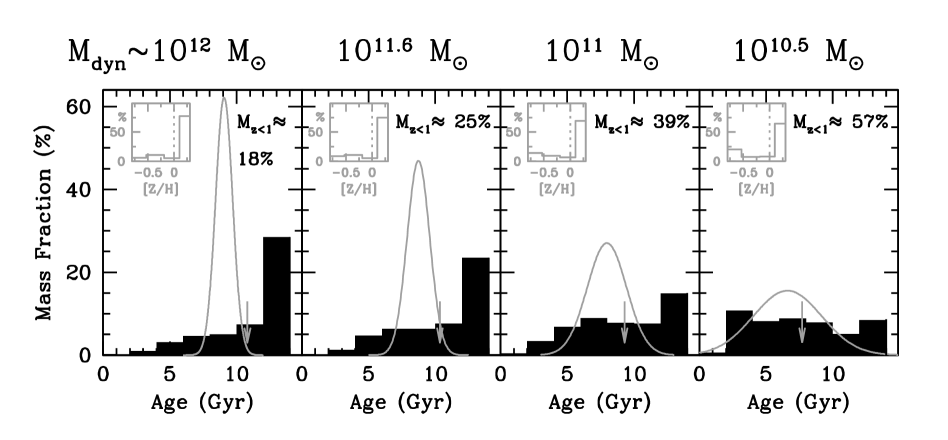
Mean SFHs are constructed for four mass bins selected to match the mass intervals of figure 9 in Thomas et al. (2010). Our results for these four mass bins are presented in Table 2, where one can see that the age, metallicity, and abundance ratio parameters actually increase with stellar mass, consistent with previous studies. Figure 1 shows the average distribution of stellar ages for the ETGs within each mass bin. We emphasize that constraints of stellar populations from spectroscopic data are more robust when dealing with relative age differences. By constructing a stacked age histogram for all galaxies within each mass bin, we give a rough estimate of the range of stellar ages to be found in galaxies of the corresponding stellar mass, i.e. an averaged star formation history. Note we use seven time intervals only (instead of the original 19 time steps from the basis SSPs) in order to achieve more robust results (see discussion in Cid Fernandes et al., 2005). The histograms combine all possible metallicities within a given age bin. It is worth mentioning that the absence of the youngest populations (t Gyr), evident in the depleted left side of the histograms, reflects the limit imposed by the lookback time related to the redshift range of the sample. We do not consider this a problem since most of the stellar populations have ages Gyr. Our extracted SFHs (filled black histogram in figure 1) are compared with the ansatz of Thomas et al. (2005, 2010) (grey Gaussian curve), which relate the mean and variance of a Gaussian SFH with the age and Fe of the underlying stellar populations. The mean of the Gaussian SFH is set to our SSP-equivalent age with an added lookback time, while the FWHM is extracted from the Fe relation given by Thomas et al. (2005).
We have also constructed stacked metallicity histograms for all galaxies within each mass bin, displaying them as grey insets in figure 1. Histograms show high percentages (60–80 %) of super-solar metallicities, with a growing contribution (from 6 to 20 %) of lowest metallicities ([Z/H]-0.5) from the highest to the lowest galaxy mass bin. This low metallicity trend might be real, or just reflect the age–metallicity degeneracy and the fact that low-[Z/H] stars in the MILES library have super-solar Fe (Milone et al., 2011). To test if this can bias our results, we have re-computed the age histograms by excluding galaxies with a significant ( 20%) low [Z/H](-0.5) population. We found no significant variation figure 1 (e.g. less than 1% variation in the SFH for age 10 Gyr).
A comparison between our SFH extraction and the Gaussian ansatz of Thomas et al. (2005, 2010), shows an overall agreement, although our non-parametric approach gives a more detailed view of the underlying SFHs. We emphasize that it is the relative difference across mass bins what should be compared and not the absolute age values, whose estimate can be significantly affected by the adopted methodology (e.g. use of spectral-fitting vs. indices) and stellar population libraries. Notice also that the center of the Gaussians does not coincide with that of the SFH histograms, as expected by the fact that luminosity-weighted ages are systematically younger than their mass-weighted counterparts (e.g. Serra & Trager, 2007; Rogers et al., 2010). Both the SFH and the Gaussians show the characteristic trend towards younger ages and more extended age distributions in lower mass galaxies.
However, figure 1 goes beyond a simple description of the SFH as a Gaussian. The non-parametric approach of STARLIGHT allows us to study in more detail the relative change of SFHs with respect to galaxy mass. One notices that over the mass range probed, all galaxies feature a significant population of old stars. If we consider the stellar mass formed at redshifts z1 (i.e. older than Gyr in a local sample) we still get about 40% of stellar mass formed even at MM⊙. Furthemore, the most massive galaxies (MM⊙) undergo an intense, short-lived period of star formation, in which over 50% of the stellar mass is formed within a very short period ( Gyr) at redshifts z4, followed by a tail of low-level star formation. After z1, only 18% of the stars are newly formed, perhaps the contribution from minor mergers that could explain the size evolution of massive galaxies (see e.g. Naab et al., 2009; Trujillo et al., 2011).
3.2 The dependence of SFH with Fe
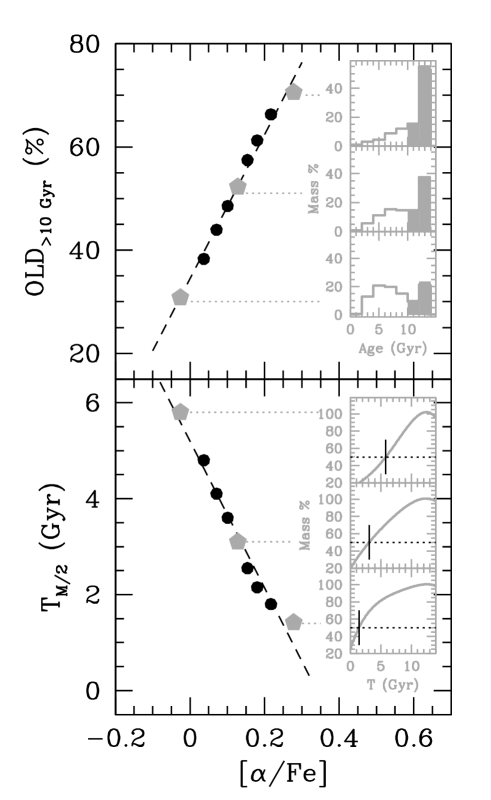
In order to confirm a link between the SFH shape with Fe, we bin the sample with respect to the abundance ratios into 9 bins, each one containing 1,111 objects. An average SFH is constructed for each bin and two parameters are defined to describe the distribution of stellar ages. The OLD parameter measures the stellar mass fraction contributed by the oldest populations, namely above 10 Gyr. The upper panel of Fig. 2 shows the increase with Fe of the OLD parameter. A simple linear regression gives for the mass fraction in old stars:
| (1) |
For clarity, three insets show the average SFHs for bins 1, 5 and 9 (corresponding to lowest, intermediate, and highest Fe). The distribution of the extracted values of the OLD parameter for galaxies within the same bin has a standard deviation around 25%. The OLD parameter in these insets corresponds to the added height of the two shaded oldest bins of the histograms. According to this result, the drop in the Fe abundance ratio is motivated by a growing fraction of younger populations on top of the prevalent old component. This result supports the standard interpretation (see e.g. Sánchez-Blázquez et al., 2006b), whereby old stellar populations, formed from primeval ingredients, show high Fe abundance ratios, further reduced by subsequent star formation episodes, which incorporate the Fe-enriched inter-stellar material into stars.
A complementary view of the same result uses the cumulative integration of the SFH to calculate the “half-mass time” (TM/2), i.e. the time needed to form 1/2 of the final stellar mass of the galaxy. We note that the initial time is set to a lookback-time of 13 Gyr for all galaxies. However, this is an arbitrary choice depending on the basis of SSP models used for the spectral fitting. The lower panel of Fig. 2 shows a decreasing Fe abundance ratio related to a growing half-mass time , revealing the connection between an extended period of star formation and the decrease of the Fe abundance ratio. Similarly to the top panel, the three insets show the average cumulative distribution of the SFH for bins 1, 5 and 9. A simple regression gives:
| (2) |
with a scatter around 2.5 Gyr (rms) for galaxies belonging to the same bin in Fe. The fiducial value for solar abundance ratios is represented, therefore, by a fraction of 34% in stars older than 10 Gyr and a half-mass formation time around 5.2 Gyr.
In general, absolute values of stellar population parameters depend significantly on methods and models used to derive them. Hence, we warn the reader that equations (1) and (2) apply exactly only to the set of models used in the present work, as well as to the lookback time scheme adopted here to bring all SFHs into a common time-frame. In other words, using equations 1 and 2 allows one to convert the Fe measured with Thomas et al. (2011) models into half-mass time and mass fraction in old (10 Gyr) stars, as they would be measured with solar-scaled MILES models and lookback times added up.
4 Conclusions
This letter presents an independent comparison between the Fe abundance ratios and the star formation history of a volume-limited sample of giant early-type galaxies (M), extracted from the Sloan Digital Sky Survey. Figure 1 shows the characteristic trend towards more extended SFHs in lower mass ETGs, in agreement with previous work (e.g. Thomas et al., 2005) but with the additional information regarding the distribution of stellar ages. We find that all ETGs in our sample have a significant fraction of very old stars (ages 10 Gyr), at variance with the simplified ansatz of a Gaussian SFH of Thomas et al. (2005, 2010). The fraction of stars formed after increases from 18% at MM⊙ up to 57% for MM⊙. This points to the young populations, formed out of a Fe-enriched medium, as responsible for the decrease of the initially high Fe abundance ratios of the old stellar components (see e.g. Sánchez-Blázquez et al., 2006b).
In addition to the SFHs, we used individual absorption lines to determine the Fe abundance ratios, following the prescriptions of Thomas et al. (2011). Figure 2 shows the correlation between these two independently estimated properties. We find a strong correlation between Fe and either the mass fraction in old (10 Gyr) stars ( parameter; top panel), or the time to form one-half of the current stellar mass of the galaxy (TM/2, bottom). Both cases give a clear picture towards enhanced Fe for the SFHs that are more short-lived. Those for which T Gyr feature highest, super-solar, abundance ratios, with Fe. Alternatively, an Fe is reached by those galaxies where the old populations ( Gyr) constitute more than 60% of the stellar mass content. These quantitative results are powerful calibrators of models of galaxy formation.
Acknowledgments
IGR acknowledges a grant from the Spanish Secretaría General de Universidades of the Ministry of Education, in the frame of its programme to promote the mobility of Spanish researchers to foreign centers. IF acknowledges a grant from the Royal Society and support from the IAC to carry out this research project. We have used data from the SDSS (http://www.sdss.org/collaboration/credits.html).
References
- Abazajian et al. (2009) Abazajian, K. N., et al. 2009, ApJS, 182, 543
- Bertin et al. (2002) Bertin, G., Ciotti, L., Del Principe, M., 2002, A& A, 386, 149
- Cardelli, Clayton & Mathis (1989) Cardelli, J. A., Clayton, G. C., Mathis, J. S., 1989, ApJ, 345, 245
- Cervantes et al. (2007) Cervantes, J.L., Coelho, P., Barbuy, B., Vazdekis, A., 2007, Proceedings IAU Symposium No. 241 ’Stellar Populations as Building Blocks of Galaxies’, A. Vazdekis and R.F. Peletier, eds, 167
- Cid Fernandes et al. (2005) Cid Fernandes, R., Mateus, A., Sodré, L., Stasinska, G., Gomes, J. M., 2005, MNRAS, 356, 270
- Coelho et al. (2007) Coelho, P., Bruzual, G., Charlot, S., Weiss, A., Barbuy, B., Ferguson, J.W., 2007, MNRAS, 382, 498
- Ferreras & Silk (2003) Ferreras, I., Silk, J., 2003, MNRAS, 344, 455
- Greggio & Renzini (1983) Greggio, L., Renzini, A., 1983, A& A, 118, 217
- Kroupa (2001) Kroupa, P. 2001, MNRAS, 322, 231
- La Barbera et al. (2010) La Barbera, F., de Carvalho, R. R., de La Rosa, I. G., Lopes, P. A. A., Kohl-Moreira, J. L., Capelato, H. V., 2010, MNRAS, 408, 1313 (Paper I)
- Mannucci et al. (2005) Mannucci, F., Della Valle, M., Panagia, N., Cappellaro, E., Cresci, G., Maiolino, R., Petrosian, A., Turatto, M., 2005, A& A, 433, 807
- Matteucci & Tornambé (1987) Matteucci, F., Tornambé, F., 1987, A& A, 185, 51
- Maoz et al. (2011) Maoz, D., Mannucci, F., Li, W., Filippenko, A. V., Della Valle, M, Panagia, N., 2011, MNRAS, 412, 1508
- Milone et al. (2011) Milone, A. de C., Sansom, A.E., Sánchez-Blázquez, P., 2011, MNRAS, 414, 1227
- Naab et al. (2009) Naab, T., Johansson, P. H., Ostriker, J. P., 2009, ApJ, 699, L178
- Rogers et al. (2010) Rogers, B., Ferreras, I., Peletier, R., Silk, J., 2010, MNRAS, 402, 447
- Sánchez-Blázquez et al. (2006a) Sánchez-Blázquez, P., Peletier, R. F., Jiménez-Vicente, J., Cardiel, N., Cenarro, A. J., Falcón-Barroso, J., Gorgas, J., Selam, S., Vazdekis, A. 2006, MNRAS, 371, 703
- Sánchez-Blázquez et al. (2006b) Sánchez-Blázquez, P., Gorgas, J., Cardiel, N., González, J. J., 2006, A&A, 457, 787
- Serra & Trager (2007) Serra P., Trager S. C., 2007, MNRAS, 374, 769
- Thomas et al. (1999) Thomas, D., Greggio, L., Bender, R., 1999, MNRAS, 302, 537
- Thomas et al. (2005) Thomas, D., Maraston, C., Bender, R., Mendes de Oliveira, C., 2005, ApJ, 621, 673
- Thomas et al. (2010) Thomas, D., Maraston, C., Schawinski, K., Sarzi, M., Silk, J., 2010, MNRAS, 404, 1775
- Thomas et al. (2011) Thomas, D., Maraston, C., Johansson, J., 2011, MNRAS, 412, 2183
- Trujillo et al. (2011) Trujillo, I., Ferreras, I, de la Rosa, I. G., 2011, MNRAS, 415, 3903
- Vazdekis et al. (2010) Vazdekis, A., Sánchez-Blázquez, P., Falcón-Barroso, J., Cenarro, J., Beasley, M. A.; Cardiel, N., Gorgas, J., Peletier, R. F. 2010, MNRAS, 404, 1639
- York et al. (2000) York, D. G., et al. 2000, AJ, 120, 1579