Model for a dune field with exposed water table
Abstract
Aeolian transport in coastal areas can be significantly affected by the presence of an exposed water table. In some dune fields, such as in Lençóis Maranhenses, northeastern Brazil, the water table oscillates in response to seasonal changes of rainfall and rates of evapotranspiration, rising above the ground during the wet season and sinking below in the dry period. A quantitative understanding of dune mobility in an environment with varying groundwater level is essential for coastal management as well as for the study of long-term evolution of many dune fields. Here we apply a model for aeolian dunes to study the genesis of coastal dune fields in presence of an oscillating water table. We find that the morphology of the field depends on the time cycle, , of the water table and the maximum height, , of its oscillation. Our calculations show that long chains of barchanoids alternating with interdune ponds such as found at Lençóis Maranhenses arise when is of the order of the dune turnover time, whereas dictates the growth rate of dune height with distance downwind. We reproduce quantitatively the morphology and size of dunes at Lençóis Maranhenses, as well as the total relative area between dunes.
keywords:
Coastal dunes , Water table , Wind erosion , Sand transport , Dune model1 Introduction
It is widely accepted that dune morphology depends fundamentally on the wind directionality and on the amount of sand available for transport (Wasson and Hyde, 1983). While longitudinal and star dunes form under bi- and multidirectional wind regimes, respectively, the best understood types of dune are formed by unidirectional wind. In this case, crescent-shaped barchans occur if the sand availability is low, while transverse dunes, which display nearly invariant profile in the direction orthogonal to the wind, form if the ground is covered with sand. The shape of dunes can be significantly modified due to natural agents such as vegetation growth (Hesp, 2002; Tsoar and Blumberg, 2002; Barbosa and Dominguez, 2004) or cementation of sand by mineral salts (Schatz et al., 2006). Modeling has brought many insights on dune formation in environments with stabilizing vegetation (Nishimori and Tanaka, 2001; Baas, 2002; Durán and Herrmann, 2006a; Yizhaq et al., 2007; Nield and Baas, 2008a, b; Luna et al., 2011). The influence of sand induration on the shape of dunes has been also investigated (Herrmann et al., 2008; Rubin and Hesp, 2009).
The water table can also play a fundamental role in sediment transport on coasts and in deserts (Kocurek et al., 1992; Ruz and Meur-Ferec, 2004; Kocurek et al., 2007; Mountney and Russell, 2009). The dynamics of the water table in some aeolian sand systems is connected with seasonal variations in climate and rainfall (Levin et al., 2009), and has been modeled by many different authors (de Castro Ochoa and Muñoz Reinoso, 1997; Kocurek et al., 2001). However, quantitatively little is known about dune field morphodynamics in presence of a varying groundwater level.
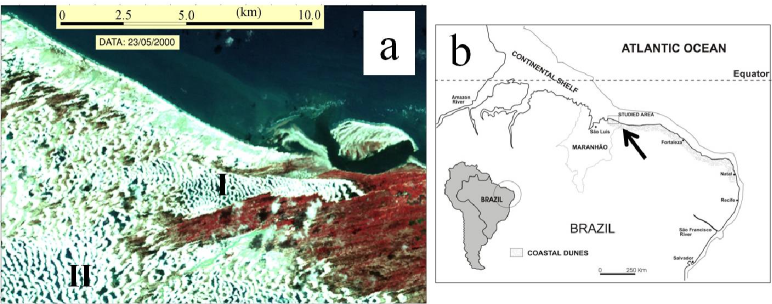
One example of dunes evolving in presence of a dynamic water table is the coastal dune field known as “Lençóis Maranhenses”, located in the State of Maranhão, northeastern Brazil (Fig. 1). Long chains of laterally linked barchans (the so-called “barchanoids”) extending over several kilometers constitute the dominant dune morphology at Lençóis (Fig. 1a). Dunes at Lençóis alternate with freshwater lagoons that form in the rainy seasons and, at some places, nearly disappear in the summer. In spite of the field research undertaken in the past (Gonçalves et al., 2003; Parteli et al., 2006; Levin et al., 2007; Kadau et al., 2009), it has remained unclear how the oscillating water table is contributing to the long-term dynamics and to the shape of dunes at Lençóis.
Understanding the effect of the water table on dune field evolution may help predict coastal dune mobility and elucidate the history of many ancient deserts (Davidson-Arnott and Pyskir, 1988; Enzel et al., 1999; Mountney and Thompson, 2002; Chen et al., 2004; Grotzinger et al., 2005; Bourke and Wray, 2011). A physically based model that accounts for a mathematical description of sand transport and for the evolution of the terrain in response to aeolian drag and variations in the groundwater level is required.
In the present work, we adapt a recently developed continuum model for aeolian dunes (Sauermann et al., 2001; Kroy et al., 2002) to study the formation of coastal dune fields in an area of exposed groundwater. This model has been applied to study different types of dune encountered in nature, and has proven to reproduce the shape of real dunes yielding quantitative agreement with measurements (Sauermann et al., 2003; Parteli et al., 2006; Durán and Herrmann, 2006a, b; Parteli and Herrmann, 2007; Durán et al., 2008; Parteli et al., 2009, 2011). The dune model encodes a mathematical description of the turbulent wind field over the terrain with a continuum model for saltation — which consists of grains hopping in ballistic trajectories close to the ground and ejecting new particles upon collision with the bed (Bagnold, 1941). Here we add to the dune model a water table that can rise and sink seasonally, thus affecting local rates of sand transport during the evolution of the dune field. In particular, we aim to understand the genesis and evolution of dunes in presence of a dynamic water level in order to shed light on the conditions leading to the dune morphologies observed at Lençóis Maranhenses.
In the next Section, we present a brief introduction about climate and wind regime of the area of Lençóis Maranhenses. In Section 3 we present a description of the dune model and its extension in order to account for the water table. The calculations of coastal dune fields are described in Section 4, while in Section 5 we present and discuss our results. Conclusions are presented in Section 6.
2 Lençóis Maranhenses
The National Park of Lençóis Maranhenses is located on the coastal area of the Maranhão State, northeastern Brazil. The area comprises 155 thousand hectares delimited by the coordinates S and , and W and (Figs. 1a,b). Climate at Lençóis is semi-humid tropical with sparse vegetation, air humidity of 68 and annual average temperature about C (IBAMA, 2003; Floriani et al., 2004).
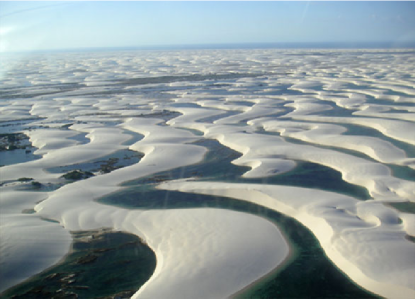
The landscape of Lençóis is characterized by the presence of long chains of barchanoids (Fig. 2) giving the impression of a crumpled sheet — hence the origin of the name: “Lençóis” means “sheets” in portugese. These dunes extend along 75 km and penetrate inland to distances larger than 20 km. They are detached from the coast by a deflation plane of width between 600 m and 2000 m, and are migrating on top of dunes of older generations (Tsoar et al., 2009). Insights on the formative process and early development stages of dunes at Lençóis Maranhenses have been gained from recent field research (Gonçalves et al., 2003; Parteli et al., 2006). Sand deposited by tides on the beach is eroded by the wind thus forming small barchans with height between 50 cm and 1 m close to the beach (Parteli et al., 2006). As the barchans advance downwind, they become larger, link laterally and give place to barchanoidal chains that can reach heights of 30 m. The sand of the dunes is composed by quartz grains of mean diameter varying between m and m (IBAMA, 2003), which are values around the average diameter m previously reported for grains of sand dunes in other fields (Bagnold, 1941; Pye and Tsoar, 1990).
Wind regime at Lençóis is strongly unidirectional. The corresponding sand rose shows that the strongest winds, which can reach velocities over 8 m/s (Jiménez et al., 1999), blow mainly from the East (c.f. Fig. 3a). The vector length of each direction of the sand rose gives the potential rate of sand transport from that direction, or the drift potential (Tsoar, 2001),
| (1) |
where , is the wind velocity (in m/s) at a height of 10 m, m/s is the threshold wind velocity and is the fraction of time the wind was above (Tsoar, 2001). The resultant drift potential (RDP) is obtained by calculating the vector sum of the drift potential for each one of the directions of the sand rose. Wind directionality can be then quantified in terms of the ratio RDPDP, where DP is the sum of the magnitude of the drift potential for all directions. A value of close to unity or close to zero means unidirectional or multidirectional wind regime, respectively. At Lençóis, is approximately , which is consistent with the unidirectional wind regime of the area (Tsoar et al., 2009).
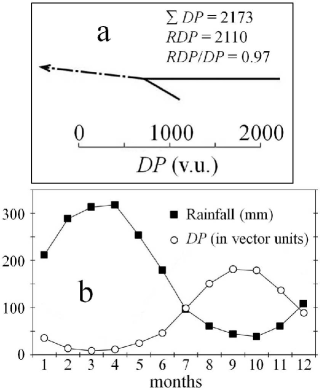
Wind power at Lençóis is negatively correlated with rainfall, as depicted in Fig. 3b. During the dry season from August to December there is almost no rainfall and month-averaged values of wind velocity are much higher than during the wet season. From January to July, when almost of the rainfall takes place (Jiménez et al., 1999), the interdune areas are inundated due to the high water table thus forming ponds (Fig. 2). The lagoons, placed amidst very clean sand, have no inlet or outlet and are exclusively filled by rain water. Their bottom is covered by a soft brown or green sheet of algae and cyanobacteria (Kadau et al., 2009). The interdune ponds cover of the area of Lençóis. The average interdune pond area is 7 ha, and most of the ponds are longer in the cross-wind direction than in the along-wind direction. Using the definition of Robinson and Friedman (2002), the ponds at Lençóis have a mean circularity — where the circularity of a sphere is one — of about (Levin et al., 2007). A large fraction of the interdune lakes formed in the rainy season disappear in the dry season. The landscape of Lençóis appears to change continuously, indeed dune mobility implies that the lakes often reappear in different places with different contours. The effect of the fluctuating water level on dune morphology at Lençóis is still poorly understood.
3 The model
The model used in the calculations of the present work consists of a set of mathematical equations that describe the average surface shear stress () over the topography, the mass flux () of saltating particles and the time evolution of the surface resulting from particle transport (Sauermann et al., 2001; Kroy et al., 2002; Durán and Herrmann, 2006b; Durán et al., 2010). Here, the model is extended in order to account for the water table. In the model the following steps are solved in an iterative manner.
(i) Given an initial topography, e.g. a terrain with dunes or smooth sand hills, the average shear stress field over the surface is calculated solving a set of analytical equations developed by Weng et al. (1991). The wind model computes, first, the Fourier-transformed components of the topographically induced perturbations in the average shear stress:
| (2) |
| (3) |
where and are the components parallel, respectively, perpendicular to the wind direction, is the wave vector, and and its coordinates in Fourier space; is the Fourier transform of the height profile, which is defined as the envelope comprising the sand landscape and the level of exposed water; is the normalized vertical velocity profile, is the inner layer depth of the flow and is the mean wavelength of the Fourier representation of the height profile; , and are modified Bessel functions, and is the aerodynamic roughness of the surface. The average shear stress is obtained, then, from the equation,
| (4) |
where is the undisturbed shear stress over the flat ground and .
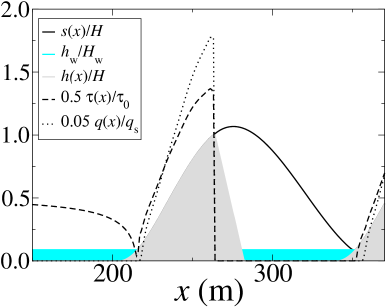
The wind model by Weng et al. (1991) is valid only for smooth surfaces, and thus the calculation of the wind flow over dunes must be adapted in order to account for flow separation at the dune brink (Kroy et al., 2002). For each longitudinal slice of the dune, a separation streamline, , is introduced at the dune lee, as depicted in Fig. 4. The wind model is solved, then, for the envelope,
| (5) |
comprising the dune surface, , the separation streamlines at the dune lee, , and the water table, . The streamlines of flow separation define the so-called separation bubble, inside which the wind shear is set as zero Kroy et al. (2002). The shape of is approximated by a third-order polynomial, the coefficients of which are calculated from the continuity of , and their respective first derivatives at the brink and at the reattachment point downwind, which is computed assuming that has a maximum slope (Kroy et al., 2002).
(ii) Next, the local sand flux over the landscape above the water level is calculated. The cloud of saltating grains is considered as a thin fluid-like layer moving over the surface. Once the wind speed exceeds the saltation threshold, the sand flux increases, first, exponentially due to multiplicative process inherent to the splash events at grain-bed collisions. However, the wind strength decreases as more grains enter saltation, since these have to be accelerated at cost of aeolian momentum (Nishimura and Hunt, 2000; Almeida et al., 2006). After a saturation distance, the wind is just strong enough to sustain transport and the sand flux is maximal. By using mass and momentum conservation, and by explicitly accounting for the flux saturation transients, the following equation is derived for the height-integrated mass flux of sand per unit time and length (Sauermann et al., 2001),
| (6) |
where is the saturated flux and the characteristic length of flux saturation, whereas is the wind shear velocity and kgm3 is the air density; , the impact threshold (Bagnold, 1941), is about the minimal threshold velocity ( ms) required to initiate saltation; ms2 is gravity, and the average grain velocity, , is computed by taking the steady-state wind velocity within the saltation layer (Sauermann et al., 2001; Durán and Herrmann, 2006b), whereas and are empirically determined parameters (Sauermann et al., 2001; Durán and Herrmann, 2006b).
(iii) The local height, , of the sand landscape evolves according to the equation
| (7) |
where kgm3 is the bulk density of the sand. If the local slope exceeds , the unstable surface relaxes through avalanches in the direction of the steepest descent. Avalanches are considered to be instantaneous since their time-scale is much smaller than the one of dune motion. The downslope flux of avalanches is calculated with the equation,
| (8) |
where and is the so-called “dynamic” angle of repose (Durán et al., 2010). The calculation of the flux due to avalanches followed by the update of the local height through solving Eq. (7) is performed iteratively until the local slope is below . The calculation of the avalanches applies to the whole sand topography, i.e. including the surface below the water level. The only difference between the transport under and above the water table concerns erosion due to the action of the wind. The surface below the water level is obviously protected from erosion and can only evolve in time due to avalanches following the deposition of sand incoming from dunes above the water level. At the interface with the exposed water, the sand flux vanishes and the incoming volume of sand is, then, instantaneously accreted to the local surface, at the first grid element where the sand surface is below the water level.
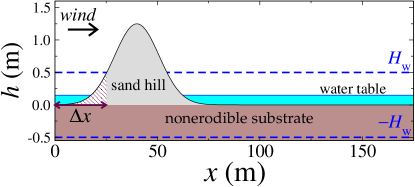
(iv) Thereafter, the level of exposed water, , is updated. It is assumed that the water table is roughly proportional to rainfall (Tsoar et al., 2009), as observed in real situations (Kocurek et al., 1992). The water table oscillates in time () with a period and maximum level according to the equation:
| (9) |
which is chosen here to represent the nearly sinusoidal behaviour of average rainfall, as monitored over several seasons, in areas of coastal dunes (Jiménez et al., 1999; Tsoar et al., 2009) (see Fig. 3b).
The calculations are performed using open and periodic boundaries in the directions longitudinal () and perpendicular () to the wind, respectively.
4 Simulations of coastal dune fields
The initial surface is a sand beach, which is modeled as a flat transverse sand hill of height m, width m and Gaussian longitudinal profile, as depicted in Fig. 5. The transverse profile of the hill has small, random fluctuations of amplitude of the order of the grain diameter, m (Luna et al., 2011). The sand hill is subjected to a wind of constant average shear velocity . We take values within the range ms, which is typical for sand-moving winds at Lençóis Maranhenses (Jiménez et al., 1999; Parteli et al., 2006; Tsoar et al., 2009).
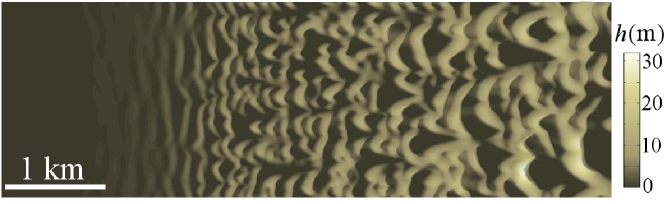
The calculation of a coastal dune field in the absence of water table has been studied in previous modeling (Durán et al., 2010; Luna et al., 2011). As shown from these works, the condition for the genesis of a coastal dune field is a saturated influx coming from the sea. In that case net deposition occurs at the windward foot of the sand surface. The hill does not evolve into a migrating dune (Katsuki et al., 2005), instead it remains fixed, increases in size and flattens (Durán et al., 2010). The flat sand surface resulting from the initial hill is unstable and develops undulations — the so-called “sand-wave instabilities” (Elbelrhiti et al., 2005) — which evolve into small transverse dunes of height between 50 cm and 1 m. Once the transverse dunes reach the bedrock, they become unstable and decay into barchans (Reffet et al., 2010; Parteli et al., 2011). Average dune size increases with distance as small barchans merge and collide with larger, more slowly migrating dunes downwind. In this manner, a sand hill subjected to a saturated flux becomes a source of sand for a field of barchans. Figure 6 shows a snapshot of the calculation of dune field genesis in the absence of water table (Durán et al., 2010; Luna et al., 2011).
The calculations including the water table are also performed using a saturated flux condition at the inlet, i.e. . Furthermore, the initial surface is adapted by including an upwind area of width protected from erosion, c.f. Fig. 5. This area represents a simple model for the backshore of an accreting beach (Dingler, 2005), i.e. the zone immediately adjacent to the sea cliff that lies above the high-water line. At the backshore there is less potential to remove sand thus favouring accumulation (Tsoar, 2000). In fact, if the water table rises above the sand upwind of the crest of the hill, as illustrated in Fig. 5, then, at a later time the sand surface is fully subdued by the water level as the hill flattens. In this case, input of sand ceases and no dune field forms. In order to avoid this problem and to make the model more realistic, we consider that the sand hill has a constant profile in the upwind backshore area, which has width m. Whereas in reality the sand surface close to the beach and water table may have profiles much more complex than in the model depicted in Fig. 5 (Kocurek et al., 2001), modeling of the detailed process leading to the accumulation of sand at the backshore and the formation of the sand beach is out of the scope of the present work. Indeed, using different profiles for the sand beach or different values of does not change the results presented in the next Section, provided there is a sufficient amount of sand above the water level that serves as an upwind source of sand for the dune field.
5 Results and discussion
Next, the genesis of dunes is studied by accounting for the presence of a water table that oscillates as described in Section 3. The seasonal rise and sink of the water table constrains dune dynamics. The evolution of the field depends on the quantities controlling the dynamics of the water table, namely the time period () and the amplitude () of the oscillation (c.f. Eq. (9)).
One relevant quantity for dune field morphology is the time cycle, , of the water table relative to the migration or turnover time, , of the barchan, i.e. the time needed for the barchan to cover a distance approximately equal to its own width (Allen, 1974). The turnover time of a barchan of height is given by the equation (Hersen et al., 2004; Durán et al., 2010),
| (10) |
where is the bulk sand flux associated with the wind shear velocity , and the proportionality constant, , is approximately equal to (Parteli et al., 2011). In the limit where is much larger than , dunes are completely leveled off during inundation since their migration velocity is much faster than the oscillation rate of the water table. Sand above water level is spread throughout the field forming extensive flat regions in the wet season whereas the wind has ample time to reshape the dunes again the dry season. Conversely, if , there is not sufficient time to build new dunes when the water level sinks below the surface. The amount of sand taken from the dunes during the wet season is small, thus leading to negligible accumulation in interdune areas. Transport between dunes in the dry season is correspondingly small, such that isolated dunes separated by large flat areas dominate the morphology of the field.
An interesting scenario occurs when becomes of the order of . In the wet season, the lowest portions of the dunes, i.e. the limbs, remain under water while the dune crest can migrate some distance downwind, thus leading to a decrease in dune height. Indeed, the amount of sand deposited at the interdune is large enough to construct small dunes in the dry season. Due to their fast relative migration velocity, the small bedforms emerging between the dunes collide with the larger dunes in their front, thus linking the barchans laterally and leading to the formation of barchanoidal chains. Therefore, the typical morphology observed at Lençóis, with chains of barchanoids alternating with interdune water ponds, arises when the size of dunes is such that their reconstitution time () is of the order of the time cycle of the water table (). Indeed, taking myear, which corresponds to ms, and year, the condition is fulfilled by dunes with heights of the order of m, which is consistent with the scale of dunes at Lençóis.
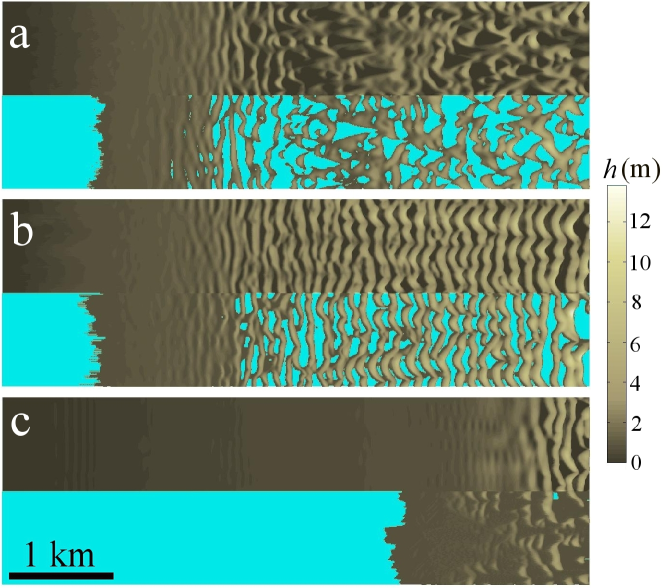
In Fig. 7 we present snapshots of calculations obtained with ms and different values of , namely 1 month (a), 1 year (b) and 10 years (c). Each one of Figs. 7a, 7b and 7c shows one snapshot taken at a time where the water level is maximum, i.e. (bottom), and another for the case (top), where has the nominal value 1 m. We see that the case which leads to a field of barchanoids is the one in Fig. 7b, i.e. when has the realistic value corresponding to a seasonal oscillation.
The morphology of the field also depends on the maximum height, , reached by the water. Figure 8 shows snapshots of simulations performed using the nominal value year and different values of : cm (a), 1 m (b) and 2 m (c).
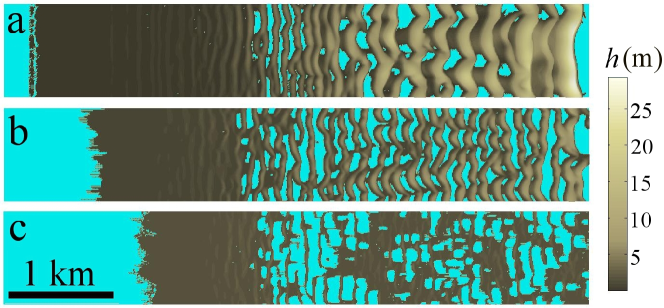
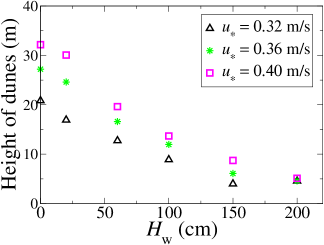
As can be seen from Fig. 8, the average size of dunes increases with distance at a slower rate as becomes larger. The average dune height at a distance of 5 km from the beach is about 28 m when cm, and 12 m for when m. For m, the dune height is roughly constant throughout the field and is about 4 m. Figure 9 shows the dune height at km as a function of for different values of the wind shear velocity, . We see that and play opposite roles for the height of dunes, i.e. while dunes become larger for increasing values of shear velocity, the water table reduces the spatial gradient of dune height in the direction of sand transport.
Dune height increases with distance more slowly in the presence of an oscillating water table due to cyclic phases of destruction and construction associated with the rise and sinking of the water level. When the water table rises above the ground, sand blown from the dunes accumulates into wet interdune areas, leading to flattening of the dunes. The sinking of the water table in the dry season exposes the sand deposited in the lowest areas, which serve, then, as internal source for dunes throughout the field. The maximum level, , reached by the water table within the wet season determines the net amount of sand blown from dunes into flatlands, and thus the evolution of dune height in the field.
Construction and destruction of dunes due to a fluctuating water table have been documented from field observations at the back-island dune fields on Padre Island, Texas (Kocurek et al., 1992). These fields constitute areas where the genesis and formative stages of dunes in the presence of a water table can be observed. Early portions of the fields on Padre Island are reduced to a nearly planar surface during the winter, when rainfall exceeds evaporation and the water table rises. Dunes are then reconstructed during the summer when groundwater is below the surface (Kocurek et al., 1992). As on Padre Island, the early landscape of the dune fields produced in the simulations consists of 50 cm high bedforms, which are nearly leveled in the wet season and then reform in the dry season. As also noted by Kocurek et al. (1992), dunes in the “mature” stage of the field far downwind from the beach have more chance of survival during wet seasons due to their larger size. Dune behaviour depends thus on the maximum water level relative to the equivalent sand thickness, , i.e. the thickness of sand if the barchan was leveled (Fryberger and Dean, 1979). Since the volume of a barchan is given by the equation , with (Durán et al., 2010), and since , we obtain,
| (11) |
which can be also written, using the linear relation between and the dune height, (Durán et al., 2010), as . Therefore, the smallest dunes of width m and height m are nearly leveled in the wet season when is around cm.
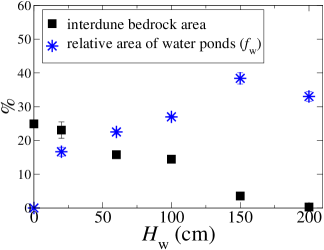
The effect of the oscillation amplitude of the water on the morphology of the field can be further elucidated through Fig. 10. This figure shows that the total interdune area during the dry season decreases with the amplitude of the water table oscillation. The larger the larger the amount of sand deposited in the interdune area and the smaller the relative area that is free of sand in the dry season. In contrast, the relative area of exposed water during maximum water level increases with , provided is not too large. Figure 10 suggests that, for intermediate values of smaller than m, the relative interdune area can serve as a proxy for the maximum water level relative to dune height at a given location of a dune field. When the value of increases beyond m, the fraction of dune surface above the water level becomes so small that erosion of dune crest leads to flat sand sheets of thickness comparable to the dune height. As shown in Fig. 8c, these interdune sand sheets can fill large areas of the lagoons between dunes, thus leading to a decrease in the value of as the water level becomes larger. Indeed, the average value of for m is slightly smaller than the one for m, as shown in Fig. 10. For such large values of , the morphology of the field deviates from the typical landscape of barchanoidal chains observed at Lençóis Maranhenses (c.f. Fig. 8). Therefore, in order to make a quantitative comparison of the simulation results with dunes at Lençóis, we take smaller values of , namely around 1 m.
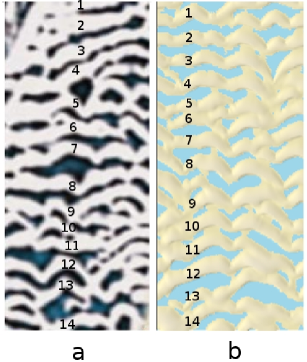
Figure 11a shows an image of barchanoidal dunes at Lençóis Maranhenses, which are located within area I in Fig. 1a, downwind of a recently investigated field of transverse dunes of heights between 7 m and 10 m (Parteli et al., 2006). In Fig. 11b, we show a snapshot of a calculation obtained with cm, while ms and year are taken in consistence with the conditions at Lençóis Maranhenses. We see that good quantitative agreement is found between dunes obtained in the simulations and real dunes. In both Figs. 11a and 11b we count 14 dune crests along the longitudinal cut indicated in the corresponding images. Furthermore, we calculate the total relative area of the terrain () which is covered by water, and find and for the dunes in the image and in the simulation, respectively.
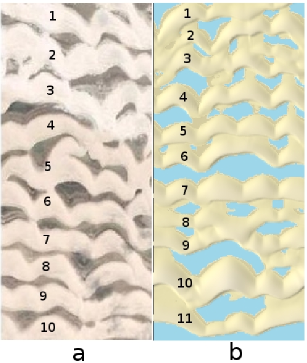
Further downwind in the field of Lençóis Maranhenses, in area II of Fig. 1a, dunes are larger and can reach heights of about m. In Fig. 12a, an image of barchanoids within area II is shown, whereas a snapshot of a simulation performed with m is displayed in Fig. 12b. Again, the calculation outcome is in good quantitative agreement with the image of the real dune field. The value of calculated for the real dunes is about , while for the dunes in the simulation we obtain .
Therefore, the relative surface area () that is covered by water in the wet season as obtained from our calculations is about , which is close but below the value of corresponding to the total area of Lençóis (Levin et al., 2007). However, it has to be emphasized that the value of estimated from our calculations corresponds only to interdune ponds between chains of barchanoids (c.f. Figs. 11 and 12). In reality, the area of Lençóis also hosts large permanent lagoons, indeed in some portions of the field the sand is distributed in an irregular manner leading to interdune flats of different sizes, which further contributes to the formation of well-separated barchans and a larger value of .
We have also considered an oscillating wind shear velocity that is negatively correlated with the water table, i.e. , with year, ms and ms (Jiménez et al., 1999; Tsoar et al., 2009). However, calculations using this model for wind velocity oscillating out of phase with the water table led to dune patterns similar to those obtained from simulations with a constant wind strength. Therefore, we conclude that the oscillation in the water table is the relevant factor controlling the morphology of dunes at Lençóis, rather than the seasonal modulation of the wind strength.
6 Conclusions
We extended the dune model introduced by Sauermann et al. (2001) to study dune formation in presence of a seasonally varying water table. The model was applied to investigate the genesis of dunes from a sand source in an environment where groundwater level oscillates in response to variations of rainfall and evapotranspiration rates. We found that the morphology of the field is dictated by the quantities controlling the dynamics of the water table, namely the time period () and the amplitude () of the oscillation. Chains of barchanoids, such as those at Lençóis Maranhenses dune field in northeastern Brazil, are obtained when is of the order of the dune turnover time, while determines the rate at which dune height increases in wind direction. We could reproduce barchanoidal dunes with the same size as those at Lençóis by using realistic values for (1 year) and (between 60 cm and 1 m) and an average wind shear velocity ms that is within the ranges observed at the real field. Furthermore, we found that the maximum water level affects the total relative interdune area in the dune field, . Our calculations yield an estimate for at Lençóis which is close to the value reported from measurements.
Several factors should be included in the future in order to improve the quantitative assessment of dunes at Lençóis Maranhenses. While the calculations of the present work considered a constant (saturated) sand influx, an improved calculation of the genesis and formation of Lençóis should consider a sand influx which may vary in time and also along the transverse profile of the beach. In some portions of the field, transport rates may change significantly due to the occurence of permanent lagoons or areas with quicksand (Kadau et al., 2009), leading to spatial changes in sand availability. Variations of local topography may also contribute to the changes in sediment budget, dune height and local morphology of the field. Moreover, the present model must be improved in the future in order to account for the capillary fringe of the water table, i.e. the wet layer of sand immediately above the water table. As a matter of fact, when the water table is below the sand surface, groundwater seeps up by capillary action to fill the pores, such that a subsurface layer (the capillary fringe) becomes saturated with water and thus protected from erosion. By enhancing moisture concentration and sediment cohesion, the capillary fringe may alter local rates of erosion and deposition throughout the field and thus influence the shape of dunes and interdune areas (Schenk and Fryberger, 1988; Grotzinger et al., 2005). Finally, it would be interesting to combine the present model for dune formation in presence of a water table with the model for sand transport with vegetation growth (Durán and Herrmann, 2006a; Durán et al., 2008; Luna et al., 2011) in order to investigate the combined effect of those natural agents on the genesis and evolution of coastal dune fields.
Acknowledgments
This work was supported in part by Brazilian agencies FUNCAP, CAPES, FINEP and CNPq, by the CNPq/FUNCAP Pronex Grant, by Swiss National Foundation Grant NF 20021-116050/1 and ETH Grant ETH-10 09-2.
References
- Allen (1974) Allen, J.R.L., 1974. Reaction, relaxation and lag in natural sedimentary systems: general principles, examples and lessonsEarth Science Reviews 10, 263-342.
- Almeida et al. (2006) Almeida, M.P., Andrade Jr., J.S., Herrmann, H.J., 2006. Aeolian transport layer. Physical Review Letters 96, 018001.
- Baas (2002) Baas, A.C.W., 2002. Chaos, fractals and self-organization in coastal geomorphology: Simulating dune landscapes in vegetated environments. Geomorphology 48, 309-328.
- Baas and Nield (2007) Baas, A.C.W., Nield, J.M., 2007. Modelling vegetated dune landscapes. Geophysical Research Letters 34, L06405.
- Bagnold (1941) Bagnold, R.A., 1941. Physics of blown sand and desert dunes. Methuen, London, 289 pp.
- Barbosa and Dominguez (2004) Barbosa, L.M., Dominguez, J.M.L., 2004. Coastal dune fields at the São Francisco River strandplain, northeastern Brazil: morphology and environmental controls. Earth Surface Processes and Landforms 29, 443-456.
- Bourke and Wray (2011) Bourke, M.C, Wray, J.J., 2011. Interdune Deposits Suggest High Groundwater in an Equatorial Crater on Mars. 42nd Lunar and Planetary Science Conference, abs. .
- Chen et al. (2004) Chen, J.S., Li, L., Wang, J.Y., Barry, D.A., Sheng, X.F., Gu, W.Z., Zhao, X., Chen, L., 2004. Groundwater maintains dune landscape. Nature 432, 459-460.
- Davidson-Arnott and Pyskir (1988) Davidson-Arnott, R.G.D, Pyskir, N.M., 1988. Morphology and formation of an holocene coastal dune field, Bruce Peninsula, Ontario. Géographie physique et Quaternaire 42, 163-170.
- de Castro Ochoa and Muñoz Reinoso (1997) de Castro Ochoa, F., Muñoz-Reinoso, J.C., 1997. Model of long-term water-table dynamics at Doñana National Park. Water Research 31, 2586-2596.
- Dingler (2005) Dingler, J.R., 2005. Beach processes. In: Encyclopedia of Coastal Science, Ed. Schwartz, M., pp. 161-168 (Springer, Dordrecht).
- Durán and Herrmann (2006a) Durán, O., Herrmann, H.J., 2006a. Vegetation against dune mobility. Physical Review Letters 97, 188001.
- Durán and Herrmann (2006b) Durán, O., Herrmann, H.J., 2006b. Modelling of saturated sand flux. Journal of Statistical Mechanics: Theory and Experiment, P07011.
- Durán et al. (2008) Durán, O., Silva, M.V.N., Bezerra, L.J.C., Herrmann H.J., Maia, L.P., 2008. Measurements and numerical simulations of the degree of activity and vegetation cover on parabolic dunes in north-eastern Brazil. Geomorphology 102, 460-471.
- Durán et al. (2010) Durán, O., Parteli, E.J.R., Herrmann H.J., 2010. A continuous model for sand dunes: Review, new developments and application to barchan dunes and barchan dune fields, 2010. Earth Surface Process and Landforms 35, 1591-1600.
- Elbelrhiti et al. (2005) Elbelrhiti, H., Claudin, P., Andreotti, B., 2005. Field evidence for surface-wave-induced instability of sand dunes. Nature, 437, 720-723.
- Enzel et al. (1999) Enzel, Y., Ely, L.L., Mishra, S., Ramesh, R., Amit, R., Lazar, B., Rajaguru, S.N., Baker, V.R., Sandler, A., 1999. High-Resolution Holocene Environmental Changes in the Thar Desert, Northwestern India. Science 284, 125-128.
- Floriani et al. (2004) Floriani, D.C., Fukuda, J.C., Pinto, E.F., 2004. Lençóis Maranhenses National Park: The Largest Coastal Dunes Area in South America. Gerenciamento Costeiro Integrado 2, 62-64.
- Fryberger and Dean (1979) Fryberger, S.G., Dean, G., 1979. A Study of Global Sand Seas. U.S. Geol. Surv. Prof. Pap. 1052, Ed. McKee, E.D., pp. 137-169 (U.S. Geol. Surv., Reston, VA).
- Gonçalves et al. (2003) Gonçalves, R.A., Lehugeur, L.G.O., Castro, J.W.A., Pedroto, A.E.S., 2003. Classificação das Feições Eólicas dos Lençóis Maranhenses - Maranhão - Brasil. Mercartor - Revista de Geografia da UFC 03, 99-112 (in portuguese).
- Grotzinger et al. (2005) Grotzinger, J.P., Arvidson, R.E., Bell III, J.F., Calvin, W., Clark, B.C., Fike, D.A., Golombek, M., Greeley, R., Haldemann, A., Herkenhoff, K.E., Jolliff, B.L., Knoll, A.H., Malin, M., McLennan, S.M., Parker, T., Soderblom, L., Sohl-Dickstein, J.N., Squyres, S.W., Tosca, N.J., Watters, W.A., 2005. Stratigraphy and sedimentology of a dry to wet eolian depositional system, Burns formation, Meridiani Planum, Mars. Earth and Planetary Science Letters 240, 11-72.
- Herrmann et al. (2008) Herrmann, H.J., Durán, O., Parteli, E.J.R., Schatz, V., 2008. Vegetation and induration as sand dunes stabilizers. Journal of Coastal Research 24, 1357-1368.
- Hersen et al. (2004) Hersen, P., Andersen, K.H., Elbelrhiti, H., Andreotti, B., Claudin, P., Douady, S., 2004. Corridors of barchan dunes: Stability and size selection. Physical Review E 69, 011304.
- Hesp (2002) Hesp, P., 2002. Foredunes and blowouts: initiation, geomorphology and dynamics. Geomorphology 48, 245-268.
- IBAMA (2003) IBAMA, 2003. Instituto Brasileiro do Meio Ambiente e dos Recursos Naturais Renováveis, Plano de Manejo do Parque Nacional dos Lençóis Maranhenses (in Portuguese).
- Jiménez et al. (1999) Jimenez, J.A., Maia, L.P., Serra, J., Morais, J., 1999. Aeolian dune migration along the Ceara coast, North-eastern Brazil. Sedimentology 46, 689-701.
- Kadau et al. (2009) Kadau, D., Herrmann, H.J., Andrade Jr., J.S., Araújo, A.D., Bezerra, L.J., Maia, L.P., 2009. Living quicksand. Granular Matter 11, 67-71.
- Katsuki et al. (2005) Katsuki, A., Kikuchi, M., Endo, N., 2005. Emergence of a Barchn Belt in a Unidirectional Flow: Experiment and Numerical Simulation. Journal of the Physical Society of Japan 74, 878-881.
- Kocurek et al. (1992) Kocurek, G., Townsley, M., Yeh, E., Havholm, K., Sweet, M.L., 1992. Dune and dune-field development on Padre Island, Texas, with implications for interdune deposition and water-table-controlled accumulation. Journal of Sedimentary Petrology 62, 622-635.
- Kocurek et al. (2001) Kocurek G., Robinson, N.I., Sharp, J.M. 2001. The response of the water table in coastal aeolian systems to changes in sea level. Sedimentary Geology 139, 1-13.
- Kocurek et al. (2007) Kocurek, G., Carr M., Ewing R., Havholm K.G., Nagar Y.C., Singhvi A.K., 2007. White Sands Dune Field, New Mexico: Age, dune dynamics and recent accumulations. Sedimentary Geology 197, 313-331.
- Kroy et al. (2002) Kroy, K., Sauermann, G., Herrmann, H.J., 2002. Minimal model for aeolian sand dunes. Physical Review E 66, 031302.
- Levin et al. (2007) Levin, N., Tsoar, H., Maia, L.P., Claudino-Sales, V., Herrmann, H.J., 2007. Dune whitening and inter-dune freshwater ponds in NE Brazil. Catena 70, 1-15.
- Levin et al. (2009) Levin, N., Tsoar, H., Herrmann, H.J., Maia, L.P., Claudino-Sales, V., 2009. Modelling the formation of residual dune ridges behind barchan dunes in North-east Brazil. Sedimentology 56, 1623-1641.
- Luna et al. (2011) Luna, M.C.M.M., Parteli, E.J.R., Durán, O., Herrmann, H.J., 2011. Model for the genesis of coastal dune fields with vegetation. Geomorphology 129, 215-224.
- Mountney and Thompson (2002) Mountney, N.P., Thompson, D.B., 2002. Stratigraphic evolution and preservation of aeolian dune and damp/wet interdune strata: an example from the Triassic Helsby Sandstone Formation, Cheshire Basin, UK. Sedimentology 49, 805-833.
- Mountney and Russell (2009) Mountney, N.P., Russell, A.J., 2009. Aeolian dune-field development in a water table-controlled system: Skeidarársandur, Southern Iceland. Sedimentology 56, 2107-2131.
- Nield and Baas (2008a) Nield, J.M., Baas, A.C.W., 2008a. The influence of different environmental and climatic conditions on vegetated aeolian dune landscape development and response. Global and Planetary Change 64, 76-92.
- Nield and Baas (2008b) Nield, J.M., Baas, A.C.W., 2008b. Investigating parabolic and nebkha dune formation using a cellular automaton modelling approach. Earth Surface Processes and Landforms 33, 724-740.
- Nishimori and Tanaka (2001) Nishimori, H., Tanaka, H., 2001. A simple model for the formation of vegetated dunes. Earth Surface Processes and Landforms 26, 1143-1150.
- Nishimura and Hunt (2000) Nishimura, K., Hunt, J.C.R., 2000. Saltation and incipient suspension above a flat particle bed below a turbulent boundary layer. Journal of Fluid Mechanics 417, 77-102.
- Parteli et al. (2006) Parteli, E.J.R., Schwämmle, V., Herrmann, H.J., Monteiro, L.H.U., Maia, L.P., 2006. Profile measurement and simulation of a transverse dune field in the Lencois Maranhenses. Geomorphology 81, 29-42.
- Parteli and Herrmann (2007) Parteli, E.J.R. and Herrmann, H.J., 2007. Saltation transport on Mars. Physical Review Letters 98, 198001.
- Parteli et al. (2009) Parteli, E.J.R., Durán, O., Tsoar, H., Schwämmle, V., Herrmann, H.J., 2009. Dune formation under bimodal winds. Proceedings of the National Academy of Sciences 106, 22085-22089.
- Parteli et al. (2011) Parteli, E.J.R., Andrade Jr., J.S., Herrmann, H.J., 2011. Transverse instability of dunes. Submitted for publication.
- Pye and Tsoar (1990) Pye, K., Tsoar, H., 1990. Aeolian sand and sand dunes. Unwin Hyman, London.
- Reffet et al. (2010) Reffet, E., Courrech du Pont, S., Hersen, P., Douady, S., 2010. Formation and stability of transverse and longitudinal sand dunes. Geology 38, 491-494.
- Robinson and Friedman (2002) Robinson, D.A., Friedman, S.P., 2002. Observations of the effects of particle shape and particle size distribution on avalanching of granular media. Physica A 311, 97-110.
- Rubin and Hesp (2009) Rubin, D.M., Hesp, P.A., 2009. Multiple origins of linear dunes on Earth and Titan. Nature Geoscience 2, 653-658.
- Ruz and Meur-Ferec (2004) Ruz, M.H., Meur-Ferec, C., 2004. Influence of high water levels on aeolian sand transport: upper beach/dune evolution on a macrotidal coast, Wissant Bay, northern France. Geomorphology 60, 73-87.
- Sauermann et al. (2001) Sauermann, G., Kroy, K., Herrmann, H.J., 2001. A continuum saltation model for sand dunes. Physical Review E 64, 031305.
- Sauermann et al. (2003) Sauermann, G., Andrade Jr., J.S., Maia, L.P., Costa, U.M.S., Araújo, A.D., Herrmann, H.J., 2003. Wind velocity and sand transport on a barchan dune. Geomorphology 54, 245-255.
- Schatz et al. (2006) Schatz, V., Tsoar, H., Edgett, K.S., Parteli, E.J.R., Herrmann, H.J., 2006. Evidence for indurated sand dunes in the Martian north polar region. Journal of Geophysical Research 111, E04006.
- Schenk and Fryberger (1988) Schenk, C.J., Fryberger, S.G., 1988. Early diagenesis of eolian dune and interdune sands at White Sands, New Mexico. Sedimentary Geology 55, 109-120.
- Tsoar (2000) Tsoar, H., 2000. The geomorphological background and paleogeography of the sand dunes that have formed the kurkar ridges in the coastal plain of Israel. Israel Journal of Earth Sciences 49, 189-196.
- Tsoar (2001) Tsoar, H., 2001. Types of Aeolian Sand Dunes and Their Formation. Geomorphological Fluid Mechanics 582, 403-429.
- Tsoar and Blumberg (2002) Tsoar, H., Blumberg, D.G., 2002. Formation of Parabolic Dunes from Barchan and Transverse Dunes along Israel’s Mediterranean Coast. Earth Surface Processes and Landforms 27, 1147-1161.
- Tsoar et al. (2009) Tsoar, H., Levin, N., Porat, N., Maia, L.P., Herrmann, H.J., Tatumi, S.H., Claudino-Sales, V., 2009. The effect of climate change on the mobility and stability of coastal sand dunes in Ceará State (NE Brazil). Quaternary Research 71, 217-226.
- Wasson and Hyde (1983) Wasson, R.J., Hyde, R., 1983. Factors determining desert dune type. Nature 304, 337-339.
- Weng et al. (1991) Weng, W.S., Hunt, J.C.R., Carruthers, D.J., Warren, A., Wiggs, G.F.S., Livingstone, I., Castro, I., 1991. Air flow and sand transport over sanddunes. Acta Mechanica, Suppl. 2, 1-22.
- Yizhaq et al. (2007) Yizhaq, H., Ashkenazy, Y., Tsoar, H., 2007. Why do active and stabilized dunes coexist under the same climatic conditions? Physical Review Letters 98, 188001.