Observational constraints on the physics behind the evolution of AGN since
Abstract
We explore the evolution with redshift of the rest-frame colours and space densities of AGN hosts (relative to normal galaxies) to shed light on the dominant mechanism that triggers accretion onto supermassive black holes as a function of cosmic time. Data from serendipitous wide-area XMM surveys of the SDSS footprint (XMM/SDSS, Needles in the Haystack survey) are combined with Chandra deep observations in the AEGIS, GOODS-North and GOODS-South to compile uniformly selected samples of moderate luminosity X-ray AGN () at redshifts 0.1, 0.3 and 0.8. It is found that the fraction of AGN hosted by red versus blue galaxies does not change with redshift. Also, the X-ray luminosity density associated with either red or blue AGN hosts remains nearly constant since . X-ray AGN represent a roughly fixed fraction of the space density of galaxies of given optical luminosity at all redshifts probed by our samples. In contrast the fraction of X-ray AGN among galaxies of a given stellar mass decreases with decreasing redshift. These findings suggest that the same process or combination of processes for fueling supermassive black holes are in operation in the last 5 Gyrs of cosmic time. The data are consistent with a picture in which the drop of the accretion power during that period (1 dex since ) is related to the decline of the space density of available AGN hosts, as a result of the evolution of the specific star-formation rate of the overall galaxy population. Scenarios which attribute the evolution of moderate luminosity AGN since to changes in the suppermassive black hole accretion mode are not favored by our results.
keywords:
galaxies: active – galaxies: Seyferts – X-rays: diffuse background1 Introduction
Understanding how galaxies assemble their stellar mass and how the supermassive black holes (SMBH) at their centres grow remain major challenges in current astrophysical research. Recent observational evidence indicates that the two processes are intimately related (e.g. Ferrarese & Merritt, 2000; Gebhardt et al., 2000) and therefore should be studied in conjunction: SMBHs affect the evolution of their hosts and vice versa. Indeed, many modern semi-analytic models (SAMs) of galaxy formation include prescriptions for the growth of SMBHs (e.g. Wang et al., 2007; Monaco et al., 2007; Somerville et al., 2008). In most of those simulations it is assumed that SMBHs, when active, regulate the formation of new stars through some form of as yet poorly understood feedback process, thereby affecting the evolutionary path of their hosts. Without the energy input from Active Galactic Nuclei (AGN), many SAMs fail to reproduce fundamental properties of galaxies, such as their colour bimodality (e.g. Cattaneo et al., 2007, 2009) and luminosity function (e.g. Benson et al., 2003; Fontanot et al., 2007b). As a result of the development of AGN/galaxy co-evolution models it is now possible to have a physical description of the accretion history of the Universe, which observationally, shows a broad plateau at followed by a rapid decline by almost 1 dex to the present day (e.g. Aird et al., 2010).
The mechanisms adopted by SAMs to trigger AGN activity include major gaseous mergers (e.g. Di Matteo et al., 2005; Cen, 2011), stochastic accretion of cold gas via disk instabilities or minor interactions (Hopkins & Hernquist, 2006) and quiescent inflows of hot gas from the galaxy halo (Croton et al., 2006). Hydrodynamic simulations also propose that the secular evolution of galaxies provides a large enough reservoir of gas through stellar winds, which could give episodic AGN activity and substantial black hole growth (e.g. Ciotti & Ostriker, 1997, 2007). To our knowledge this process has not as yet been implemented in SAMs. The different SMBH fueling modes above operate by design under different conditions and therefore make specific predictions for the properties of the galaxies that host AGN, including their star-formation rate, morphology and environment. This offers an observational tool to test different SMBH growth models.
The evidence above has motivated efforts to study AGN hosts using data from large multiwavelength programs, such as the AEGIS (All-wavelength Extended Groth Strip International Survey; Davis et al., 2007), the COSMOS (Cosmic Evolution Survey; Scoville et al., 2007), the GOODS (Great Observatories Origins Survey) and the XBOOTES (Kenter et al., 2005). These programs use primarily X-rays to locate AGN and multiwavelength observations to study their hosts. As a result observational constraints to different AGN fueling models have become available in the last few years, although the results are often contradictory and the interpretation may vary among groups. Morphological studies for example, have identified a large fraction of disks ( per cent) among X-ray selected AGN at , suggesting that major mergers cannot be the dominant mode of SMBH growth at that epoch (Pierce et al., 2007; Gabor et al., 2009; Georgakakis et al., 2009; Cisternas et al., 2011). X-ray AGN at are typically found in small and moderate size groups (Georgakakis et al., 2008; Silverman et al., 2009b) with dark matter halo masses (Coil et al., 2009; Hickox et al., 2009). This environment is proposed to be the most conducive to merger events (Hopkins et al., 2008, but see Allevato et al. 2011). Galaxy interactions, particularly those which include at least one early-type (red) system, are indeed observed to be more common in group environments at (Lin et al., 2010). The star-formation rate of X-ray AGN, although still not well constrained, is suggested to depend on their accretion luminosity (e.g. Lutz et al., 2010; Shao et al., 2010). Below the break of the X-ray luminosity function it is claimed that the star-formation is decoupled to AGN activity, consistent with the stochastic accretion mode scenario. Above the knee of the X-ray luminosity function it is argued that the accretion luminosity scales with the star-formation rate, in agreement with the major-merger formation picture.
The observational studies above essentially probe active SMBHs close to the peak of the accretion power of the Universe, , and lack the volume to provide meaningful constraints on the AGN population at low redshift . This is an important gap in AGN evolution studies, as there are suggestions that the dominant mode of SMBH accretion changes with redshift, thereby leading to the observed rapid decline of the accretion power at (Hopkins & Hernquist, 2006; Hasinger, 2008; Lutz et al., 2010). Fanidakis et al. (2010) for example, propose two main channels of SMBH growth, disk instabilities, which dominate at high redshift and bright AGN luminosities, and hot gas accretion, which becomes important at low redshift and faint luminosities. In the models above shifts between different fueling modes with cosmic time should imprint detectable changes in the properties of AGN hosts from to and beyond.
The Sloan Digital Sky Survey (SDSS; Abazajian et al., 2009) has identified the largest sample of low redshift () AGN todate, using diagnostic emission line ratios (Kauffmann et al., 2004). The selection function of that sample however, is very different from that of X-ray AGN in deep surveys, rendering the comparison difficult. Recent work has demonstrated that there is only partial overlap between AGN samples selected using diagnostic emission lines and X-rays (e.g. Yan et al., 2011; Juneau et al., 2011). This might be due to obscuration effects, which are likely to be more severe at X-rays, dilution of the AGN optical emission lines by stellar continuum or nebular emission lines from HII regions, intrinsic scatter in the X-ray to optical luminosity ratio of AGN or the controversial nature of sources such as LINERs. This class of objects are often included in AGN samples selected by diagnostic emission line ratios, although their emission lines may not be dominated by accretion onto a SMBH (e.g. Sarzi et al., 2010). The study of AGN hosts as a function of time would benefit from a homogeneous selection of active SMBHs at all redshifts.
A step in this direction is the extended Chandra Multiwavelength Project (ChaMP, Green et al., 2009), which detects serendipitous X-ray sources on archival Chandra images. That survey covers an area of and therefore probes a large enough volume to detect in a systematic way X-ray AGN at low redshift (Haggard et al., 2010). More recently Georgakakis & Nandra (2011) combined archival XMM observations with the SDSS (XMM/SDSS survey) to compile a sample of X-ray selected AGN at low redshift, , over an area of , much larger than the extended ChaMP. The advantage of serendipitous X-ray surveys like the XMM/SDSS and the ChaMP is that the AGN selection function at low redshift is almost identical to that of X-ray AGN at and beyond in deep surveys, thereby facilitating the comparison by minimising differential selection effects. Georgakakis & Nandra (2011) demonstrated the power of this approach. By comparing X-ray AGN in the XMM/SDSS at with those in the AEGIS at they found little evolution of the fraction of AGN in red/blue hosts. They argued that this is evidence against a change of the dominant SMBH fueling mechanism with redshift.
In this paper we expand on the Georgakakis & Nandra (2011) results and provide new estimates of the volume density evolution of X-ray AGN in red and blue hosts by combining three different X-ray surveys with median redshifts , 0.3 and 0.8. We also determine how the fraction of X-ray AGN in the overall galaxy population changes with redshift. These results are discussed in the context of semi-analytic models for the growth of SMBHs and the evolution of the AGN population. Throughout this paper we adopt , and . Rest frame quantities (e.g. absolute magnitudes, luminosities, stellar masses) are parametrised by .
2 X-ray AGN samples
Three different datasets are used to explore the evolution from to of the space density of AGN in blue and red cloud hosts. The XMM/SDSS serendipitous X-ray survey (Georgakakis & Nandra, 2011) is used to select AGN at . The Needles in the Haystack Survey (NHS; Georgantopoulos 2005) is employed to study X-ray AGN at a median redshift of . At , the AEGIS (Davis et al., 2007), the GOODS-North and the GOODS-South fields are combined to explore the properties of the X-ray AGN population. The number of X-ray AGN with in each of the above three samples is presented in Table 1.
2.1 The XMM/SDSS survey
The XMM/SDSS is a serendipitous XMM survey of the SDSS area and is designed to study the properties of X-ray AGN at . Details on the reduction of the XMM observations, the detection of sources, the estimation of fluxes and hardness ratios, the determination of the survey sensitivity and the identification of X-ray sources with optical counterparts are described in Georgakakis & Nandra (2011).
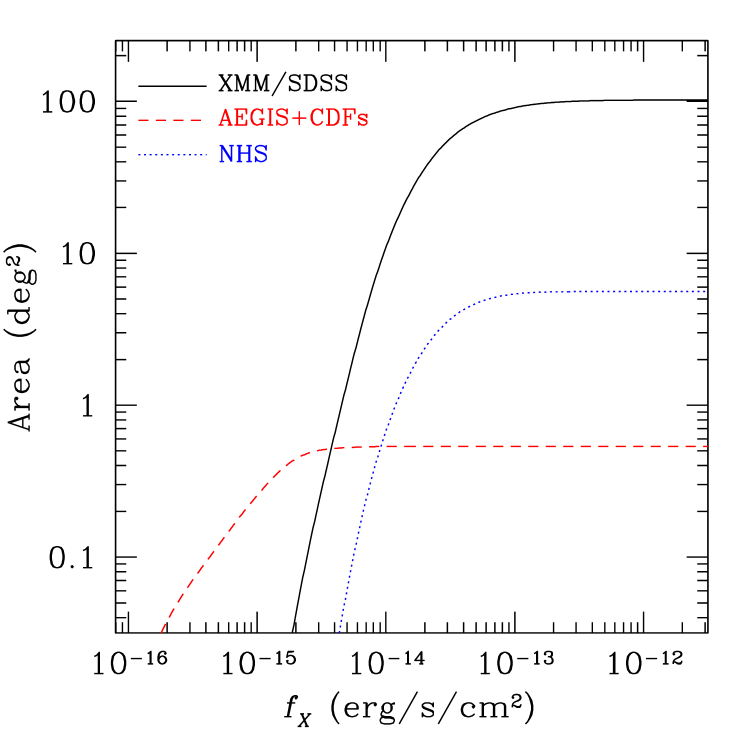
The XMM/SDSS survey includes pointings which have clusters of galaxies as their prime targets. The overdensity of sources in those fields may bias estimates of the fraction of red/blue AGN hosts or the fraction of AGN relative to galaxies. We therefore exclude from the analysis XMM/SDSS survey fields that have clusters as their prime targets. These observations are identified from the target name keyword of the event files. This reduces the XMM/SDSS survey area to 102 . Sources detected in the 2-8 keV band are used. This energy interval is less affected by obscuration biases compared to softer energies, while the XMM’s sensitivity remains high, thereby resulting in a sample that is sufficiently large for statistical studies. The hard band sensitivity curve is plotted in Figure 1.
The low redshift X-ray subsample of the XMM/SDSS survey consists of 235 hard-band (2-8 keV) detections with and mag after correcting for Galactic extinction (Schlegel et al., 1998). The magnitude cut corresponds to the limit of the SDSS Main Galaxy Sample ( mag, Strauss et al., 2002), which provides the vast majority of redshifts in the SDSS. The photometry is from the New York University Value-Added Galaxy Catalog (NYU-VAGC, Blanton et al., 2005) which uses data from the SDSS DR7 (Abazajian et al., 2009). The NYU-VAGC provides better photometric calibration of the SDSS data (Padmanabhan et al., 2008) compared to the DR7 and an accurate description of the SDSS window function.
XMM prime targets are included in the XMM/SDSS source catalogue. They are identified by comparing the positions of the detected sources with either the NED coordinates corresponding to the target name keyword of the XMM observations or the right ascension and declination of the nominal pointing of the XMM observations. A total of 42 sources are identified as prime targets in the subsample with and mag and are excluded from the analysis. We retain however, X-ray sources which lie at similar redshifts as the prime target of a particular X-ray observation.
X-ray fluxes are estimated in the standard 2-10 keV spectral band by extrapolating from the observed count rate in the 2-8 keV energy interval (see Georgakakis & Nandra 2011 for details). The XMM/SDSS survey detects sources with luminosities as low as (see section 4 for the estimation of X-ray luminosity). In contrast, the higher redshift samples (see next sections) are sensitive to . To make fair the comparison of AGN at different redshifts we apply a luminosity cut of and exclude sources fainter that this limit. The final XMM/SDSS sample used in this paper consists of 175 serendipitous sources with , mag and (median redshift ).
2.2 The Needles in the Haystack Survey
The original NHS is a serendipitous XMM survey which was initiated to select and study normal galaxies, i.e. non-AGN, at X-ray wavelengths (Georgantopoulos et al., 2005). That survey consisted of high Galactic latitude () XMM observations that became public in June 2004 and overlapped with the second data release of the SDSS. The original NHS is now superseded by the XMM/SDSS survey (Georgakakis & Nandra, 2011). However, extensive optical spectroscopy has been obtained for X-ray sources in a subset of the original NHS fields (see below). Therefore, we retain that survey in its original format but reanalyse the XMM observations using the pipeline developed for the reduction of the XMM/SDSS survey fields (Georgakakis & Nandra, 2011). As a result the source detection, flux estimation, astrometric corrections, optical identification of the X-ray sources and sensitivity map construction in the updated NHS follow the methodology described in Georgakakis & Nandra (2011).
For the subset of the original NHS fields with declination deg follow-up spectroscopy was carried out at the ESO VLT and NTT telescopes111Based on observations made with ESO Telescopes at the La Silla and Paranal Observatories under programme IDs 078.B-0623A and 080.B-0409A. The total area of that subsample, which hereafter will be referred to as NHS, is . All X-ray sources with extended optical light profiles (i.e. optically resolved) in the SDSS and mag have been observed spectroscopically. Because the density of the targets on the sky is low, each source was observed separately with a longslit. The observations were carried out between October 2006 and March 2008 in queue mode with the FORS2 (FOcal Reducer and low dispersion Spectrograph) on the VLT (Very Large Telescope) and the EMMI (ESO’s Multimode Instrument) at the NTT (New Technology Telescope). The data were reduced using standard routines in IRAF. Redshifts were determined for 129 out of 151 targeted sources by visual inspection of the reduced spectra. The redshift measurements correspond to at least two secure spectral features. Figure 2 presents the redshift distribution of the sample and demonstrates that at the magnitude limit mag the majority of the sources lie at .
In the updated NHS catalogue there are 126 hard-band (2-8 keV) detected sources with mag and extended optical light profiles. Redshift estimates are available for 100 of them (including one Galactic star). The redshift incompleteness is because of (i) featureless spectra, (ii) failure to observe some of the targets and (iii) mismatches between the updated NHS source catalogue and the original one (Georgantopoulos et al. 2005) used to construct the target list for follow-up spectroscopy. The sample used in this paper consists of 73 hard X-ray sources with , mag. The median redshift is . The sensitivity curve of the NHS in the hard band is plotted in Figure 1.
Optically unresolved X-ray sources are underrepresented in the NHS spectroscopic sample as they have not been targeted by our ESO observations. The majority of those sources however, are expected to lie at redshift . Out of the 124 unresolved X-ray sources with mag, a total of 28 have redshift available from the SDSS. Of them only one lies in the redshift interval . We therefore expect that the exclusion of optically unresolved X-ray sources is not going to have a strong effect on the results and conclusions. This issue is further discussed in the results section.

2.3 The deep X-ray surveys
AGN at are selected from the Chandra surveys of the AEGIS, GOODS-North (2 Ms Chandra Deep Field North) and GOODS-South (2 Ms Chandra Deep Field South). The Chandra observations in the those fields have been reduced and analysed in a homogeneous way using the methodology described by Laird et al. (2009). The optical counterparts of the X-ray sources have been identified using the Likelihood Ratio method as described in Georgakakis et al. (2009). For the AEGIS field we use the ground based optical photometry obtained as part of the DEEP2 spectroscopic survey (Coil et al., 2004). For the GOODS North and South fields the optical identification of the X-ray sources uses the Hubble Space Telescope (HST) Advanced Camera for Surveys (ACS) imaging observations of those fields (see Georgakakis et al., 2009, for details).
The spectroscopy for X-ray sources in the AEGIS is from a variety of sources: the DEEP2 redshift survey (Davis et al., 2003), follow-up observations of X-ray sources at the MMT using the Hectospec fiber spectrograph (Coil et al., 2009), the SDSS and a number of spectroscopic programs that targeted galaxies in the original Groth Strip (Weiner et al., 2005). Optical spectroscopy in the GOODS-North is available from either programmes that specifically targeted the X-ray population in these fields (e.g. Barger et al., 2003, 2005; Cowie et al., 2003) or the Keck Treasury Redshift Survey (TKRS; Wirth et al., 2004). There are many spectroscopic campaigns in the CDF-South. These include follow-up observations targeting specific populations, such as X-ray sources (Szokoly et al., 2004), -band selected galaxies (Mignoli et al., 2005), and high redshift candidates (e.g. Dickinson et al., 2004; Stanway et al., 2004a, b), as well as generic spectroscopic surveys of faint galaxies in the GOODS area using the FORS2 (Vanzella et al., 2005, 2008) and VIMOS (Le Fèvre et al., 2004; Popesso et al., 2008, 2009; Balestra et al., 2010) spectrographs at the VLT.
We select X-ray sources detected in the 0.5-7 keV band with optical magnitudes mag for the AEGIS and mag (F775W HST/ACS band) for the GOODS-North and South fields. At this magnitude cut the spectroscopic identification rate of the AEGIS, GOODS-North and GOODS-South X-ray sources is 67 (375/557), 85 (118/139) and 87 (105/121) per cent, respectively. From the spectroscopically identified sources we select those with redshifts in the interval . This results in 149 sources in the AEGIS, 66 in the GOODS-North and 54 in the GOODS-South. The median redshift of the sample is 0.8. The choice of the X-ray band for the detection of sources is to ensure that our sample is selected at similar rest-frame energies (1-14 keV) as the (2-9 keV) and samples (3-10 keV). Differential selection effects are therefore small, thereby facilitating the comparison of the AGN properties among the three samples. The combined X-ray sensitivity curve for the 3 fields is shown in Figure 1.
3 Galaxy Samples
In the next sections the space density of X-ray AGN will be compared with that of the overall galaxy population. We therefore compile three spectroscopic galaxy samples at , and , which probe similar redshift intervals as the low redshift subset of the XMM/SDSS survey, the NHS and the AEGIS+GOODS X-ray AGN samples respectively. The number of galaxies in each sample is listed in Table 1.
At , we select a total of 9541 NYU-VAGC sources with mag that overlap with the XMM/SDSS survey fields (after excluding galaxy cluster pointings) and have spectroscopic redshifts in the interval .
The data release 3 of the DEEP2 spectroscopic survey in the AEGIS field is used to select galaxies at . This spectroscopic program uses the DEIMOS spectrograph (Faber et al., 2003) on the 10 m Keck-II telescope to obtain redshifts for galaxies to mag. The observational setup uses a moderately high resolution grating (), which provides a velocity accuracy of and a wavelength coverage of 6500–9100 Å. This spectral window allows the identification of the strong [O II] doublet 3727Å emission line to . We use DEEP2 galaxies with redshift determinations secure at the confidence level (quality flag ; Davis et al. 2007). A total of 6797 galaxies with redshifts are selected to determine the space density of the galaxy population at a median redshift of and to compare against that of X-ray AGN.
Although the AEGIS DEEP2 spectroscopic survey is geared toward high redshift sources, it also includes a large number of galaxies at (4601). We select a total of 1960 galaxies in the interval to estimate their luminosity function at and compare it with that of X-ray AGN identified in the NHS.
| X-ray AGN | |||||
| sample | redshift | number | red | blue | AGN |
| hosts | hosts | dominated | |||
| XMM/SDSS | 0.03-0.2 | 175 | 76 | 68 | 31 |
| NHS | 0.1-0.5 | 73 | 24 | 27 | 22 |
| AEGIS/GOODS | 0.6-1.2 | 269 | 124 | 111 | 34 |
| AEGIS/GOODS (stellar mass) | 0.6-1.2 | 217 | 98 | 97 | 22 |
| Galaxies | |||||
| sample | redshift | number | red | blue | – |
| hosts | hosts | ||||
| XMM/SDSS | 0.03-0.2 | 8643 | 5304 | 3339 | – |
| AEGIS-NHS | 0.2-0.4 | 1960 | 291 | 1669 | – |
| AEGIS | 0.6-1.2 | 6797 | 1383 | 5414 | – |
| AEGIS (stellar mass) | 0.6-1.2 | 3436 | 648 | 2788 | – |
-
The columns are: (1): X-ray AGN or galaxy sample; (2): redshift range of the sources in each sample; (3) total number of sources in the sample; (4) number of red cloud sources ; (5) number of blue cloud sources; (6) AGN with broad lines and/or and dominant nuclear point source in the optical.
4 Rest-frame properties
This section describes how the rest-frame colour, stellar mass, X-ray luminosity and intrinsic column density of galaxies and X-ray AGN are determined.
The kcorrect version 4.2 routines developed by Blanton & Roweis (2007) are used to fit spectral models to the optical photometry of X-ray sources and galaxies and then estimate rest-frame colours and absolute magnitudes in the AB system. For the sake of uniformity, in all three samples used in this paper we estimate rest-frame magnitudes in the , bands, which are the SDSS , filters shifted to . The advantage of this choice of bandpasses is twofold. They are close to observed frame for our XMM/SDSS sample and also have effective wavelengths that are similar to the rest-frame effective wavelengths of the DEEP2 and filters at (Blanton, 2006).
For galaxies selected in the SDSS and X-ray AGN in either the XMM/SDSS or the NHS the kcorrect routines are applied to the observed SDSS photometry. The rest-frame and -band magnitudes are estimated from the apparent magnitudes of the source in the and band filters respectively. In the AEGIS field the kcorrect routines are used to fit models to the photometry obtained as part of the DEEP2 survey (Coil et al., 2004) and then estimate the rest-frame and -band magnitudes from the observed DEEP2 and -band data respectively. For the GOODS-North and South fields the HST/ACS photometry in the (F435W), (F606W), (F775W) and (F850LP) bandpasses is used as input to kcorrect. The rest-frame magnitudes in the and bands are determined from the F435W and F775W apparent magnitudes respectively. The vs colour-magnitude diagrams of AGN and galaxies at z=0.1 and z=0.8 have been presented by Georgakakis & Nandra (2011). In that study a colour cut of was employed to separate blue from red cloud galaxies. This value is also used here to define AGN subsamples associated with red/blue hosts.
For the estimation of stellar mass, , we adopt the relation between -band mass–to–light ratio and rest-frame colour of Zibetti et al. (2009). We choose to use the mass–to–light ratio coefficients estimated for the Jonhson-Cousin filterset (see Table B1 of Zibetti et al. 2009) instead of the SDSS bands. It was found that the latter set of coefficients, when applied to the AEGIS/DEEP2 galaxy sample, produced too many massive galaxies at compared to the mass function of Borch et al. (2006, see results section). The DEEP2 photometric bands are better suited for the estimation of the rest-frame colour of galaxies at , for which Zibetti et al. (2009) do not provide mass–to–light ratio coefficients. Therefore for the estimation of stellar masses for AEGIS galaxies and AGN we use the photometry obtained as part of the deep synoptic Canada-France-Hawaii Telescope Legacy Survey (CFHTLS) to determine their colours and -band luminosities. We use the CFHTLS data from the T0003 release222http://terapix.iap.fr/article.php?idarticle=556., which reaches a limiting magnitude of . The overlap between the CFHTLS photometry and the DEEP2 spectroscopic survey is . The total number of spectroscopically identified galaxies and X-ray AGN in the overlap region are listed in Table 1. The adopted approach for determining stellar masses is not as accurate as fitting galaxy templates to the observed spectral energy distribution. Nevertheless, as it will be shown in the next sections, it provides stellar mass estimates which are adequate for our purposes. Also, the results and conclusions are not sensitive to systematics (i.e. choise of initial mass function) which affect absolute stellar mass estimates. This is because the stellar mass distribution of AGN hosts is studied relative to that of galaxies (see Results section). The calculation of the colour and -band absolute magnitudes of galaxies and X-ray AGN is carried out using the kcorrect routines.
The intrinsic column density, , of individual X-ray AGN is determined from the hardness ratios between the soft (0.5-2 keV) and the hard (2-7 keV for AEGIS, GOODS, 2-8 keV for XMM/SDSS, NHS) X-ray bands assuming an intrinsic power-law X-ray spectrum with index (e.g. Nandra & Pounds, 1994). The derived column densities are then used to convert the X-ray flux in either the 2-10 keV (XMM/SDSS, NHS) or the 0.5-10 keV (AEGIS, GOODS) bands to unabsorbed X-ray luminosity in the rest-frame 2-10 keV energy interval.
The NHS and AEGIS/GOODS X-ray samples used in this paper are not sensitive to sources fainter than . To avoid luminosity dependent biases in the comparison of the properties X-ray AGN host galaxies at different redshifts we choose to use in the analysis only sources with . This criterion excludes 18 XMM/SDSS sources. In many studies a brighter luminosity cut is adopted, , to avoid potential contamination of AGN samples by normal galaxies. As discussed by Georgakakis & Nandra (2011), although normal galaxy candidates are present at faint X-ray luminosities, AGN remain the dominant population. We provide an estimate of the level of contamination by normal galaxies by calculating the fraction of X-ray sources with X-ray–to–optical flux ratio and soft X-ray spectra, . These two criteria are often adopted in the literature for selecting normal galaxies in X-ray surveys (e.g Hornschemeier et al., 2003; Georgakakis et al., 2006). The fraction of X-ray sources fulfilling the above criteria are 3 per cent (5/175) in the XMM/SDSS and 1 per cent (3/269) for the combined AEGIS and CDF fields. There are no sources with in the NHS. Contamination by non-AGN is therefore not expected to affect our results and conclusions.
5 Estimation of the space density of AGN and galaxies
The space density of X-ray AGN and galaxies in bins of stellar mass, (mass-function; MF), absolute magnitude (optical luminosity function; OLF) and 2-10 keV luminosity (X-ray luminosity function; XLF) is derived using the standard non-parametric method (Schmidt, 1968). In this calculation we take into account the X-ray selection function (in the case of the AGN), the optical magnitude limit of different samples and the spectroscopic incompleteness. The MF, OLF and XLF in logarithmic bins are estimated by the relation
| (1) |
where Y equals for the MF, in the case of the OLF and in the XLF calculation. In the equation above is the weight applied to each spectroscopically identified source to correct for the spectroscopic incompleteness of the different samples (see below). is the maximum comoving volume for which the source satisfies the sample selection criteria, i.e. redshift range, apparent optical magnitude limit and, in the case of X-ray sources, X-ray flux limit. For X-ray AGN the depends on X-ray luminosity (), absolute optical magnitude (), redshift () as well as the overall shape of the optical and X-ray Spectral Energy Distributions (SED)
| (2) |
where is the volume element per redshift interval . The integration limits are and , where we have defined , the lower and upper redshift limits of the sample and is the redshift at which the source will become fainter than the survey optical magnitude limit. is the solid angle of the X-ray survey available to a source with luminosity and column density at a redshift (corresponding to a flux in the X-ray area curve). For galaxies the is a function of , and optical SED only and hence equation 2 simplifies to
| (3) |
where the symbols are the same as in equation 2 and is the survey solid angle. The uncertainty at a given luminosity or mass bin is
| (4) |
Sample variance is not included in the error budget. This is because we are mainly interested in the space density of AGN relative to galaxies selected in the same field. The effects of sample variance are therefore minimised in this differential approach. This is not the case for the sample, for which the X-ray AGN and galaxies are selected from different fields. Nevertheless, the next section shows that the AGN XLFs and the galaxy MFs/OLFs determined from the samples presented in this paper at median redshifts z=0.1, 0.3 and 0.8, are in good agreement with previous estimates. This further suggests that sample variance effects are small.
The conversion of the absolute to apparent optical magnitude in the 1/Vmax calculation uses the optical k-corrections determined by the kcorrect version 4.2 routines (Blanton & Roweis, 2007). The model that best fits the optical photometric data of a source is also used to estimate k-corrections for the same source at different redshifts. In the case of the XLF, the intrinsic of individual X-ray sources is taken into account in the 1/Vmax estimation. The X-ray k-corrections are calculated by adopting an absorbed power-law spectral energy distribution with and photoelectric absorption cross sections as described by Morrison & McCammon (1983) for solar metallicity.
For SDSS galaxies and AGN in the XMM/SDSS survey, the weight in equation 1, which corrects for spectroscopic incompleteness, is the fraction of the SDSS Main Galaxy sample spectroscopic targets that have reliable redshifts in a given sector (fgotmain parameter in NYU-VAGC). For the NHS, AEGIS and GOODS X-ray sources the weight is estimated following the methodology of Lin et al. (1999) and Willmer et al. (2006). For each X-ray source targeted for spectroscopy the number of X-ray sources with (i) reliable redshifts in a given redshift interval, , (ii) successful redshift determinations outside that interval, or , (iii) failed redshifts and (iv) unavailable spectroscopic observations, are counted within spheres defined in the three dimensional colour-colour-magnitude space. When estimating the probability, , that a spectroscopically unidentified source lies within the redshift interval it is assumed that unsuccessful redshifts lie outside the redshift range of interest, or (“minimal” model of Willmer et al., 2006). The weight for each spectroscopic source is the sum of the probabilities of all sources within the colour-colour-magnitude sphere. For the redshift limits (, ) we adopt the values (0.1, 0.5) for NHS, (0.2, 1.4) for AEGIS and (0.6, 1.2) for GOODS, respectively. The data spheres are defined by the , colours and the -band magnitude in the NHS, the , colours and the -band magnitude in the AEGIS and the , and -band magnitude in the GOODS. When estimating the OLF of the overall galaxy population using data from the AEGIS DEEP2 spectroscopic survey we include in the weights an additional correction which accounts for the probability that a galaxy will be placed on a DEEP2 mask (see Willmer et al., 2006).
6 Results
This section presents the XLF, OLF and MF of X-ray AGN, both for the full XMM/SDSS, NHS, AEGIS+CDFs samples and for subsamples split by the rest-frame colour of the host galaxy. In this exercise we identify and exclude from the analysis sources with either broad emission lines in their optical spectra and/or a prominent nuclear point source in their optical images (SDSS or HST/ACS survey of the AEGIS/GOODS). The optical continua of those sources are contaminated by AGN light. This introduces biases in the determination of the host galaxy absolute optical magnitude and stellar mass. Also, the colours of those sources do not provide information on the dominant stellar population of their hosts. We note however, that AGN dominated sources are included in the determination of both the total XLF (i.e. not split by colour) and the total X-ray luminosity density.
6.1 The X-ray luminosity function
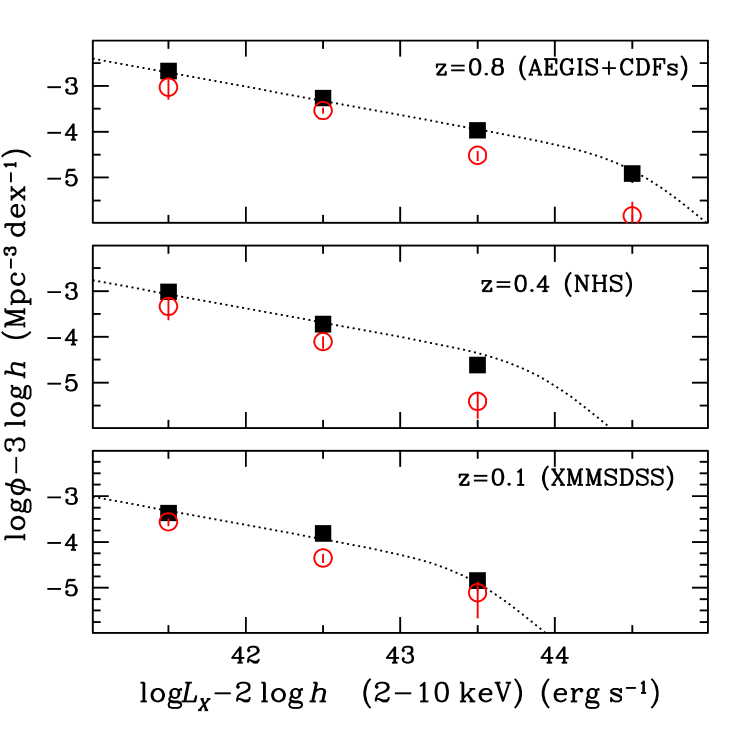
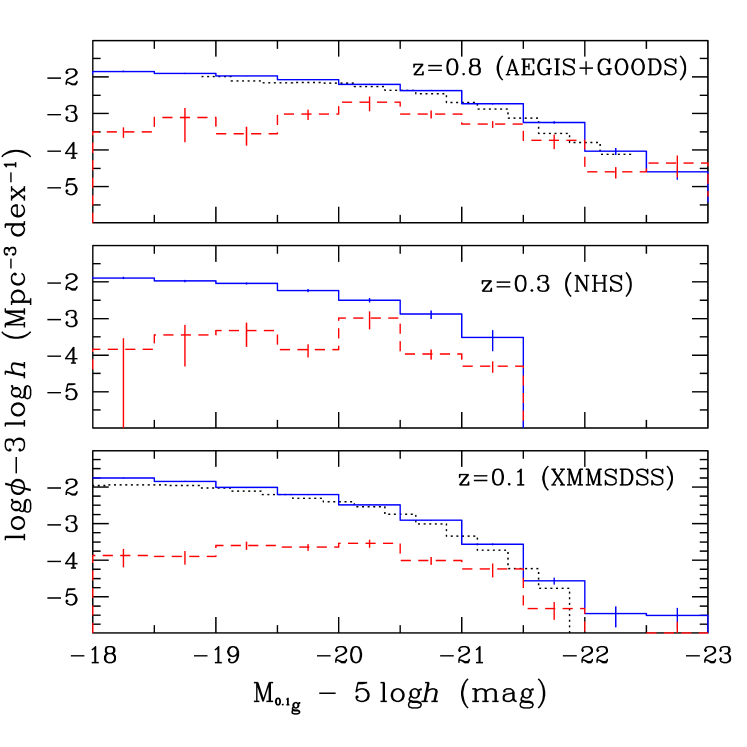
Figure 3 and Table 2 present the 2-10 keV XLFs of the XMM/SDSS, NHS and AEGIS+GOODS surveys at median redshifts of 0.1, 0.3 and 0.8 respectively. At all three redshifts, the estimated XLFs are in good agreement with the Luminosity And Density Evolution (LADE) model of Aird et al. (2010), which is also plotted in the figure. Although our X-ray samples are apparent magnitude limited, this selection effect is correctly accounted for in the 1/Vmax calculation. For the NHS in particular, the exclusion of optically unresolved X-ray sources, for which optical spectra have not been obtained as part of our ESO follow-up programs (section 2), does not appear to introduce incompleteness in XLF estimation. This is consistent with our finding that optically unresolved sources are dominated by AGN outside the redshift range 0.1-0.5 probed by the NHS.
Next we split the three samples by rest-frame colour to explore changes with redshift of the space density of X-ray AGN in red/blue hosts and get insights into the dominant accretion mode onto SMBHs at different epochs. AGN dominated sources are excluded from the analysis. The total numbers of red cloud [], blue cloud [] and AGN-dominated sources in each sample are listed in Table 1. The XLFs of red cloud AGN are shown in Figure 3 and are listed in Table 2. The ratio of the integrated XLF of AGN in red hosts over the total integrated XLF is plotted in Figure 4. It demonstrates that within the errors there is no strong evidence for evolution of the red host AGN fraction since . Similar results are obtained for the AGN in blue hosts.
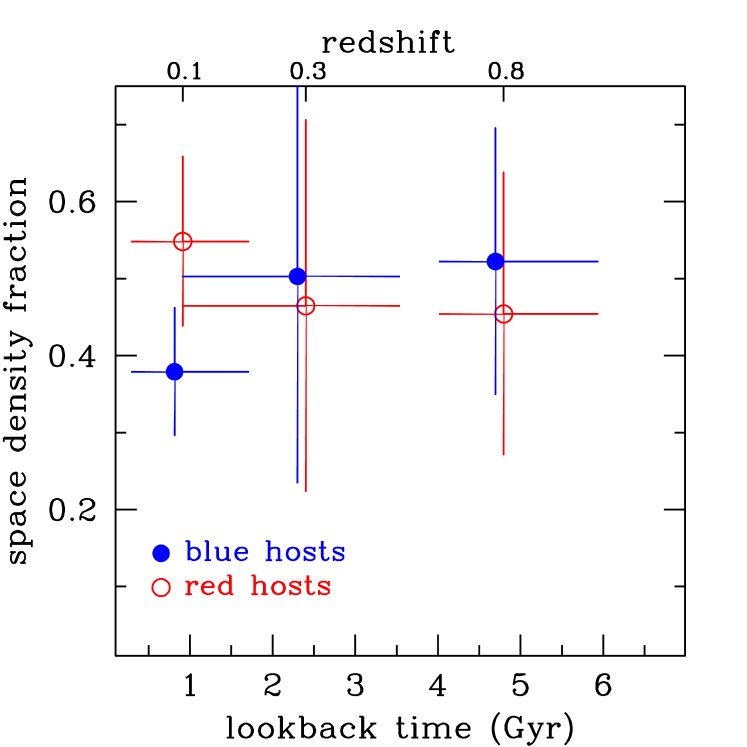
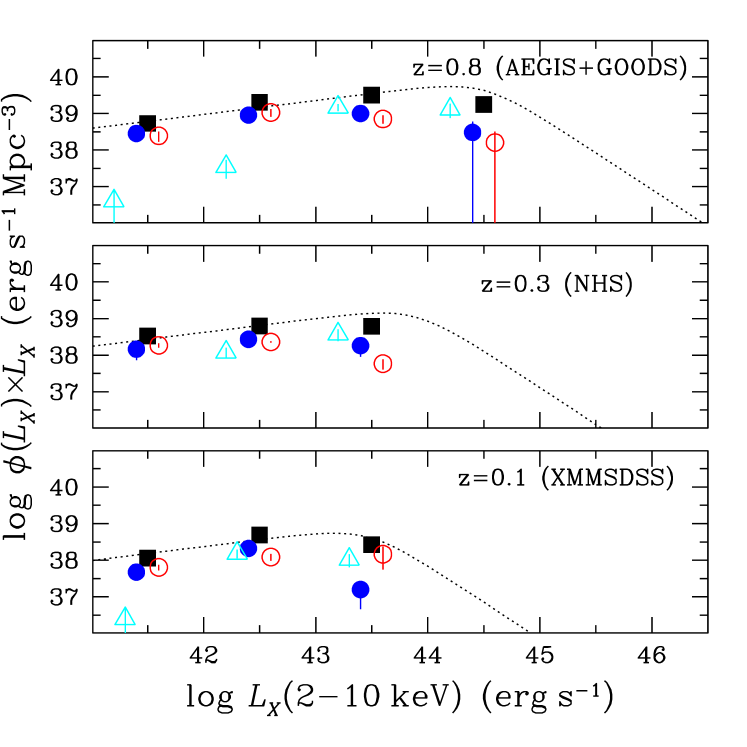
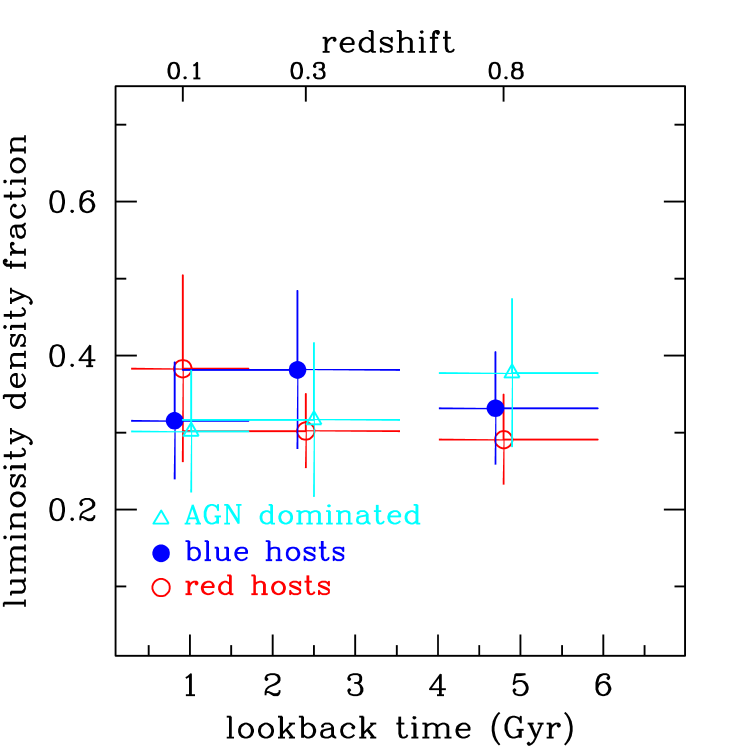
More relevant in the study of the dominant AGN accretion mode as a function of redshift is the fraction of the accretion power of the Universe that is associated with red/blue hosts at different epochs. Figure 5 plots the hard band X-ray luminosity density as a function of luminosity for the three samples used in this paper. At each redshift bin we sum up separately the luminosity density of AGN in red/blue hosts and X-ray sources with colours dominated by the central engine and divide with the total luminosity density. The results are plotted as a function of lookback time and redshift in Figure 6. Within the uncertainties there is little change with redshift of the relative fraction of the accretion power in red/blue AGN hosts from to . This statement is quantified by fitting a straight line to the luminosity density fraction versus redshift datapoints of Figure 6. For the slope of the line we find best fit values and 68 per cent confidence level errors () of (blue AGN hosts) and (red AGN hosts). Based on the uncertainty in the slope of the linear fit we then estimate that at the 68 per cent confidence level the luminosity density associated with blue AGN hosts cannot increase or decrease more than a factor of about 1.4 between and . For AGN in red hosts we find that their luminosity density cannot increase or decrease more than factors of 1.6 and 1.2 respectively, from to (68 per cent confidence level). We also caution that the points for red/blue AGN hosts in Figure 6 are lower limits as the typical host galaxy colours of broad-line QSOs are still not well constrained.
6.2 The optical luminosity functions of AGN and galaxies
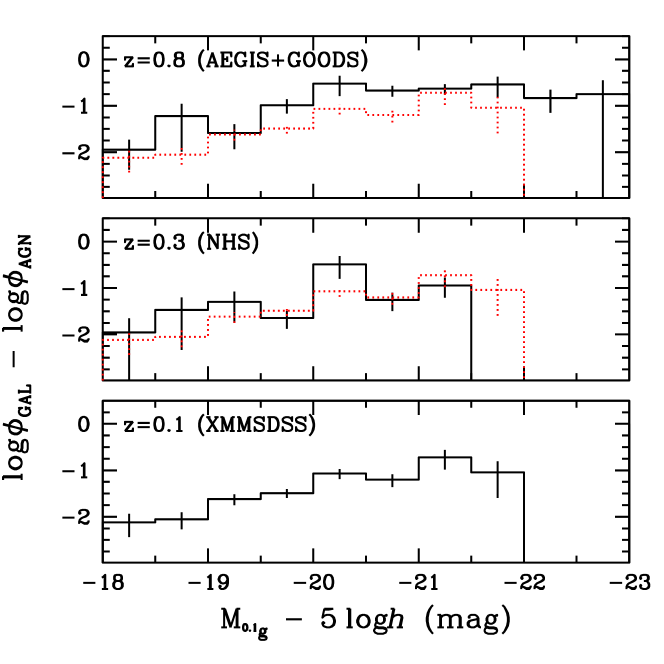
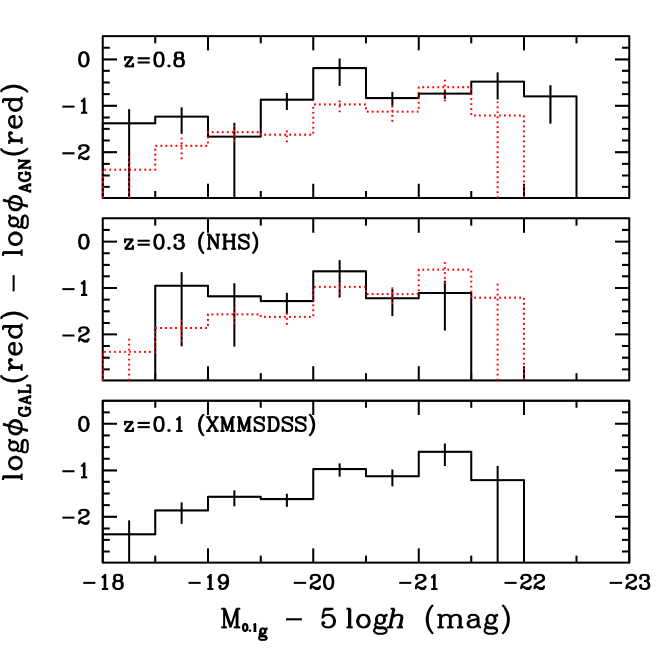
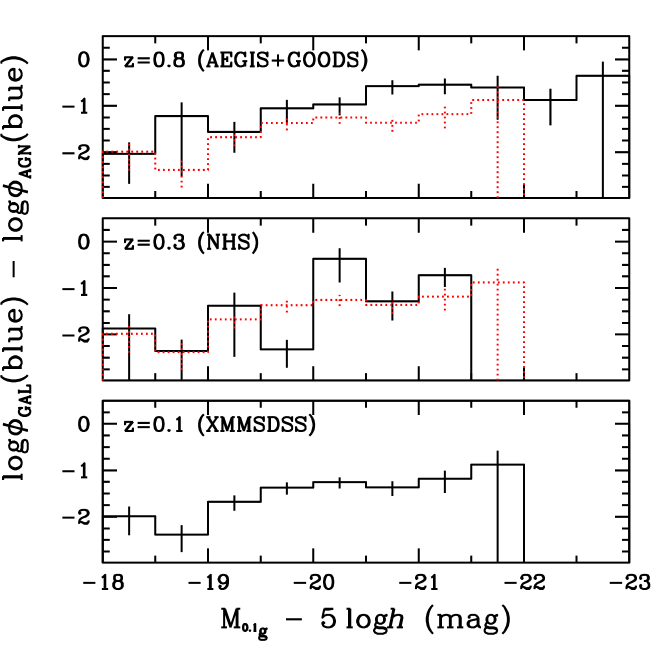
We also explore changes with redshift of the fraction of X-ray AGN relative to the overall galaxy population. For that we estimate the optical luminosity function of galaxies and X-ray AGN in absolute magnitude bins. X-ray AGN with optical continua dominated by the central engine are excluded from the OLF calculation as their may not be dominated by stellar light. Including those sources in the analysis however, would not change the main conclusions. The results are presented in Figure 7 and Table 3. For comparison, also plotted in that figure are the galaxy OLFs estimated in bins at and by Blanton (2006) using SDSS-DR4 data and the first data release of the DEEP2 spectroscopic survey respectively. Our galaxy OLFs are in good agreement with that study. Figure 8 plots the ratio of the X-ray AGN OLF over that of the overall galaxy population. Within the errors the fraction of X-ray AGN remains roughly constant with redshift in the absolute magnitude range shown in the figure. This result holds if we split the galaxy and AGN samples by rest-frame colour. The test is employed to explore in a quantitative way differences between and in the distribution of the fraction of AGN. The statistic is
| (5) |
where and is the fraction of AGN in the optical luminosity bin at redshifts and respectively, and is the combined error which accounts for the uncertainty in both and . For the total X-ray sample we estimate (8 degrees of freedom) which corresponds to a probability that the two distributions are different. For the red and blue AGN subsamples the corresponding probabilities are (, 8 d.o.f.) and respectively (, 8 d.o.f.). We therefore find only marginal evidence, significant at best at the 95 per cent confidence level ( for a normal distribution), for a change with redshift of the X-ray AGN fraction in a given optical luminosity bin. This is surprising given that the space density of X-ray AGN drops by almost 1 dex since .
6.3 The stellar mass functions of AGN and galaxies
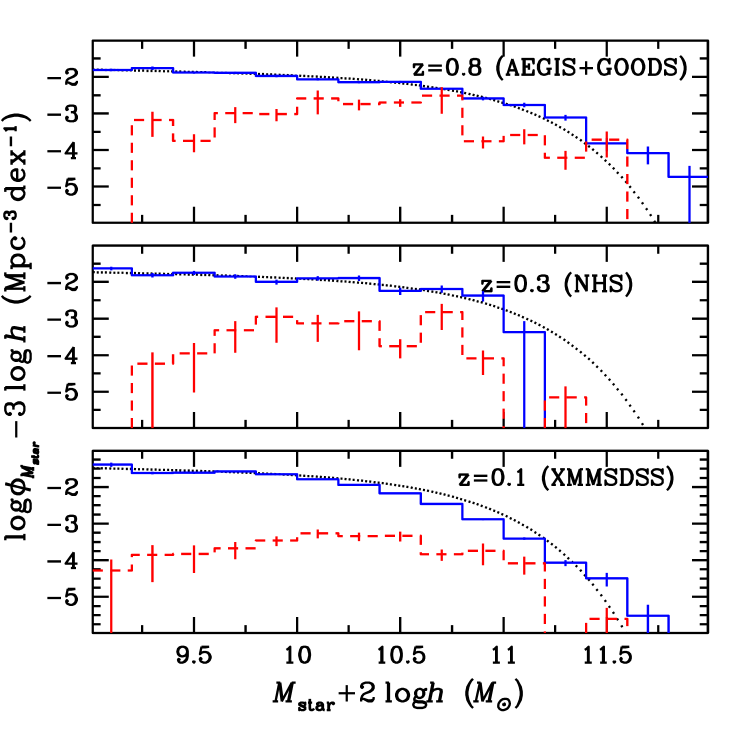
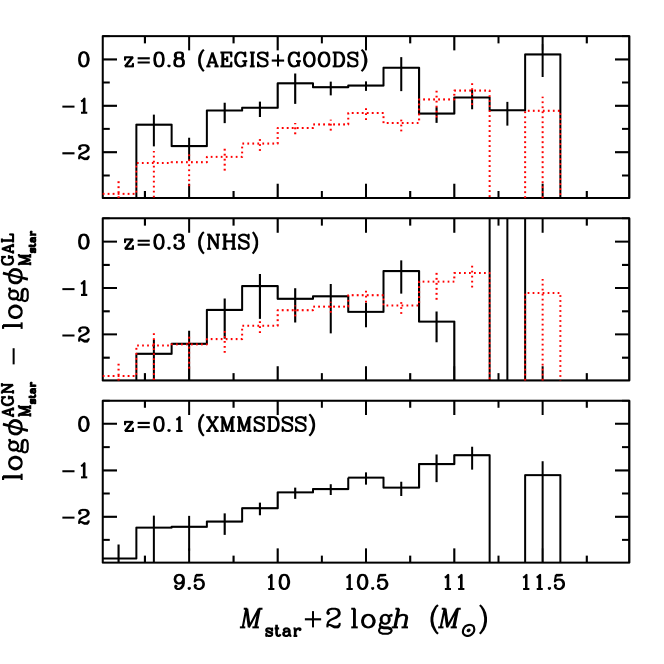
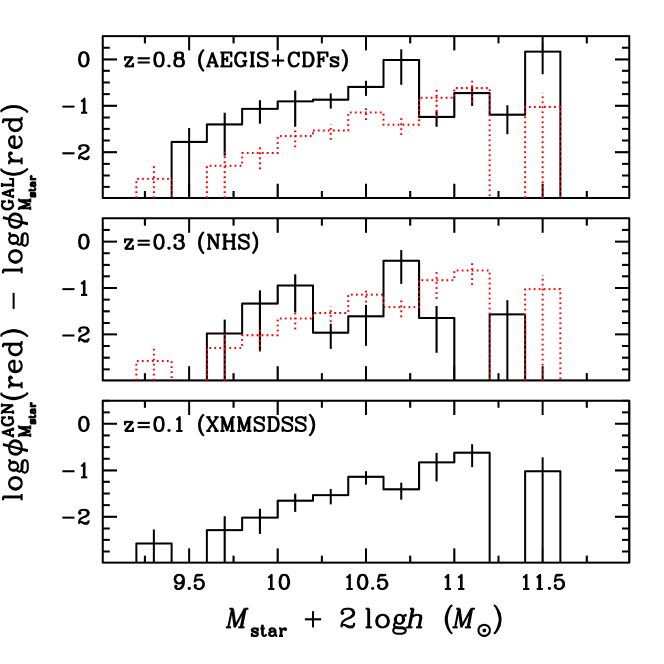
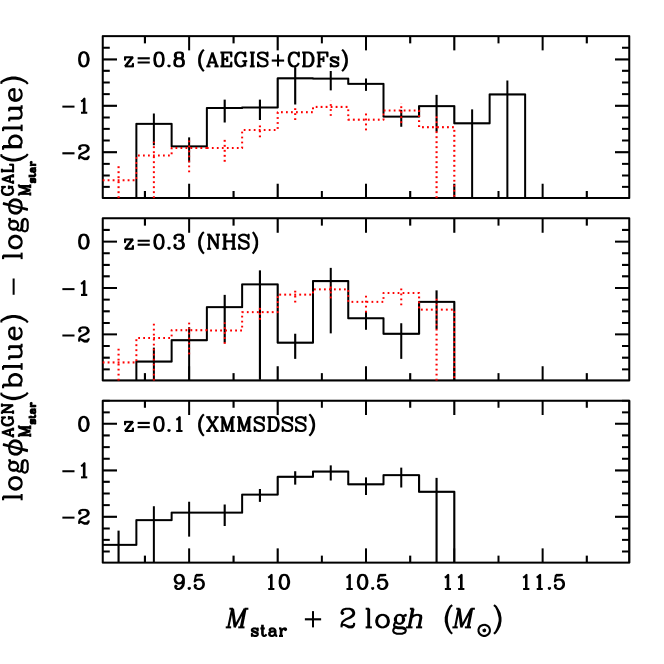
The conclusions are different if the fraction of galaxies that host X-ray AGN is plotted against stellar mass. In this case there is evidence for evolution in the sense that at higher redshifts a larger fraction of galaxies host X-ray AGN at a given stellar mass bin. Figure 9 and Table 4 present the mass functions of galaxies and X-ray AGN at redshifts , 0.3 and 0.8. X-ray AGN with optical continua dominated by the central engine (i.e. broad emission lines and/or a prominent nuclear point source in their optical image) are excluded from the MF estimation. Figure 9 also shows the galaxy MFs of Borch et al. (2006) at similar redshifts. There is fair agreement with our MF estimates suggesting that our simple approach for calculating stellar masses is adequate for statistical studies. The agreement with the results of Borch et al. (2006) is also good if the MF is split into red and blue galaxies. Figure 10 plots the ratio of X-ray AGN MF over that of galaxies. In all three samples the fraction of galaxies that host AGN increases with stellar mass. The steepest rise is for the low redshift sample whereas in both the NHS and the AEGIS+CDFs samples the fraction of X-ray AGN appears to flatten above about . Also, the fraction of galaxies that host X-ray AGN drops with decreasing redshift from to . Using the statistical test to compare the with AGN fraction distribution we find (9 d.o.f) and a probability per cent ( in the case of a normal distribution) that the two distributions are different. This is the result of the building up of the mass function of galaxies with time and the overall decline of the space density of X-ray AGN to low redshift. At stellar masses , although the statistics are poor, there is tentative evidence that the fraction of X-ray AGN is not a strong function of redshift. This is likely related to the fact that the mass function above this mass limit evolves little with redshift since (Borch et al., 2006; Pérez-González et al., 2008). Figure 10 also presents the fraction of X-ray AGN in red/blue hosts. The overall trends are similar to the full galaxy and AGN populations. Using the test the probabilities that the X-ray AGN fraction as a function of stellar mass changes from to are (, 9 d.o.f.) for the red AGN subsample and (, 9 d.o.f.) for the blue AGN subset.
7 Discussion
A slew of AGN fueling modes are proposed in the literature including hot gas accretion (Croton et al. 2006), major galaxy mergers (e.g. Di Matteo et al. 2005), internal instabilities or minor interactions (e.g. Hopkins & Hernquist 2006) and accretion of recycled gas from evolved stars (e.g. Ciotti & Ostriker 1997, 2007). Semi-analytic models use combinations of these physical processes to explain the formation of galaxies and the growth of SMBHs at their centres (e.g. Somerville et al., 2008; Fontanot et al., 2007a; Fanidakis et al., 2010). In some of these models the evolution of the AGN population is intimately related to changes in the dominant accretion mode with time (e.g. Fanidakis et al., 2010). Such changes are expected to imprint on the properties of AGN hosts, e.g. their morphology, star-formation history, stellar mass and small/large scale environment.
In this paper the rest-frame colours of AGN hosts are used as proxy for their integrated star-formation history to explore variations of this quantity with redshift from to . Within the uncertainties, we do not find evidence that the relative number of red/blue X-ray AGN hosts changes with redshift, in agreement with recent results from ChaMP (Haggard et al., 2010). Also, the fraction of the accretion density associated with active SMBHs in the red sequence and the blue cloud is nearly constant since . These findings suggest that the galaxies that host X-ray AGN have similar integrated star-formation histories at all redshifts probed in this paper, , 0.3 and 0.8. This argues against systematic changes of the dominant accretion mode from to . The same process or combination of processes for fueling SMBHs are likely in operation from to the present day.
There are caveats in this conclusion. A large fraction of the accretion power at all redshifts is associated with luminous AGN. In many of those sources the radiation from the central engine dominates the optical continuum. The optical colours of those systems do not provide any information on the stellar population of their host galaxies. Our analysis is therefore insensitive to systematic variations with redshift in the fueling mode of broad line AGN. Additionally our conclusions are for moderate luminosity AGN, and do not apply to QSOs with luminosities , as the volumes of all three samples used here are too small to identify large numbers of those sources. Scattered AGN light may also contaminate the observed colours of galaxies, even in the absence of broad optical emission lines or a dominant nuclear point sources. Nevertheless, the work of Pierce et al. (2010) suggests that this effect is small. Reddening of the intrinsic galaxy colours by dust (Cardamone et al., 2010) is also expected to affect our conclusions.
If there is little or no change with redshift in the relative importance of SMBH fueling modes, how is the strong evolution of the AGN population explained? An important piece of evidence for addressing this question is the nearly constant fraction of X-ray AGN relative to the OLF of galaxies as a function of redshift. This suggest that the decline of the accretion power of the Universe since is linked, at least to the first approximation, to the evolution of the galaxy OLF, which in turn is the result of secular evolution processes and the decrease with time of the star-formation rate density of the Universe. Our results are therefore consistent with a fixed accretion mode (or combination of accretion modes) superimposed on an evolving galaxy population.
The stellar mass function of AGN relative to galaxies provides complementary information on the evolution of active SMBHs. It is found that X-ray AGN hosts out to span a wide range of stellar masses, although their fraction increases with stellar mass in agreement with previous studies (Kauffmann et al., 2003; Shi et al., 2008; Silverman et al., 2009a; Xue et al., 2010; Haggard et al., 2010). This trend is more pronounced at lower redshift, where the distribution of the fraction of galaxies with X-ray AGN increases nearly monotonically with stellar mass. At higher redshifts however, the distribution levels off at intermediate masses, . Similar trends are reported by Shi et al. (2008) and Bundy et al. (2008), although their X-ray AGN samples are selected at brighter luminosities, , compared to our limit of . It is also found that the fraction of galaxies hosting an active SMBH decreases with redshift at a given stellar mass bin. For the red AGN/galaxy populations this decrease is because of the build-up of the red galaxy stellar mass function from to and the overall decline of the AGN space density. For AGN with blue colours however, the blue galaxy MF hardly evolves with redshift (e.g. Borch et al., 2006). The decline of the fraction of blue galaxies that host AGN at a given stellar mass bin is primarily because the space density of blue AGN drops with redshift.
Kauffmann & Heckman (2009) found evidence for two regimes of SMBH growth in the nearby Universe. The first (“feast”) is associated with actively star-forming galaxies and is characterized by a log-normal distribution of accretion rates peaked at a few percent of the Eddington limit. For these galaxies the gas supply is abundant to feed both star-formation and substantial SMBH growth. The second regime (“famine”) is associated with evolved galaxies and has a power-law distribution of accretion rates. The SMBHs of these systems is likely to be fed by recycled gas from the evolved stellar population and their growth rates are small. The transition between the two modes occurs where the inverse of specific star-formation rate, , is comparable to the age of the Universe, i.e. for galaxies that experience significant growth of their stellar mass today. Independent work has shown that at a given stellar mass interval the quantity decreases with increasing redshift (e.g. Pérez-González et al., 2008), i.e. galaxies were more active in the past. Therefore at a given stellar mass bin the fraction of galaxies above the limit which marks the transition from the “famine” to the “feast” SMBH growth regimes drops with redshift. If the X-ray AGN selection is dominated by SMBH in the “feast” mode then the observed decline of the fraction of galaxies that host X-ray AGN from to at a given stellar mass, could be a direct result of the evolution of the with redshift, i.e. the decline of the volume density of potential AGN hosts.
It is indeed expected that most sources in our X-ray selected sample will be in the “feast” mode. AGN in the “famine” regime are likely to be very faint, close to or below the luminosity limit . Kauffmann & Heckman (2009) showed that SMBHs that grow in the “famine” regime live in old galaxies with 4000 Å break amplitude . AGN in such galaxies typically have [OIII] 5007 emission line luminosities, (see Figure 12 of Kauffmann et al. 2003). Adopting a ratio between X-ray and [OIII] 5007Å luminosities (Georgantopoulos & Akylas 2009), we estimate for the optically selected SDSS AGN in the “famine” regime (). We caution that there is a large scatter in the ratios and faint or obscured AGN may have much lower ratios than what is adopted here (e.g. Netzer et al., 2006; Georgantopoulos & Akylas, 2010). The conversion of [OIII] 5007Å to X-ray luminosity is therefore uncertain and the X-ray luminosities above may be overestimated by as much as 1 dex. In any case these calculations show that most X-ray AGN with are in the “feast” stage of SMBH growth. This is in agreement with the results of Silverman et al. (2009a) who measured 4000 Å break amplitudes for most X-ray AGN at with in the COSMOS survey.
A number of studies already point to a link between AGN and star-formation out to . The similarities between the global star-formation rate density evolution (e.g. Hopkins, 2004) and the accretion power history of the Universe (e.g. Aird et al., 2010) suggests that the two processes are connected, at least in a statistical manner (e.g. Zheng et al., 2009). There is also evidence that the mean star-formation rate of moderate luminosity X-ray AGN hosts evolves with time in a manner that closely mirrors the overall galaxy population (Silverman et al., 2009a; Lutz et al., 2010; Shao et al., 2010). This similarity would imprint in the -band OLF of AGN and galaxies, as found in this paper. In apparent contradiction to those results, Bundy et al. (2008) found evidence for an association between AGN activity and the quenching of the star-formation in galaxies, i.e. their transformation from blue star-forming to evolved red systems. However, this does not necessarily oppose studies that claim a link between the formation of young stars and the growth of SMBHs, as long as the quenching timescale is comparable to or longer than the duration of the star-formation burst.
Our analysis suggests that the evolution of the moderate luminosity X-ray AGN population is related to (i) the presence of a specific star-formation rate of galaxies which marks the transition from abundant to little gas supply to the SMBH and (ii) the decline with redshift of the mean specific star-formation rate of galaxies. In this interpretation it is the decrease at lower redshift of the number density of potential AGN hosts that drives the evolution of moderate luminosity X-ray AGN since . This further underlines the importance of constraining galaxy formation scenarios to understand the growth of SMBHs.
8 Conclusions
Deep small angular size surveys are combined with wide-area/shallow samples to study the evolution of moderate luminosity X-ray AGN from to . The rest-frame colours of AGN hosts are used as proxy for their integrated star-formation history.
It is found that the fraction of the accretion density associated with red or blue AGN hosts does not change with redshift within the uncertainties. This argues against scenarios in which the dominant mode of SMBH growth changes with redshift since .
There is evidence that the evolution of the AGN population is associated with the decrease with redshift of the space density of potential AGN hosts. We find that the fraction of galaxies of a given -band absolute magnitude that host X-ray AGN changes little (95 per cent confidence level) from to , despite the rapid decline of the AGN space density at this redshift interval (close to 1 dex). This suggests a link between AGN, the secular evolution of galaxies and the decline of the global star-formation rate to the present day.
When the fraction of AGN among galaxies is plotted against stellar mass a systematic decline with redshift is found (99.98 per cent confidence level). This is because of the build-up of the stellar mass of galaxies and the decrease of the space density of AGN to lower redshift.
It is argued that these trends are consistent with a picture where most X-ray AGN live in systems with abundant gas reservoirs, but as the gas supply, and hence the specific star formation of the galaxy population, drops with redshift, the number density of AGN also decreases.
| () | () | () | () | () | () | () |
|---|---|---|---|---|---|---|
| XMM/SDSS | ||||||
| 41-42 | ||||||
| 42-43 | ||||||
| 43-44 | ||||||
| NHS | ||||||
| 41-42 | ||||||
| 42-43 | ||||||
| 43-44 | ||||||
| AEGIS/GOODS | ||||||
| 41-42 | ||||||
| 42-43 | ||||||
| 43-44 | ||||||
| 44-45 | ||||||
-
The columns are: (1): X-ray luminosity interval; (2): space density for all X-ray AGN; (3) space density for X-ray AGN in red hosts; (4) space density for X-ray AGN in blue hosts; (5) X-ray luminosity density for all X-ray AGN; (6) X-ray luminosity density for X-ray AGN in red hosts; (7) X-ray luminosity density for X-ray AGN in blue hosts;
| (mag) | () | () | () | () | () | () |
|---|---|---|---|---|---|---|
| XMM/SDSS | ||||||
| –18.25 | ||||||
| –18.75 | ||||||
| –19.25 | ||||||
| –19.75 | ||||||
| –20.25 | ||||||
| –20.75 | ||||||
| –21.25 | ||||||
| –21.75 | ||||||
| –22.25 | – | – | – | |||
| –22.75 | – | – | ||||
| NHS | ||||||
| –18.25 | – | |||||
| –18.75 | ||||||
| –19.25 | ||||||
| –19.75 | ||||||
| –20.25 | ||||||
| –20.75 | ||||||
| –21.25 | ||||||
| AEGIS/GOODS | ||||||
| –18.25 | ||||||
| –18.75 | ||||||
| –19.25 | ||||||
| –19.75 | ||||||
| –20.25 | ||||||
| –20.75 | ||||||
| –21.25 | ||||||
| –21.75 | ||||||
| –22.25 | ||||||
| –22.75 | – | |||||
| –23.25 | – | – | – | |||
-
The columns are: (1): Absolute magnitude at the middle of the bin with size .; (2): space density for all X-ray AGN; (3) space density for X-ray AGN in red hosts; (4) space density for X-ray AGN in blue hosts; (5) space density of galaxies; (6) space density of red galaxies; (7) space density of blue galaxies.
| () | () | () | () | () | () | () |
|---|---|---|---|---|---|---|
| XMM/SDSS | ||||||
| 9.1 | – | |||||
| 9.3 | ||||||
| 9.5 | – | |||||
| 9.7 | ||||||
| 9.9 | ||||||
| 10.1 | ||||||
| 10.3 | ||||||
| 10.5 | ||||||
| 10.7 | ||||||
| 10.9 | ||||||
| 11.1 | – | |||||
| 11.3 | – | – | – | |||
| 11.5 | – | |||||
| 11.7 | – | – | – | – | ||
| NHS | ||||||
| 9.1 | – | – | – | |||
| 9.3 | – | |||||
| 9.5 | – | |||||
| 9.7 | ||||||
| 9.9 | ||||||
| 10.1 | ||||||
| 10.3 | ||||||
| 10.5 | ||||||
| 10.7 | – | |||||
| 10.9 | – | |||||
| 11.1 | – | – | – | – | ||
| 11.3 | – | – | – | – | ||
| 11.5 | – | – | – | – | – | |
| 11.7 | – | – | – | – | – | – |
| AEGIS/GOODS | ||||||
| 9.1 | – | – | – | |||
| 9.3 | – | |||||
| 9.5 | ||||||
| 9.7 | ||||||
| 9.9 | ||||||
| 10.1 | ||||||
| 10.3 | ||||||
| 10.5 | ||||||
| 10.7 | ||||||
| 10.9 | ||||||
| 11.1 | ||||||
| 11.3 | ||||||
| 11.5 | – | |||||
| 11.7 | – | – | – | |||
-
The columns are: (1): Stellar mass at the middle of the bin with size ; (2): space density for all X-ray AGN; (3) space density for X-ray AGN in red hosts; (4) space density for X-ray AGN in blue hosts; (5) space density of galaxies; (6) space density of red galaxies; (7) space density of blue galaxies.
9 Acknowledgments
AG acknowledges financial support from the Marie-Curie Reintegration Grant PERG03-GA-2008-230644. Based on observations made with ESO Telescopes at the La Silla and Paranal Observatories under programme IDs 078.B-0623A and 080.B-0409A. Funding for the DEEP2 Galaxy Redshift Survey has been provided in part by NSF grants AST95-09298, AST-0071048, AST-0071198, AST-0507428, and AST-0507483 as well as NASA LTSA grant NNG04GC89G. Funding for the Sloan Digital Sky Survey (SDSS) has been provided by the Alfred P. Sloan Foundation, the Participating Institutions, the National Aeronautics and Space Administration, the National Science Foundation, the U.S. Department of Energy, the Japanese Monbukagakusho, and the Max Planck Society. The SDSS Web site is http://www.sdss.org/. The SDSS is managed by the Astrophysical Research Consortium (ARC) for the Participating Institutions. The Participating Institutions are The University of Chicago, Fermilab, the Institute for Advanced Study, the Japan Participation Group, The Johns Hopkins University, Los Alamos National Laboratory, the Max-Planck-Institute for Astronomy (MPIA), the Max-Planck-Institute for Astrophysics (MPA), New Mexico State University, University of Pittsburgh, Princeton University, the United States Naval Observatory, and the University of Washington.
References
- Abazajian et al. (2009) Abazajian K. N., et al., 2009, ApJS, 182, 543
- Aird et al. (2010) Aird J., et al., 2010, MNRAS, 401, 2531
- Allevato et al. (2011) Allevato V., et al., 2011, ArXiv 1105.0520
- Balestra et al. (2010) Balestra I., Mainieri V., Popesso P., Dickinson M., Nonino M., Rosati P., Teimoorinia H., Vanzella E., Cristiani S., Cesarsky C., Fosbury R. A. E., Kuntschner H., Rettura A., 2010, A&A, 512, A12+
- Barger et al. (2003) Barger A. J., Cowie L. L., Capak P., Alexander D. M., Bauer F. E., Fernandez E., Brandt W. N., Garmire G. P., Hornschemeier A. E., 2003, AJ, 126, 632
- Barger et al. (2005) Barger A. J., Cowie L. L., Mushotzky R. F., Yang Y., Wang W.-H., Steffen A. T., Capak P., 2005, AJ, 129, 578
- Benson et al. (2003) Benson A. J., Bower R. G., Frenk C. S., Lacey C. G., Baugh C. M., Cole S., 2003, ApJ, 599, 38
- Blanton (2006) Blanton M. R., 2006, ApJ, 648, 268
- Blanton & Roweis (2007) Blanton M. R., Roweis S., 2007, AJ, 133, 734
- Blanton et al. (2005) Blanton M. R., Schlegel D. J., Strauss M. A., Brinkmann J., Finkbeiner D., Fukugita M., Gunn J. E., Hogg D. W., Ivezić Ž., Knapp G. R., Lupton R. H., Munn J. A., Schneider D. P., Tegmark M., Zehavi I., 2005, AJ, 129, 2562
- Borch et al. (2006) Borch A., Meisenheimer K., Bell E. F., Rix H., Wolf C., Dye S., Kleinheinrich M., Kovacs Z., Wisotzki L., 2006, A&A, 453, 869
- Bundy et al. (2008) Bundy K., et al., 2008, ApJ, 681, 931
- Cardamone et al. (2010) Cardamone C. N., Urry C. M., Schawinski K., Treister E., Brammer G., Gawiser E., 2010, ApJ, 721, L38
- Cattaneo et al. (2007) Cattaneo A., Blaizot J., Weinberg D. H., Kereš D., Colombi S., Davé R., Devriendt J., Guiderdoni B., Katz N., 2007, MNRAS, 377, 63
- Cattaneo et al. (2009) Cattaneo A., et al., 2009, Nature, 460, 213
- Cen (2011) Cen R., 2011, arXiv:1102.0262
- Ciotti & Ostriker (1997) Ciotti L., Ostriker J. P., 1997, ApJ, 487, L105+
- Ciotti & Ostriker (2007) —, 2007, ApJ, 665, 1038
- Cisternas et al. (2011) Cisternas M., et al., 2011, ApJ, 726, 57
- Coil et al. (2009) Coil A. L., Georgakakis A., Newman J. A., Cooper M. C., Croton D., Davis M., Koo D. C., Laird E. S., Nandra K., Weiner B. J., Willmer C. N. A., Yan R., 2009, ApJ, 701, 1484
- Coil et al. (2004) Coil A. L., Newman J. A., Kaiser N., Davis M., Ma C., Kocevski D. D., Koo D. C., 2004, ApJ, 617, 765
- Cowie et al. (2003) Cowie L. L., Barger A. J., Bautz M. W., Brandt W. N., Garmire G. P., 2003, ApJ, 584, L57
- Croton et al. (2006) Croton D. J., et al., 2006, MNRAS, 365, 11
- Davis et al. (2003) Davis M., et al., 2003, in Society of Photo-Optical Instrumentation Engineers (SPIE) Conference Series, Guhathakurta P., ed., Vol. 4834, pp. 161–172
- Davis et al. (2007) —, 2007, ApJ, 660, L1
- Di Matteo et al. (2005) Di Matteo T., Springel V., Hernquist L., 2005, Nature, 433, 604
- Dickinson et al. (2004) Dickinson M., et al., 2004, ApJ, 600, L99
- Faber et al. (2003) Faber S. M., et al., 2003, in Society of Photo-Optical Instrumentation Engineers (SPIE) Conference, Vol. 4841, Instrument Design and Performance for Optical/Infrared Ground-based Telescopes, Iye M., Moorwood A. F. M., eds., pp. 1657–1669
- Fanidakis et al. (2010) Fanidakis N., Baugh C. M., Benson A. J., Bower R. G., Cole S., Done C., Frenk C. S., Hickox R. C., Lacey C., Lagos C. d. P., 2010, arXiv-1011.5222
- Ferrarese & Merritt (2000) Ferrarese L., Merritt D., 2000, ApJ, 539, L9
- Fontanot et al. (2007a) Fontanot F., Cristiani S., Monaco P., Nonino M., Vanzella E., Brandt W. N., Grazian A., Mao J., 2007a, A&A, 461, 39
- Fontanot et al. (2007b) Fontanot F., Monaco P., Silva L., Grazian A., 2007b, MNRAS, 382, 903
- Gabor et al. (2009) Gabor J. M., et al., 2009, ApJ, 691, 705
- Gebhardt et al. (2000) Gebhardt K., Bender R., Bower G., Dressler A., Faber S. M., Filippenko A. V., Green R., Grillmair C., Ho L. C., Kormendy J., Lauer T. R., Magorrian J., Pinkney J., Richstone D., Tremaine S., 2000, ApJ, 539, L13
- Georgakakis et al. (2008) Georgakakis A., Gerke B. F., Nandra K., Laird E. S., Coil A. L., Cooper M. C., Newman J. A., 2008, MNRAS, 391, 183
- Georgakakis & Nandra (2011) Georgakakis A., Nandra K., 2011, ArXiv: 1101.4943
- Georgakakis et al. (2006) Georgakakis A., et al., 2006, MNRAS, 371, 221
- Georgakakis et al. (2009) —, 2009, MNRAS, 397, 623
- Georgantopoulos & Akylas (2010) Georgantopoulos I., Akylas A., 2010, A&A, 509, A38+
- Georgantopoulos et al. (2005) Georgantopoulos I., Georgakakis A., Koulouridis E., 2005, MNRAS, 360, 782
- Green et al. (2009) Green P. J., Aldcroft T. L., Richards G. T., Barkhouse W. A., Constantin A., Haggard D., Karovska M., Kim D., Kim M., Vikhlinin A., Anderson S. F., Mossman A., Kashyap V., Myers A. C., Silverman J. D., Wilkes B. J., Tananbaum H., 2009, ApJ, 690, 644
- Haggard et al. (2010) Haggard D., Green P. J., Anderson S. F., Constantin A., Aldcroft T. L., Kim D., Barkhouse W. A., 2010, ApJ, 723, 1447
- Hasinger (2008) Hasinger G., 2008, A&A, 490, 905
- Hickox et al. (2009) Hickox R. C., et al., 2009, ApJ, 696, 891
- Hopkins (2004) Hopkins A. M., 2004, ApJ, 615, 209
- Hopkins & Hernquist (2006) Hopkins P. F., Hernquist L., 2006, ApJS, 166, 1
- Hopkins et al. (2008) Hopkins P. F., Hernquist L., Cox T. J., Kereš D., 2008, ApJS, 175, 356
- Hornschemeier et al. (2003) Hornschemeier A. E., Bauer F. E., Alexander D. M., Brandt W. N., Sargent W. L. W., Bautz M. W., Conselice C., Garmire G. P., Schneider D. P., Wilson G., 2003, AJ, 126, 575
- Juneau et al. (2011) Juneau S., Dickinson M., Alexander D. M., Salim S., 2011, ArXiv 1105.3194
- Kauffmann & Heckman (2009) Kauffmann G., Heckman T. M., 2009, MNRAS, 397, 135
- Kauffmann et al. (2003) Kauffmann G., Heckman T. M., Tremonti C., Brinchmann J., Charlot S., White S. D. M., Ridgway S. E., Brinkmann J., Fukugita M., Hall P. B., Ivezić Ž., Richards G. T., Schneider D. P., 2003, MNRAS, 346, 1055
- Kauffmann et al. (2004) Kauffmann G., White S. D. M., Heckman T. M., Ménard B., Brinchmann J., Charlot S., Tremonti C., Brinkmann J., 2004, MNRAS, 353, 713
- Kenter et al. (2005) Kenter A., et al., 2005, ApJS, 161, 9
- Laird et al. (2009) Laird E. S., et al., 2009, ApJS, 180, 102
- Le Fèvre et al. (2004) Le Fèvre O., et al., 2004, A&A, 428, 1043
- Lin et al. (1999) Lin H., Yee H. K. C., Carlberg R. G., Morris S. L., Sawicki M., Patton D. R., Wirth G., Shepherd C. W., 1999, ApJ, 518, 533
- Lin et al. (2010) Lin L., et al., 2010, ApJ, 718, 1158
- Lutz et al. (2010) Lutz D., et al., 2010, ApJ, 712, 1287
- Mignoli et al. (2005) Mignoli M., et al., 2005, A&A, 437, 883
- Monaco et al. (2007) Monaco P., Fontanot F., Taffoni G., 2007, MNRAS, 375, 1189
- Morrison & McCammon (1983) Morrison R., McCammon D., 1983, ApJ, 270, 119
- Nandra & Pounds (1994) Nandra K., Pounds K. A., 1994, MNRAS, 268, 405
- Netzer et al. (2006) Netzer H., Mainieri V., Rosati P., Trakhtenbrot B., 2006, A&A, 453, 525
- Padmanabhan et al. (2008) Padmanabhan N., et al., 2008, ApJ, 674, 1217
- Pérez-González et al. (2008) Pérez-González P. G., et al., 2008, ApJ, 675, 234
- Pierce et al. (2007) Pierce C. M., Lotz J. M., Laird E. S., Lin L., Nandra K., Primack J. R., Faber S. M., Barmby P., Park S. Q., Willner S. P., Gwyn S., Koo D. C., Coil A. L., Cooper M. C., Georgakakis A., Koekemoer A. M., Noeske K. G., Weiner B. J., Willmer C. N. A., 2007, ApJ, 660, L19
- Pierce et al. (2010) Pierce C. M., et al., 2010, MNRAS, 408, 139
- Popesso et al. (2008) Popesso P., et al., 2008, ArXiv0802.2930
- Popesso et al. (2009) —, 2009, A&A, 494, 443
- Sarzi et al. (2010) Sarzi M., et al., 2010, MNRAS, 402, 2187
- Schlegel et al. (1998) Schlegel D. J., Finkbeiner D. P., Davis M., 1998, ApJ, 500, 525
- Schmidt (1968) Schmidt M., 1968, ApJ, 151, 393
- Scoville et al. (2007) Scoville N., Aussel H., Brusa M., Capak P., Carollo C. M., Elvis M., Giavalisco M., Guzzo L., Hasinger G., Impey C., Kneib J.-P., LeFevre O., Lilly S. J., Mobasher B., Renzini A., Rich R. M., Sanders D. B., Schinnerer E., Schminovich D., Shopbell P., Taniguchi Y., Tyson N. D., 2007, ApJS, 172, 1
- Shao et al. (2010) Shao L., et al., 2010, A&A, 518, L26+
- Shi et al. (2008) Shi Y., Rieke G., Donley J., Cooper M., Willmer C., Kirby E., 2008, ApJ, 688, 794
- Silverman et al. (2009a) Silverman J. D., et al., 2009a, ApJ, 696, 396
- Silverman et al. (2009b) —, 2009b, ApJ, 695, 171
- Somerville et al. (2008) Somerville R. S., Hopkins P. F., Cox T. J., Robertson B. E., Hernquist L., 2008, ArXiv0808.1227
- Stanway et al. (2004a) Stanway E. R., Bunker A. J., McMahon R. G., Ellis R. S., Treu T., McCarthy P. J., 2004a, ApJ, 607, 704
- Stanway et al. (2004b) Stanway E. R., et al., 2004b, ApJ, 604, L13
- Strauss et al. (2002) Strauss M. A., et al., 2002, AJ, 124, 1810
- Szokoly et al. (2004) Szokoly G. P., et al., 2004, ApJS, 155, 271
- Vanzella et al. (2005) Vanzella E., et al., 2005, A&A, 434, 53
- Vanzella et al. (2008) —, 2008, A&A, 478, 83
- Wang et al. (2007) Wang L., Li C., Kauffman G., De Lucia G., 2007, MNRAS, 377, 1419
- Weiner et al. (2005) Weiner B. J., et al., 2005, ApJ, 620, 595
- Willmer et al. (2006) Willmer C. N. A., et al., 2006, ApJ, 647, 853
- Wirth et al. (2004) Wirth G. D., et al., 2004, AJ, 127, 3121
- Xue et al. (2010) Xue Y. Q., Brandt W. N., Luo B., Rafferty D. A., Alexander D. M., Bauer F. E., Lehmer B. D., Schneider D. P., Silverman J. D., 2010, ApJ, 720, 368
- Yan et al. (2011) Yan R., et al., 2011, ApJ, 728, 38
- Zheng et al. (2009) Zheng X. Z., Bell E. F., Somerville R. S., Rix H., Jahnke K., Fontanot F., Rieke G. H., Schiminovich D., Meisenheimer K., 2009, ApJ, 707, 1566
- Zibetti et al. (2009) Zibetti S., Charlot S., Rix H., 2009, MNRAS, 400, 1181