Center for Polymer Studies, Boston University, Boston, Massachusetts 02215, USA
Networks and genealogical trees Structures and organization in complex networks Systems obeying scaling laws
Effect of degree correlations above the first shell on the percolation transition
Abstract
The use of degree-degree correlations to model realistic networks which are characterized by their Pearson’s coefficient, has become widespread. However the effect on how different correlation algorithms produce different results on processes on top of them, has not yet been discussed. In this letter, using different correlation algorithms to generate assortative networks, we show that for very assortative networks the behavior of the main observables in percolation processes depends on the algorithm used to build the network. The different alghoritms used here introduce different inner structures that are missed in Pearson’s coefficient. We explain the different behaviors through a generalization of Pearson’s coefficient that allows to study the correlations at chemical distances from a root node. We apply our findings to real networks.
pacs:
89.75.Hcpacs:
89.75.Fbpacs:
89.75.Da1 Introduction
In the last two decades, the use of complex networks in the study of many processes, such as the spread of diseases, random or intentional attacks, synchronization, etc. [1, 2, 3], has led to a deeper understanding of these processes. For example, the use of network-based models in epidemiology has demonstrated how the topology affects the total fraction of the infected population and how it’s knowledge can be used to develop efficient immunization strategies [4]. Each of the aspects of the network topology has a substantial effect on the processes taking place on the underlying network.
A first feature of the network topology is the degree distribution , i.e., the fraction of nodes with degree . One of the most used networks is the Erdös Rényi (ER) [5] with , where is the average degree. However in real networks the degree distribution fits better to a scale-free (SF) , where is the broadness of the distribution. Many of these networks also have an exponential cutoff [6], and the degree distribution can be represented by .
Several analytical and numerical models on degree-degree uncorrelated networks were developed with the above distributions [7, 8]. However, in the last years it has been observed that in real networks, the degrees of the linked nodes are correlated. For example, it is known that in social networks, nodes tend to be linked to others with similar degree, while in technological networks, large degree nodes tend to be connected with low-degree ones. Networks with the first pattern of connections are called assortative, while those with the second pattern are disassortative. Recent researches suggest that networks adopt a correlated structure in order to optimize some processes that are developed on top of them, such as synchronization [9], transport [10], traffic dynamic [11], congestion [12] and growth [13]. As a consequence, it is necessary to consider models of networks with degree-degree correlations in order to study how the processes are affected by them. There are different measures to quantify the correlations between nearest neighbors [1, 2]. The most detailed measure is the joint degree distribution , which indicates the probability that a node of degree is linked with another of degree . However, due to the large amount of information contained in this distribution, it is difficult to interpret the results based on . Hence more global measures are needed to simplify the interpretation of the results. For example, a measure which follows from the above and is more simplified is the average nearest neighbor degree of a node with connectivity , . The sign of the slope of is positive (negative) for assortative (disassortative) networks. However, the most used measurement is Pearson’s coefficient, which is less detailed than the previous ones and gives a general overview of the correlation to nearest neighbors on the network. Pearson’s coefficient is given by
| (1) |
where is the average over . Assortative networks have , while disassortative networks have . Finally, networks with are called uncorrelated.
Many studies that concentrate on how the degree-degree correlation affects the processes on top of networks, use Pearson’s coefficient to quantify the results. For example in Ref. [9] it has been observed that synchronization is enhanced for . Also, in Ref. [12], under a gradient network formalism, the authors explain why in disassortative networks the congestion is lower than in uncorrelated and assortative ones. On the other hand, some studies on the effect of degree-degree correlations were focused on the link percolation process [14, 15, 16, 17]. The investigations on this process are very useful since they provide information about how resistant a network is against random failures and also due to the relation between percolation with some aspects of the spread of diseases [18, 19, 20, 21, 22]. For uncorrelated networks, it is well known that in percolation processes there is a critical fraction of nodes/links, above which the network undergoes a second order phase transition [7, 19]. The order parameter of the transition is , which is the fraction of nodes that belong to the largest component for a given value of . For infinite systems () and close to the threshold (), the order parameter behaves as [23]
| (2) |
and the average value of the size of the finite clusters goes as
| (3) |
where and in the mean field approach [23]. In the case of finite networks with nodes, Eq. (3) obey the general scaling law
| (4) |
where is a scaling function that behaves as a constant at the threshold, with for uncorrelated ER and SF networks with [24, 25].
Newman [26] and Miller [27] showed that networks with are more resilient to damage than those with . However, there has been little discussion in the literature about whether the percolation phase transition remains of second order depending on the value of . This issue was only addressed in Ref. [28] where they found that in correlated networks constructed using a Metropolis algorithm and characterized by , for the disassortative case percolation belong to the same universality class as uncorrelated networks but highly assortative networks have no second order phase transition. A recent investigation by Dorotgsev et. al [29] pointed out that recursive trees can be constructed with a highly correlated structure but with zero Pearson’s coefficient. On the other hand, in Ref. [30] the authors show that positive correlations affects the loop statistics on networks. Thus, Pearson’s coefficient could hide a more complex pattern of connections between nodes that also affect the processes that spread on networks. This raises the question as to whether or not Pearson’s coefficient is a reliable tool for characterizing correlated networks and, in particular, the percolation transition on assortative networks.
In this letter we use different correlation algorithms to determine the effect of very assortative networks on the link percolation transition. We find that the results depend strongly on the algorithm used to correlate the networks and not on the value of Pearson’s coefficient. Moreover, we find that strong correlations above the first shell on assortative networks affect the percolation transition.
2 Correlation Algorithms
We will focus only on assortative networks because we want to understand the effect of different algorithms in the percolation transition.
In this work we use rewiring algorithms to correlate the networks, since they preserve the degree distribution . In particular we focus on two correlation algorithms: the Exponential Random Graph (ERG) [28] and the Local Optimal Algorithm (LOA) introduced by us.
For the ERG algorithm, the process to correlate a network or graph [28], is based on a Metropolis dynamic, which uses a “Hamiltonian” function given by , where is the component of the adjacency matrix, () is the connectivity of node () and is a control parameter for the correlation. For () an assortative (disassortative) network is built. This algorithm generates a Gibbsian ensemble network and is ergodic. The algorithm correlates the network, successively applying the following steps:
-
1.
in a network , two links are chosen randomly to be correlated.
-
2.
rewiring is allowed (from configuration to ) with probability , disallowing autoloops and multiple connections.
The rewiring process continues until the steady state, where for large enough system sizes, depends only on (not shown here).
In the LOA algorithm, a network is correlated as follows:
-
1.
two links are randomly chosen from the network to be correlated.
-
2.
for assortative (disassortative) networks, we choose the configuration that increases (decreases) most Pearson’s coefficient without generating autoloops or multiple connections.
This algorithm is not ergodic but achieves the desired correlation faster, since in contrast to the previous one, we do not have to wait for the equilibrium value in order to reach the desired value of .
3 Results and Discussion
3.1 Link percolation on assortative networks
In this section we study the effects of the correlation algorithms on the percolation transition in assortative networks.
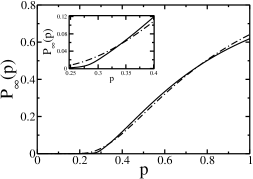
In Fig.1, we show for an ER network with fixed and for the ERG and LOA models. Even though the curves do not differ significantly between them, in the inset we can see that , close to the threshold computed with different algorithms converge to zero with different slopes, suggesting that the transitions are different even if the same value of is used in both algorithms. The behavior of for networks generated with the ERG algorithm seems to be nonsingular.
It is well known that in the thermodynamic limit a second order phase transition, has a singularity in the derivative of the order parameter at the threshold . In Fig.2 we plot the derivative of with respect to for different networks sizes. From the plots, we can see that in strong positive correlated networks with the LOA algorithm, the derivative of exhibit a singularity as we increase the system size, characteristic of a second order phase transition. However for the ERG model the slope is smooth and does not depend on . Therefore, we confirm that the transitions for the ERG and the LOA are not the same [28].
In order to verify the existence of a second order phase transition, we compute for ER and different network sizes as shown in Fig.3. We can see that with the LOA correlation model as increases, the peak of increases around the critical threshold as in a second-order phase transition [23]. At (see Eq. (4)) , suggesting that percolation in assortative networks generated by the LOA belong to a different universality class from that in uncorrelated networks. As noted by Noh using the ERG model [28], has no peak independent of the value of , which still indicates that the transition is not of second order.
We run all our simulations for SF networks with exponential cutoff and find similar behavior that for ER networks. In Fig. 4 we show that the derivative of and do not exhibit any singularity as we increase the network size for the ERG model, in contrast to the LOA model.
Despite the discrepancies between the assortative networks, we find that disassortative networks generated by both algorithms undergo a second-order phase transition with , which not only confirms that disassortative networks belong to the same universality class as uncorrelated ones, but also that the critical exponents are independent of the algorithm used to generate negative correlations. Consequently, we conclude that while Pearson’s coefficient is a good measure to uniquely characterize the percolation transition on disassortatives and uncorrelated networks, it fails to characterize the transition on very assortative networks. The discrepancies between the assortative networks generated with different algorithms must underlie on structural differences introduced by the algorithms, which cannot be explained by only Pearson’s coefficient. Hence, we will show below the different effects that both algorithms introduce on the network topology.
3.2 Correlations above the first shell
In order to explain the differences between assortative networks with the same value of but correlated with different algorithms, we propose a new measure called generalized Pearson’s coefficient , which measures the correlation between the connectivity of a root node and the neighbors at a chemical distance , i.e. which are located in the shell from the root . In this way, we denote the usual Pearson’s coefficient as , Pearson’s coefficient to second neighbors as and so forth. We define,
| (5) |
where is the average over , where is the probability that a node of degree is connected to a node of degree at the -shell.
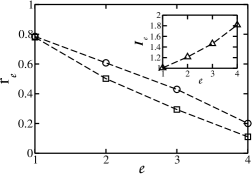
In Fig.5 we show for ER networks as a function of in assortative networks 111The understanding of the disassortative behavior of goes beyond the scope of this work., for . We can see that is a decreasing function of . Imposing high assortativity in the network, correlations above the first shell from a root node are generated. Thus, correlation will build groups of nodes connected with similar degrees at shells close to the root, forming groups of nodes of low degrees and others with high degree. The high degree groups will form a strong core very resilient to random failures. The stronger the correlations are above the first shell, the more resilient groups are, smoothing out the transition.
In the inset of Fig.5 we plot the factor defined as the ratio between for ERG and for LOA networks. Then () indicates that ERG networks have higher (lower) degree correlation at a distance than LOA networks. It is easy to see that for shells above , increases with reaching a value of for the fourth shell222For a SF network with , , and , we obtain that , however positive correlations only reach to the second shell. for . Thus ERG networks generate stronger correlation above shell than LOA networks supporting our picture that high assortative ERG networks posses a stronger structure of groups, with nodes of similar connectivities, than in the LOA model. This introduces two aspects of the network that contributes to erase the second-order phase transition in the ERG model. First, ERG networks have more homogeneous groups of nodes with low connectivity that are easier to fragment, generating smaller clusters than in LOA assortative networks. On the other hand, in ERG networks there are also more homogeneous groups of highly connected nodes that remain in the largest component through the percolation process333The same picture can be seen in onion networks [31, 32]. However onion and assortativity are distinct properties as pointed out in [31]., preventing the network from fragmenting into large finite clusters, and smoothing out the curve of near the threshold (see Fig.2). Consequently, these two aspects induce a greater presence of small clusters, leading to a non-diverging .
To determine if this behavior is representative of real networks, we measure on two different positive correlated SF real graphs, the condensed matter (cond-mat, and ) [33] and mathematics ( and ) [34] coauthorship networks. In both cases, we obtain that positive correlations are non-negative only until the second shell with , for the cond-mat collaboration network and , for the mathematics collaboration network. Consequently, real networks posses mainly correlation to first neighbors (), in contrast to the stronger correlation structure above found in the theoretical networks, particularly for ERG, and therefore the real graphs analyzed here have a less defined structure of groups of nodes connected with similar degrees, suggesting that there are constrains which prevent networks from evolving towards extreme correlations. This can be seen, for example, on both coauthorship networks used here. In general, coauthorship networks are made of research groups composed by senior researchers with high connectivity and young researchers generally with low connectivity. On one hand, senior researchers from different research groups have some connections between themselves in order to increase the resources and importance of their groups. Moreover, young researchers from the same group collaborate between themselves, because they generally work on similar projects. This explains the assortativity of the networks. On the other hand, in order to share their knowledges, senior researchers are highly connected to the young ones of their group, decreasing the assortativity. Thus the network evolves with an assortativity correlation, but with a not too high Pearson’s coefficient in order to improve the functionality of the full coauthorship network. This is why real assortative collaboration networks are not extreme assortativity correlated. Moreover, since this positive correlation decreases with as we can see in both real networks used here and in Router graph studied in Ref. [35], the correlation above the first shell is almost zero due to the small Pearson’s coefficient, which leads to a critical behavior of percolation process on these networks. In Fig.6 we plot for the real networks, the derivative of for the original data and after applying the LOA and the ERG models for networks with the same degree distribution. As we can see, there is a steep growth of the derivative near criticality, which is equally sharp in the LOA and ERG networks, supporting our argument that in real networks the second order phase transition exists. In turn, we note that ERG and LOA networks with the same degree distribution and Pearson’s coefficient as real networks, have also a second order phase percolation transition. Our results suggests that Pearson’s coefficient is a good indicator of the percolation transition order when the network is not strongly correlated above the first shell, but for high positive degree-degree correlations, different algorithms may generate different behaviors in percolation and therefore, Pearson’s coefficient is no longer useful to indicate the behavior of the transition. As a consequence, it becomes crucial to use measures that take into account the inner structure of the network, such as , that as we show here is a better indicator of whether a network will undergo or not a critical phase percolation transition.
In summary, we find that the second order percolation transition on theoretical networks depends on the inner structure imposed by the algorithms used to build them, and not only on Pearson’s coefficient. This means that Pearson’s coefficient hides a long-range correlation that could change dramatically the behavior on top of them. We propose a new magnitude , which allows to explain the discrepancies between percolation transition on assortative networks generated by different correlation algorithms. For the real networks analyzed in this letter, we find that they posses mainly first neighbors correlation, and thus the percolation transition is of second order.
Acknowledgements.
This work was supported by UNMdP and FONCyT (PICT 0293/2008). The authors thanks Ana L. Pastore y Piontti and Joel C. Miller for useful discussions.References
- [1] \NameBoccaletti S., Latora V., Moreno Y., Chavez M. Hwang D. \REVIEWPhysics Reports 4242006175.
- [2] \NameDorogovtsev S. N. Mendes J. F. F. \BookEvolution of Networks (Oxford University Press) 2003.
- [3] \NameDorogovtsev S. N., Goltsev A. V. Mendes J. F. F. \REVIEWRev. Mod. Phys. 8020081275.
- [4] \NameCohen R., Havlin S. ben Avraham D. \REVIEWPhys. Rev. Lett. 912003247901.
- [5] \NameErdös P. Rényi A. \REVIEWPublications Mathematicae 61959290.
- [6] \NameAmaral L. A. N., Scala A., Barthélémy M. Stanley H. E. \REVIEWProc. Natl. Acad. Sci. USA 97200011149.
- [7] \NameNewman M. E. J., Strogatz S. H. Watts D. J. \REVIEWPhys. Rev. E 642001026118.
- [8] \NameMiller J. C. \REVIEWPhys. Rev. E 762007010101.
- [9] \NameSorrentino F., di Bernardo M., Cuéllar G. H. Boccaletti S. \REVIEWPhysica D 2242006123.
- [10] \NameXue Y.-H., Wang J., Li L., He D. Hu B. \REVIEWPhys. Rev. E 812010037101.
- [11] \NameSun J.-T., Wang S.-J., Huang Z.-G. Wang Y.-H. \REVIEWPhysica A 38820093244.
- [12] \NamePastore y Piontti A. L., Braunstein L. A. Macri P. A. \REVIEWPhysics Letters A 37420104658.
- [13] \NameShao J., Buldyrev S. V., Braunstein L. A., Havlin S. Stanley H. E. \REVIEWPhys. Rev. E 802009036105.
- [14] \NameVázquez A. Moreno Y. \REVIEWPhys. Rev. E 672003015101.
- [15] \NameXulvi-Brunet R. Sokolov I. M. \REVIEWPhys. Rev. E 702004066102.
- [16] \NameMoreira A. A., Andrade J. S., Herrmann H. J. Indekeu J. O. \REVIEWPhys. Rev. Lett. 1022009018701.
- [17] \NameHooyberghs H., Van Schaeybroeck B., Moreira A. A., Andrade J. S., Herrmann H. J. Indekeu J. O. \REVIEWPhys. Rev. E 812010011102.
- [18] \NameCallaway D. S., Newman M. E. J., Strogatz S. H. Watts D. J. \REVIEWPhys. Rev. Lett. 8520005468.
- [19] \NameCohen R., Erez K., ben Avraham D. Havlin S. \REVIEWPhys. Rev. Lett. 8520004626.
- [20] \NameCohen R., ben Avraham D. Havlin S. \REVIEWPhysical Review E 662002036113.
- [21] \NameNewman M. E. J. \REVIEWPhysical Review E 662002016128.
- [22] \NameGrassberger P. \REVIEWMath. Biosci. 631983157.
- [23] \NameStauffer D. Aharony A. \BookIntroduction to percolation theory (Taylor & Francis) 1985.
- [24] \NameBornholdt S. Schuster H. (Editors) \BookHandbook of graphs and networks (Wiley-VCH, Berlin) 2003.
- [25] \NameWu Z., Lagorio C., Braunstein L. A., Cohen R., Havlin S. Stanley H. E. \REVIEWPhysical Review E 752007066110.
- [26] \NameNewman M. E. J. \REVIEWPhysical Review E 672003026126.
- [27] \NameMiller J. C. \REVIEWPhys. Rev. E 802009020901.
- [28] \NameNoh J. \REVIEWPhysical Review E 76200702611.
- [29] \NameDorogovtsev S. N., Ferreira A. L., Goltsev A. V. Mendes J. F. F. \REVIEWPhys. Rev. E 812010031135.
- [30] \NameNoh J. \REVIEWThe European Physical Journal B 662008251.
- [31] \NameSchneider C. M., Moreira A. A., Andrade J. S., Havlin S. Herrmann H. J. \REVIEWProc. Natl. Acad. Sci. USA 38382011108.
- [32] \NameWu Z.-X. Holme P. \REVIEWPhys. Rev. E 842011026106.
- [33] \NameNewman M. E. J. \REVIEWProc. Natl. Acad. Sci. USA 982001404.
- [34] \NamePalla G., Farkas I. J., Pollner P., Derényi I. Vicsek T. \REVIEWNew J. Phys. 102008123026.
- [35] \NameEchenique P., Gómez-Gardeñes J., Moreno Y. Vázquez A. \REVIEWPhys. Rev. E 712005035102.