The emission of Cygnus X-1: observations with INTEGRAL SPI 111 Based on observations with INTEGRAL, an ESA project with instruments and science data centre funded by ESA member states (especially the PI countries: Denmark, France, Germany, Italy, Spain, and Switzerland), Czech Republic and Poland with participation of Russia and USA. from 20 keV to 2 Mev
Abstract
We report on Cyg X-1 observations performed by the SPI telescope onboard the INTEGRAL mission and distributed over more than 6 years. We investigate the variability of the intensity and spectral shape of this peculiar source in the hard X-rays domain, and more particularly up to the MeV region. We first study the total averaged spectrum which presents the best signal to noise ratio (4 Ms of data). Then, we refine our results by building mean spectra by periods and gathering those of similar hardness.
Several spectral shapes are observed with important changes in the curvature between 20 and 200 keV, even at the same luminosity level. In all cases, the emission decreases sharply above 700 keV, with flux values above 1 MeV (or upper limits) well below the recently reported polarised flux (Laurent et al. 2011), while compatible with the MeV emission detected some years ago by CGRO/COMPTEL (McConnell et al., 2002).
Finally, we take advantage of the spectroscopic capability of the instrument to seek for
spectral features in the 500 keV region with negative results
for any significant annihilation emission on 2 ks and days timescales, as well as in the total dataset.
Subject headings:
radiation mechanisms: general— Gamma-rays:individual (Cyg X-1) — gamma rays: observations1. Introduction
Cyg X-1 is an unavoidable target for any high energy instrument. Being one of the most luminous sources (up to the MeV range), it represents an ideal lab to study the mechanism at work in the direct environment of a black hole. There, the accretion flow is thought to form an optically thick disk and/or an optically thin corona, while the observed radio jets could originate from the same area (see e.g.the review by Done, Gierliński & Kubota 2007). The high energy radiation provides insights on the physical processes at work in this region. Thanks to its persistent high flux ( 1 Crab) and usually hard spectrum, Cygnus X-1 is easy to observe and there are numerous measurements of its the spectrum and variability in the X-rays. At higher energies however, the results are very scarce. Very few instruments were able to explore the properties of the emission above 200 keV.
The high energy emission of Cyg X-1 is relatively well known from soft X-rays up to a few hundreds keV. The shape of the spectrum is variable and can change dramatically on time scales as short as a day. There are however two main, relatively stable, spectral states: the Hard State (HS, corona dominated) and the Soft State (SS, disk dominated). Their description can be found in various papers (see for example Liang & Nolan 1984; Gierlinski et al., 1997, 1999). So far, the MeV region of the spectrum was best explored by the Compton Gamma-ray Observatory (CGRO). McConnell et al (2002) have shown that, even though the HS hard X-ray emission is dominated by a thermal Comptonization component, both HS and SS spectra present a non thermal powerlaw component extending above 1 MeV with a slope of 2.6 in the SS and 3 in the HS. Moreover, broad features around 1 MeV have been observed in several occasions in the past (see for example, Bassani et al. 1989 and references therein).
Since CGRO observatory however, only the INTEGRAL mission contains instrument exploring
the same energy domain.
Recently, Laurent et al. (2011), stacked all the INTEGRAL/IBIS data available for
Cygnus X-1 and detected the presence of a non-thermal power law component between 400 keV
and 2 MeV. Interestingly they found that contrary to the thermal Comptonization component
present below 400 keV, the non-thermal power-law emission appears to be strongly polarized.
This non-thermal component appears to have a flux that is stronger than that
measured by CGRO by a factor 5-10 and a much harder spectral slope .
Here, we use another INTEGRAL instrument operating in this energy range,
the spectrometer SPI, to investigate
the high energy spectral shape of Cyg X-1 and test
the presence of non-thermal high energy excess.
Our first goal is to take advantage of the sensitivity achieved with the SPI detector
and the large amount of data and perform a detailed analysis
of the energy extent of the hard X-ray emission together with its spectral variability.
Moreover, the spectroscopic capability of the Germanium crystals allow us to seek for
the presence of spectral features linked to the annihilation process.
Hereafter, we present briefly the instrument, data set and the method followed for the analysis. Then, we report on our results and start by examining the total mean spectrum to determine the emission above a few hundreds of keV, where scarcity of photons imposes exposure as long as possible. In a second step, we analyse the source behavior during individual revolutions, and build several averaged spectra, following some hardness criteria which can be considered as characteristic of the spectral state of the source. We conclude with a comparison with previous results.
2. Instrument, observations and data analysis
SPI is a spectrometer aboard the INTEGRAL observatory operating between 20 kev and 8 MeV.
The description of the instrument
and its performance can be found in Vedrenne et al. (2003) and Roques et al. (2003).
The main features of interest for our study are a large FoV () with an
angular resolution of (FWHM) based on a coded aperture mask.
The Germanium camera, beyond an excellent
spectroscopic capability, offers a good sensitivity
over more than 2 decades in energy with a unique instrument. It is surrounded by
a 5-cm thick BGO shield (ACS, Anti-Coincidence Shield) which measures
the particle flux. This latter can be used as a good tracers of the background level.
During a 3-day orbit, the usual dithering strategy (Jensen et al., 2003) consists of a hundred of 30-40 min exposures
(also called scw for ’science window’),
with a given region scanned by steps following pre-determined patterns.
The recommended pattern for SPI observations is a grid of 5X5 around the chosen target.
Unfortunately, in order to content more proposers, except a few exceptions, most of the
Cyg X-1 data has been obtained through ’amalgamated’ observations, ie with the
pattern center somewhere between Cyg X-1 and Cyg A region. As a consequence,
Cyg X-1 appears only in one side of the FoV, reducing the mean efficient area
(the source is partially coded), with some interruptions in the
observation sequences, when the source goes out from the field of view.
For our analysis, we have selected in the whole INTEGRAL observation plan, those revolutions
in which Cyg X-1
is included in the FoV during more than 20 scw (50 ks).
This gives a total of 42 revolutions. These observations encompass
4 Ms of effective time, from 2003, June to 2009 December. They were
grouped together according to temporal proximity into 13 periods.
Exposures with high background level (entry/exit of radiation belts, solar activity) or large source off-angle
(source/pointing axis angle beyond 13∘) have been removed from our dataset.
Table 1 gives some details about the observation pattern, beginning, end and useful duration, for each
of the defined periods.
We follow the analysis method described in Jourdain & Roques (2009),
based on a sky model fitting, through a minimization.
This methods makes use of the Pulse Shape Discrimination (PSD) system, a second electronic chain operating in parallel,
to eliminate spurious events occurring in the MeV region. In the 650 keV-2.2 MeV energy range, we use only the PSD tagged
events, while below 650 keV, all the single events are analysed. This procedure has
been validated with the Crab Nebula observations.
In this work, we consider a common sky model for all the observations,
which consists in 4 sources, namely: Cyg X-1, Cyg X-3, EXO2023+375 and GRS1915+105.
To keep the number of degrees of freedom to a minimum, we consider that the three latter have a constant flux over
the revolution timescale. For Cyg X-1, we consider a variability timescale of 1 scw ( 2 ks)
for the lightcurve and hardness ratio studies, while the spectra have been built
assuming a constant source flux during each revolution.
The background determination relies on empty field observations. Because of detector failures,
it is important to use proper empty fields for each configuration. Once the uniformity map
of the detector plan is fixed, we allow its normalisation to vary on a timescale of 10-20 ks.
The incident photon spectra have been deconvolved and fitted
through the spectral fitting procedure from xspec 11 (Arnaud 1996).
Due to some uncertainties on the energy response in the lowest channels and threshold effects,
we exclude the first channels ( 23.5 keV) from the fit process.
The spectra presented contain thus 41 (more or less logarithmic) channels between
23.5 keV and 2.2 MeV. Note that there are two strong narrow background lines
(10 to 40 times higher than the continuum emission) at 139 and 198 keV. We use very narrow
channels around these energies to isolate the line emission and prevent contamination
of the neighbouring channels. They may appear
as offset data points with large error bars in the spectra.
3. Study of the spectral shape
3.1. The total mean spectrum
The total mean spectrum gathers the whole set of available clean data (4 Ms of observation
distributed over more than 6 years).
It has been built by extracting one spectrum per revolution then summing them.
Due to the impressive signal to noise ratio at low energy, we are unable to ensure that
the response matrices are known with a sufficient precision. We have thus added 0.5%
of systematic errors to the data during the fit procedure.
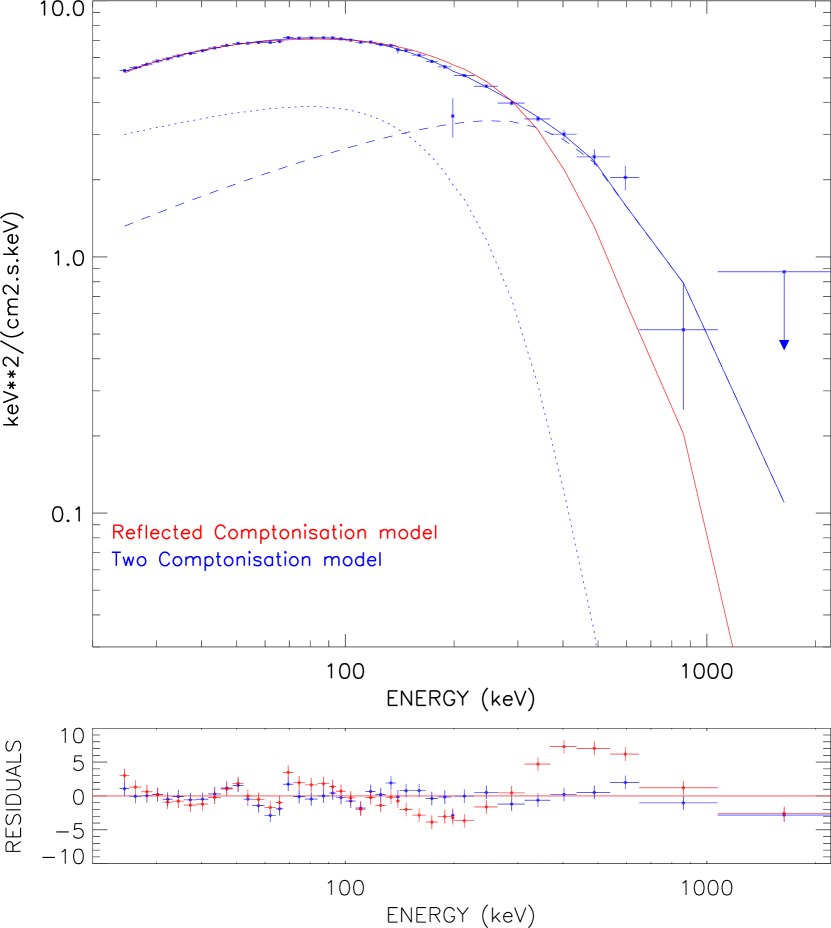
The data have been first fitted with a simple analytical cutoff power law and
a Comptonization + reflection model (reflect*comptt in xspec).
Residuals clearly show deviation from these models above 200-300 keV where an excess of emission appears
above the model prediction. To go further, we keep a Comptonization
law (+ its reflected component) in the low energy part and focus on the high energy emission.
Following Laurent et al. (2011), we first try to model this additional component by a single
power law. The fit converges toward a photon index of (close to the 1.6 0.2 value
reported by these authors) but the value
remains unacceptable, with a huge contribution of the last channels.
Indeed, the high energy part doesnot follow such a power-law : instead,
the emission presents a rather sharp decrease after 700 keV and the source is not detected
above 1 MeV.
A better result is obtained when modeling this high energy component by a second Comptonization
region with a temperature around 100 keV. As several couples (kT, ) can reproduce the data,
we fixed to 0.5 and obtained a best fit value of kT=123 keV (see Table 2).
Fig. 1 presents the observed spectrum with one and two Comptonization models.
Even though the set of parameters proposed in Table 2 is only a possible solution,
the two Comptonization model provides a good description of the data and
more specifically of the curvature observed up to 1 MeV.
3.2. Flux, hardness and hardness versus flux evolution
The MeV emission may depend on the source spectral state or intensity. To follow potential changes in the source emission, we have
analysed in details each revolution and used the information to group observations corresponding
to similar states.
Fig. 2 displays the temporal evolution of Cyg X-1 in 30-70 keV energy range,
with the fluxes averaged by revolution (100-200 ks timescale) and
Fig. 3 the evolution of the hardness
(defined in the 30-120 keV range by ).
In Fig. 4 and Fig. 5, we present the same flux and hardness but detailed
on time scales of a few days (with a resolution of one scw ie 2000 s).
These graphs illustrate clearly the variability of the source.
The hypothesis of constant flux has been tested by tests and is strongly rejected
for all periods (reduced always greater than 5.9 for a number of degrees of
freedom ranging from 100 to 300). The variability appears to be chaotic but in
both cases over a limited amplitude: the source is always detected and varies by a
factor not greater than 3. We can recognize the usual temporal behavior of Cyg X-1
(see e.g. Ling et al. 1987 and Zdziarski et al. 2002). Note that the first period, which corresponds the lowest and softest state in our sample, has been analysed by Malzac et al. (2006). They identified the (rather unusal) source behavior as a mini or failed transition between soft and hard state, in a so called ”intermediate state”. However, no robust (that is, lasting more than a few hours) incursion in the soft state can be reported during our observations and we conclude that Cyg X-1 was always in a hard (LH) or intermediate states.
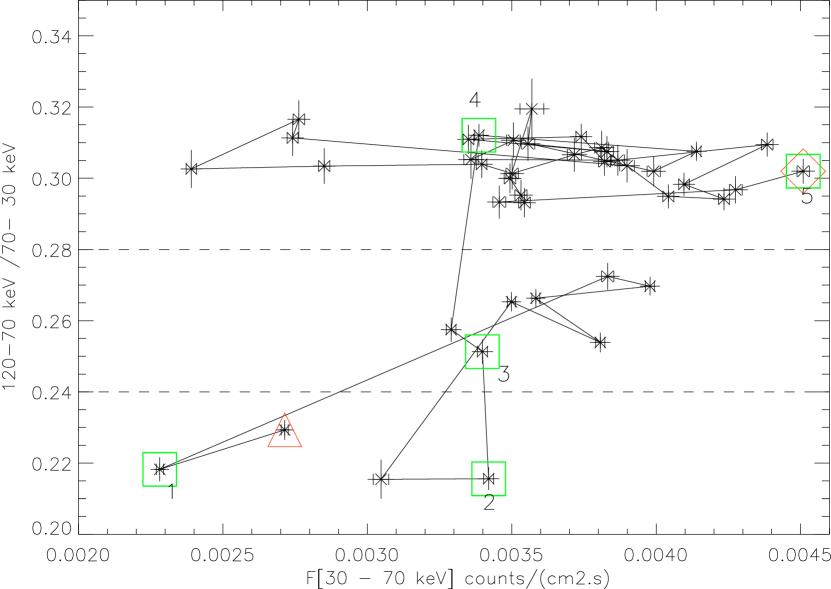
Fig. 6 displays the hardness as a function of the 30-70 keV source flux
(revolution averaged values). The hardness intensity plane can be divided in
three regions corresponding to the main clusters of data points. Those three
regions are outlined in Fig. 6. The first two regions gather
the points with hardnesses respectively
below 0.24 and between 0.24 and 0.28, and, incidentally, correspond to the first part
of the INTEGRAL mission
(revolutions 79 to 261 ie June 2003 - November 2004).
In the third group, the flux levels span a broader range, extending toward higher values,
but the mean hardnesses never decrease below 0.29. During this period,
which covers more than 3 years (mid 2006 up to end of 2009), the source evolution consists of
an intensity variation within a factor
of 2 without any visible change in the emission hardness (or spectral shape),
so without notable change in the underlying processes. This behavior has already been
observed in this source and is well known in transient sources.
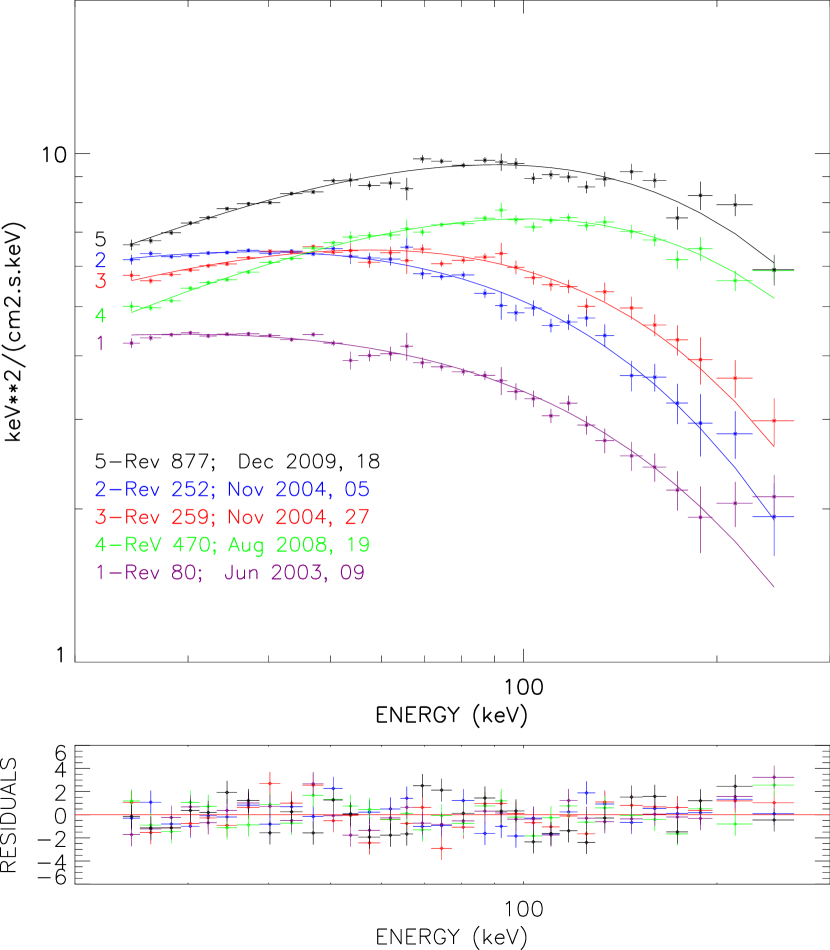
Conversely, it is worth noting that different spectral shapes are observed for an unchanged intensity level in the 30-70 keV band. To illustrate both of these effects, we have superimposed in Fig. 7, five spectra representative of the global course followed by the source in Fig. 6 (the corresponding revolutions are identified in this figure by squares, numbered from 1 to 5).
We recognize the two modes of evolution already identified for this source on the ks timescale (Malzac et al 2006): a pivoting of the spectral shape (spectra 2-4) and a change of luminosity at constant hardness (spectra 1 & 2 and 4 & 5). Note however, that the pivot energy is here at 45 keV (in the middle of the studied energy band, by construction). It could be attributed to an increase of both temperature and optical depth of the Comptonising medium. When combined, the two variability modes give rise to a global complex behavior in the hard X-ray domain, although the source remains in the HS (and intermediate states).
To study in more details the spectral shape and its evolution in the high energy part, we have to accumulate data corresponding to the same hardness.
3.3. Comparison of different averaged spectra
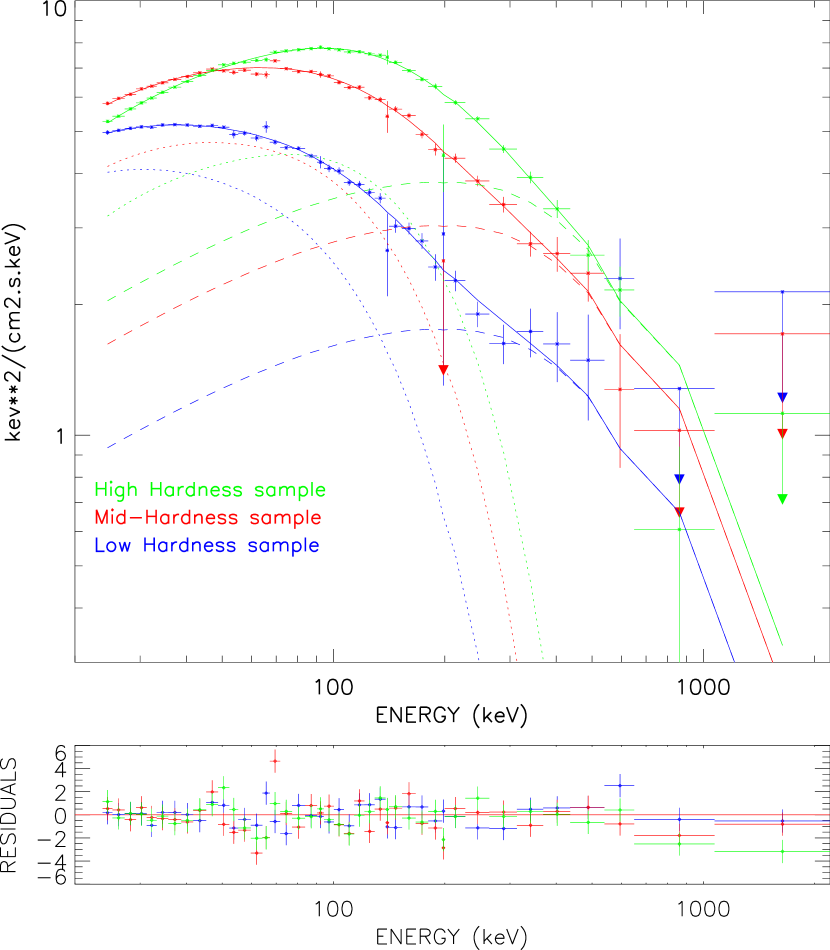
Based on the three hardness levels repered in Fig. 6, we have
built the corresponding averaged spectra, hereafter refered to as ’low hardness’, ’mid hardness’
and ’high hardness’ samples, respectively. They are displayed on Fig. 8,
while best fit parameters are given in Table 3. Similarly to the total spectrum,
the data are modeled by a Comptonization law plus its reflection component
(required when looking at residuals) and a second hotter Comptonization.
The evolution of the slope in the low energy part (in direct relation with the hardness)
is clear, with an increase of the peak energy from 50 keV to 150 keV.
This behavior is not related to the reflection component but appears as
an evolution of the macroscopic parameters (kT and ) of the Comptonizing medium,
which both increase from the soft to the hard sample (see Table 3).
Looking now to the high energy part, no significant emission is detected above
700 keV. A degeneracy between parameters being unavoidable,
we choose to fix the second Comptonizing medium temperature and optical depth to 130 keV and 0.6
respectively for all spectra, but free normalisation factors.
Even though it represents only a possible description of our data,
this model, involving a second (hotter and thiner) Comptonization
medium with constant parameters and , provides an acceptable interpretation
of the Cyg X-1 behavior in the hard X-ray domain.
Even if other models could reproduce the data, such two Comptonizing regions
(or more generally, variable and/or ) scenario resembles those already applied
in previous works to Cyg X-1 and several BHBs (see for example the Suzaku observations
analysed by Makishima et al, 2008, and references therein).
Beyond the specific sets of best fit parameter formally obtained, the inadequacy
of the single comptonization region suggests spatial and/or rapid temporal
variation of the temperature or optical depth of the Comptonization region.
4. Annihilation feature
Cygnus X-1 is one of the brightest Galactic sources of hard X-rays up to several
hundreds of keV and is therefore a good candidate for positron production.
The excellent energy resolution of the SPI germanium detector makes it the best instrument to
seek for potential annihilation signatures in the observed emission.
We have thus looked for any emission feature, narrow (10 keV FWHM) or broad (80 keV FWHM),
transient (scw ie 2 ks timescale) or more persistent (revolution ie 1-2 day timescale).
On the scw timescale, no significant emission is reported with 2 upper limits of
2-3 ph cm-2 s-1 and 0.5-1 ph cm-2 s-1 for a narrow and broad line,
respectively. On the revolution timescale, no significant excess above
the continuum contribution are found, with upper limits ranging between
3-6 ph cm-2 s-1 and 0.7-1.1 ph cm-2 s-1 according to the revolution duration.
Finally, considering the whole set of data (4 Ms), persistent emission features,
if any, should be below 6 ph cm-2 s-1 and 1.3 ph cm-2 s-1.
5. Comparison with other instruments
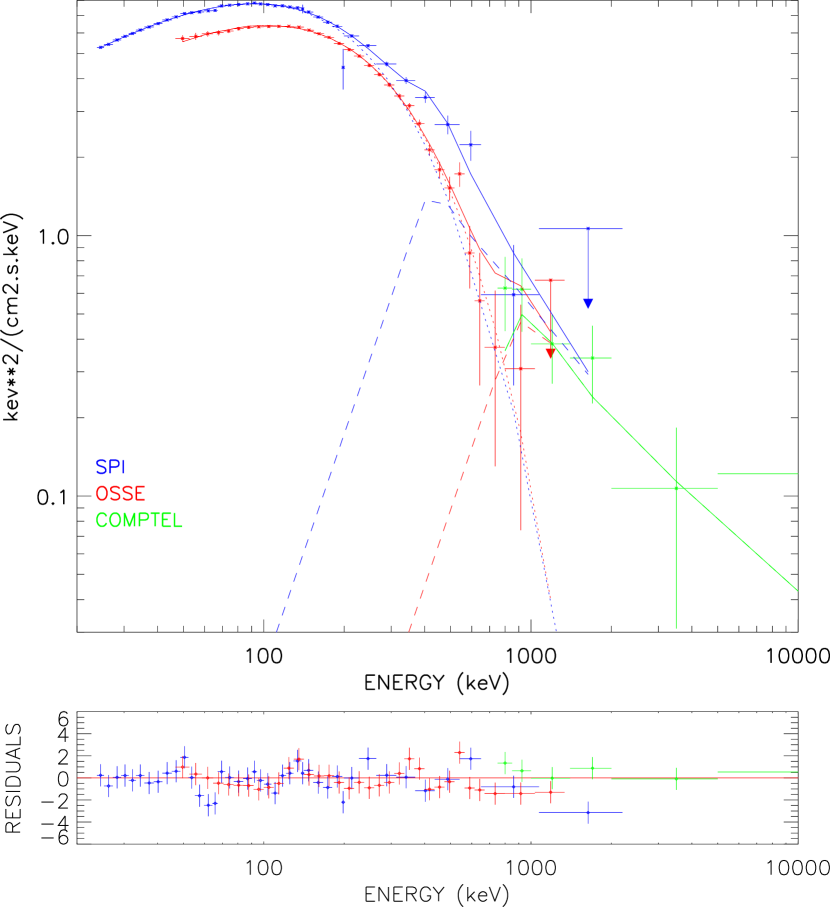
We now compare our observations with the available data in the MeV region. From Fig. 9, we can see that our ”high hardness sample” observations has a spectral shape that is very close to that of the HS mean spectrum reported by McConnell et al. (2002) from GRO/ COMPTEL and OSSE instruments.
To compare the whole set of data (INTEGRAL/SPI + CGRO/Comptel+OSSE), we use a model consisting in a cutoff power
law plus a broken power-law with the first index fixed to -1 ( to avoid any contribution
in the low energy part).
Imposing the same photon index for the cutoff power-laws, the fit
procedure converges toward slightly different cutoff energies ( 140 and 160 keV,
for SPI and OSSE data
respectively, no contribution in COMPTEL range).
We also impose a common second photon index in the broken power law
and obtained 3.4 0.5, while the energy break reflects the true difference between the spectra:
close to 900 ( 100) keV in the CGRO data, it means that this component is based essentially on the
COMPTEL points. Around 420 ( 25) keV in the SPI data, it allows us to
recover the additional emission above the low energy component, the very
soft index limiting its extension toward high energies.
In conclusion, even if the SPI data do not show significant emission above 1 MeV, the upper limits
are marginally consistent with the non-thermal tail observed at several MeV by CGRO/COMPTEL. We note however that this emission is not taken into account by the two-zone thermal
Comptonization model proposed above which would require an additional component to fit the COMPTEL data.
The overall good agreement between the SPI and OSSE spectra indicate that the average spectral
properties in the hard state have remained constant between the two epochs.
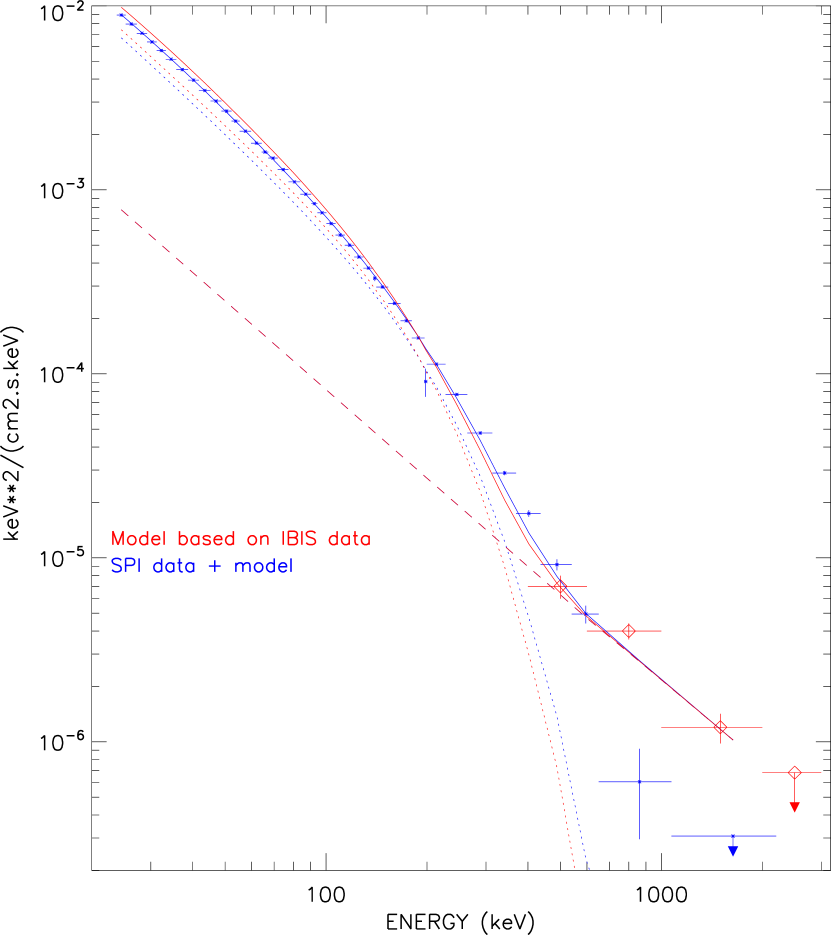
Recently, Laurent et al. (2011) presented a stacked spectrum of Cygnus X-1 obtained using the IBIS data during nearly the same observation period as ours. IBIS is composed of two position sensitive detector layers ISGRI (CdTe, 15-1000 keV; Lebrun et al. 2003), and PICsIT (CsI, 200 keV-10 MeV; Labanti et al. 2003). These two detectors are usually used independently to produce spectra and light curves. Laurent et al. (2011) used the IBIS/ISGRI data up to 400 keV and IBIS/PICsiT at higher energies. Fig. 10 compares our averaged SPI spectra with the results of Laurent et al. 2011. We note that most of the published results from IBIS actually use only the ISGRI detector. With the recent versions of the public software, the results from IBIS/ISGRI are generally compatible with those of SPI. This good agreement is confirmed by our comparison of the stacked SPI and IBIS/ISGRI spectra. At higher energies however, the results are clearly different: the SPI fluxes are lower than the IBIS/PICsiT points by a factor of about 5 at least. The origin of this disagreement is unclear. We were not able to go further in the analysis of the discrepancy as there are very few published results from IBIS/PICsiT.
6. Summary and Conclusions
We used 4 Ms of INTEGRAL SPI data to study the emission of Cyg X-1 from 20 keV to the MeV region. While the source has been essentially detected in the HS, its presents complex variability on all timescales. We have studied the luminosity and hardness evolution of the source above 20 keV, on the scw (2000 s) and revolution (1-2 days) timescales. The revolution averaged data give a nice picture of the long term source behavior. A change by a factor of 2-3 in luminosity can be accompanied either by a significant softening in the 20-150 keV domain (see Fig. 8) or by the same spectral shape just moved up and down.
Then, in order to improve the photon statistics at high energies we combined observations to produce long exposure time average spectra. The analysis of the stacked spectra reveals that the emission of Cyg X-1 extends up to 700 keV
but presents a sharp cutoff around that energy. Whatever the criterion we used to
built averaged spectra (low/mid/high hardness, low/high intensity, all data),
no emission can be detected above 1 MeV.
Nevertheless, a single Comptonization model does not provide a good description of
the overall spectral shape. We have shown that a two temperature model provides a good fit
of the SPI data, with a minimum of free parameters ( and kT of the second Compton component can be considered as constant along the time).
In a final step to investigate the high energy emission, we compare
all the data available above 300 keV for Cyg X-1 in the last 2 decades
and conclude that while our SPI upper limits are marginally
compatible with the soft powerlaw reported by COMPTEL in the 90’ (McConnell et al, 2002),
they clearly disagree (lower by a factor 5)
with the recently reported IBIS/PICsiT emission (Laurent et al, 2011).
In other words, the presence of a non-thermal mechanism
participating to the power supply can not be excluded, but
our results contradict the presence of a hard (polarised or not) power law emission.
A last point concerns the potential emission linked to the positron production: No positive detection has been found, in a narrow (10 keV) and broad (80 keV) channel, on 2ks and day timescales, as well as in the total dataset.
The question of the origin and the nature of the hard state high energy emission remains thus of prime interest. Cyg X-1 is clearly the most adequate target to investigate it. Since no mission operating above 300 keV is expected for a while, the only hope is that the INTEGRAL instruments will be able to accumulate a few more Ms of data on this important target to resolve the matter once and for all.
Acknowledgments
The INTEGRAL SPI project has been completed under the responsibility and leadership of CNES. We are grateful to ASI, CEA, CNES, DLR, ESA, INTA, NASA and OSTC for support. We thank A. A. Zdziarski for providing us with GRO/COMPTEL and OSSE data.
References
- (1)
- (2) Bassani, L., Dean, A. J., Di Cocco, G., Perotti, F. and Stephen, J. B., 1989, ApJ, 343, 313
- Done et al. (2007) Done, C., Gierliński, M., & Kubota, A., 2007, A&A Rev., 15, 1
- (4) Gierlinski, M., Zdziarski, A.A., Done C. et al., 1997, MNRAS, 288, 958
- (5) Gierlinski, M., Zdziarski, A.A., Poutanen, J.. et al., 1999, MNRAS, 309, 496
- Jensen (2003) Jensen, P.L., Clausen, K., Cassi, C. et al., 2003, A&A, 411, L7
- (7) Jourdain, E. & Roques, J. P., 2009, ApJ, 704, 17
- (8) Laurent, P., Rodriguez, J., Wilms, J et al., 2011, Science, 332, 438
- Labanti et al. (2003) Labanti, C., Di Cocco, G., Ferro, G., et al., 2003, A&A, 411, L149
- Lebrun et al. (2003) Lebrun, F., Leray, J. P., Lavocat, P., et al., 2003, A&A, 411, L141
- (11) Liang, E. P. and Nolan, P. L., 1984, SSRv, 38, 353
- (12) Ling J.C., Mahoney, W. A., Wheaton W. A. & Jacobson A. S., 1987, ApJ, 321, L117
- (13) Makishima, K., Takahashi, H., Yamada, S. et al., 2008, PASJ, 60, 585
- (14) Malzac, J., Petrucci, P.O., Jourdain, E. et al., 2006, A&A, 448, 1125
- (15) McConnell, M. L., Zdziarski, A. A., Bennett, K. et al., 2002, ApJ, 572, 984
- Roques (2003) Roques J.P., Schanne S., Von Kienlin A., et al, 2003, A&A, 411, L91
- Vedrenne (2003) Vedrenne, G., Roques, J.P., Schonfelder, V. et al, 2003, A&A, 411, L63
- (18) Zdziarski, A. A., Poutanen, J., Paciesas, W. S. and Wen L., 2002, ApJ, 578, 357
| revol | Start | End | useful |
|---|---|---|---|
| number | duration (ks) | ||
| 79-80 (5x5) | 2003-06-07 00:59 | 2003-06-12 03:35 | 293 |
| 210-214 (A) | 2004-07-03 00:01 | 2004-07-17 00:25 | 709 |
| 251-252 (A) | 2004-11-03 14:23 | 2004-11-07 16:26 | 176 |
| 259 & 261 (H) | 2004-11-26 12:28 | 2004-12-03 15:43 | 143 |
| 470 (EXO, H) | 2006-08-19 09:19 | 2006-08-21 16:02 | 159 |
| 486 (EXO, H) | 2006-10-06 00:11 | 2006-10-08 07:55 | 160 |
| 498-505 (GP) | 2006-11-11 19:31 | 2006-12-04 06:20 | 535 |
| 628-631 (A) | 2007-12-04 19:05 | 2007-12-15 21:08 | 388 |
| 673 (A) | 2008-04-18 17:41 | 2008-04-19 22:09 | 54 |
| 682-684 (A) | 2008-05-14 08:13 | 2008-05-22 19:54 | 304 |
| 739-746 (A) | 2008-11-01 02:14 | 2008-11-24 05:25 | 551 |
| 803-806 (A) | 2009-05-11 08:27 | 2009-05-22 11:32 | 371 |
| 875(H*) & 877(H) | 2009-12-12 16:18 | 2009-12-19 20:57 | 160 |
Note. — In the first column, the letter after the revolution number indicates the dithering strategy used: (5x5) for the standart 5X5 pattern (see section 2); (A) for a pointing strategy centered between Cyg X-1 and Cyg A region; (H) for the hexagonal pattern and (GP) for a Galactic Plane scan. (H*) During the rev 875, the pointing strategy follows a pattern proposed by Wilms et al in their AO-7 proposal. All this information is available on the dedicated ESA site web http://integral.esa.int/isocweb.
| Model | kT | or | ||||
|---|---|---|---|---|---|---|
| keV | keV | (DoF) | ||||
| Refl*Comptt | 0.90 0.3 | 75.0 3 | 0.91 0.03 | 6.0 (37) | ||
| Refl*Comptt + power law | 0.88 0.3 | 56 3 | 1.2 0.1 | 1.8 0.2 | 5.1 (35) | |
| Refl*Comptt+Comptt | 0.8 (fixed) | 38 3 | 1.6 0.15 | 123 10 | 0.5 (fixed) | 1.7 (36) |
Note. — Parameters obtained for the mean Cyg X-1 spectrum (all publicly available observations corresponding to 4 Ms of useful duration). 0.5% of systematic have been added to the data. Two parameters have been fixed in the second model to overcome some degeneracy.
| Sample/Model | kT | ||||||
|---|---|---|---|---|---|---|---|
| keV | keV | ||||||
| Low hardness sample | 0.55 0.25 | 33 3 | 1.2 0.1 | 130 (fix) | 0.6 (fix) | 0.99 (36) | |
| Mid hardness sample | 0.73 0.15 | 36 3 | 1.4 0.2 | 130 (fix) | 0.6 (fix) | 2.13 (36) | |
| High hardness sample | 0.68 0.15 | 40 3 | 1.6 0.1 | 130 (fix) | 0.6 (fix) | 1.4 (36) |
Note. — Best fit parameters for the three mean Cyg X-1 spectra (grouped by same hardness). The model consists in two Comptonization components, the second one with fixed parameters (except normalisation). 0.5% of systematic have been added to the data.