Measurement of the Drell–Yan differential cross section at 7 TeV
Abstract
The Drell–Yan differential cross section is measured in collisions at , from a data sample collected with the CMS detector at the LHC, corresponding to an integrated luminosity of . The cross section measurement, normalized to the measured cross section in the Z region, is reported for both the dimuon and dielectron channels in the dilepton invariant mass range 15–600 GeV. The normalized cross section values are quoted both in the full phase space and within the detector acceptance. The effect of final state radiation is also identified. The results are found to agree with theoretical predictions.
I Introduction
The production of lepton pairs in hadron-hadron collisions via the Drell–Yan (DY) process is described in the standard model (SM) by the -channel exchange of . Theoretical calculations of the differential cross section , where is the dilepton invariant mass, are well established up to next-to-next-to-leading order (NNLO) DY-theory ; DYNNLO ; DYNNLO1 . Therefore, comparisons between calculations and precise experimental measurements provide stringent tests of perturbative quantum chromodynamics (QCD) and significant constraints on the evaluation of the parton distribution functions (PDFs). Furthermore, the production of DY lepton pairs constitutes a major source of background for top quark pair and diboson measurements, as well as for searches for new physics, such as production of high mass dilepton resonances.
Here we present a measurement of the differential DY cross section in proton-proton collisions at , based on dimuon and dielectron data samples collected in 2010 by the Compact Muon Solenoid (CMS) experiment at the Large Hadron Collider (LHC), corresponding to an integrated luminosity of . The results are given for the dilepton invariant mass range . In the analysis presented, the cross sections are calculated as
| (1) |
where is the unfolded background-subtracted yield, corrected for detector resolution. The values of the acceptance and the efficiency are estimated from simulation, while is a factor that accounts for differences in the detection efficiency between data and simulation. Knowledge of the integrated luminosity is not required for the measurements described in this paper, since the cross sections are normalized to the Z region ( ). The measurements are described in detail in Ref. DY_CMS .
II The CMS Detector
A detailed description of the CMS detector and its performance can be found in Ref. ref:CMS . The central feature of the CMS apparatus is a superconducting solenoid 13 m in length and 6 m in diameter, which provides an axial magnetic field of 3.8 T. Within the field volume are the silicon pixel and strip tracker, the crystal electromagnetic calorimeter (ECAL), and the brass/scintillator hadron calorimeter (HCAL). Charged particle trajectories are measured by the tracker, covering the full azimuthal angle and pseudorapidity interval , where the pseudorapidity is defined as , with being the polar angle of the trajectory of the particle with respect to the counterclockwise beam direction. Muons are measured in the pseudorapidity range .
III Event Selection
The analysis presented in this paper is based on dilepton data samples selected by inclusive single-lepton triggers with thresholds ranging between 9 and 15 for muons and between 15 and 17 for electrons, depending on the beam conditions.
Muons are required to pass the standard CMS muon identification and quality criteria, based on the number of hits found in the tracker, the response of the muon chambers, and a set of matching criteria between the muon track parameters as determined by the inner tracker section of the detector and as measured in the muon chambers tag-and-probe ; ref:CRAFT . Cosmic-ray muons are further suppressed by requirements on the proximity to the interaction region and the opening angle between the two reconstructed muons. The two muons are fitted to a common vertex reducing the contamination from QCD related events. Finally, an isolation requirement is imposed on each muon, based on the relative transverse energy deposited in the HCAL and transverse momenta of tracks around each of the muons.
Electron reconstruction starts from clusters of energy deposited in the ECAL, and associates with them hits in the CMS tracker EGMPAS . Energy-scale corrections are applied to individual electrons as described in Ref. WAsymmetry . The electron candidate is required to be consistent with a particle originating from the primary vertex in the event. Electron identification criteria based on shower shape and track-cluster matching are applied to the reconstructed candidates. Electrons originating from photon conversions are rejected by eliminating those electrons for which a partner track consistent with a conversion hypothesis is found, and requiring no missing hits in the pixel detector, as discussed in Ref. ZCrossSection . Isolation requirements are imposed on each electron, based on the relative transverse energy deposited in the ECAL and the HCAL and transverse momenta of tracks around each of the muons.
Muons must be reconstructed with and but at least one of them is required to be with and in order to ensure effective triggering of the event. Electrons must be reconstructed in the ECAL barrel with or in the ECAL endcaps with . The leading electron is required to have providing it triggered the event, while the second electron must have .
Event samples for simulation studies of electroweak processes involving W and Z production are produced with the NLO MC generator POWHEG Alioli:2008gx ; Nason:2004rx ; Frixione:2007vw interfaced with the PYTHIA (v. 6.422) Sjostrand:2006za parton-shower event generator, using the CT10 CT10 parametrization of the PDFs. PYTHIA is also used for the FSR simulation. The QCD multijet background is generated with PYTHIA, and background from top quark pairs is simulated using MadGraph (v. 4.4.12) MadGraph and PYTHIA at leading order using the CTEQ 6L PDF set CTEQ for both samples. Generated events are processed through the full GEANT4 GEANT4 detector simulation, trigger emulation, and event reconstruction chain.
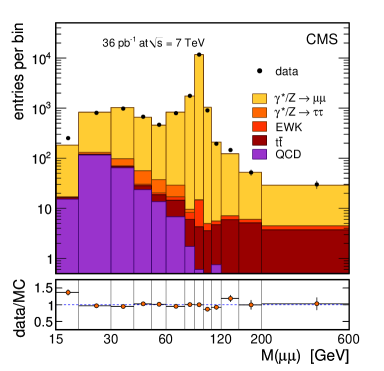
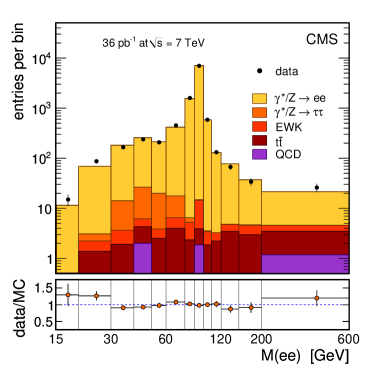
The observed invariant mass distributions, in the dimuon and dielectron channels, are shown in Fig. 1. Thirteen mass bins with unequal widths are used to cover the observable dilepton mass spectrum.
IV Backgrounds
The main backgrounds at high dilepton invariant masses are caused by top quark pairs and diboson production, while at invariant masses below the peak, DY production of pairs becomes the dominant background. At low dimuon invariant masses, most background events are QCD multijet events that originate from both heavy flavor and light quark production. The expected shapes and relative yields of these several dilepton sources can be seen in Fig. 1. They are in agreement with the estimates extracted from data and the significant background sources are estimated from dataDY_CMS .
V Detector Resolution Effects and Unfolding
The effects of the detector resolution on the observed dilepton spectra are corrected through an unfolding procedure. The original invariant mass spectrum is related to the observed one (in the limit of no background) by
| (2) |
where is the event count in a given invariant mass bin . The element of the “response matrix” is the probability that an event with an original invariant mass in the bin is reconstructed with an invariant mass in the bin . The original invariant mass spectrum is obtained by inverting the response matrix and calculating Cowan-unfolding ; Bohm-unfolding
| (3) |
This procedure is sufficient in the analysis reported in this paper because the response matrix is nonsingular and nearly diagonal. Two extra dilepton invariant mass bins are included in the unfolding procedure, to account for events observed with or .
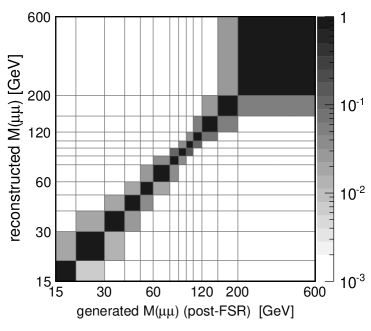
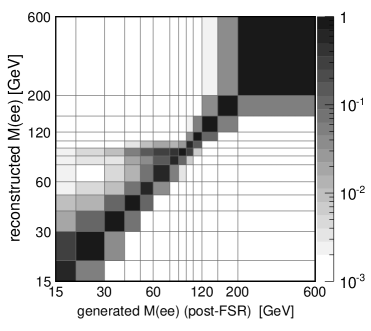
The response matrix is calculated using the simulated sample of DY events, defining the “true mass” as the “generator level” dilepton invariant mass, after FSR. Only the selected events in the sample are used to calculate the response matrix. The loss of events caused by reconstruction inefficiencies or limited acceptance is factored out from the unfolding procedure and taken into account by means of efficiency and acceptance factors in a subsequent step. The response matrices in both lepton channels are invertible and are represented on Fig. 2.
VI Acceptance and Efficiency
The geometrical and kinematic acceptance is defined, using the simulated leptons after the FSR simulation, as , where is the number of generated events and is the corresponding number of events passing the standard and lepton requirements, in each dilepton invariant mass bin.
The efficiency is the fraction of events within the acceptance that pass the full selection, so that
| (4) |
where is the number of events surviving the reconstruction, selection, and identification requirements. The values of the product of acceptance and efficiency are obtained from simulation. A separate correction factor is determined from data and applied to the product, following the procedure used in the inclusive W and Z cross section measurements in CMS ZCrossSection . This factor, the efficiency correction, describes the difference between data and simulation in the efficiency to observe single leptons or dileptons.
The POWHEG simulation combines the next-to-leading-order (NLO) calculations with a parton showering which is insufficient to model fully the low invariant mass region of the dilepton spectra. The two high- leptons required in the analysis must form a small angle at low mass and therefore the dilepton system gets significantly boosted, something to be compensated by hard gluon radiation in the transverse plane. This means that these low-mass events are of the type “ + hard jet” at first order, and therefore the next order of correction (NNLO) becomes essential for a reliable estimate of acceptance corrections. To account for this, a correction is applied, determined from the ratio between the differential cross sections calculated at NNLO with FEWZ FEWZ and at NLO with POWHEG, both before FSR. These correction weights, obtained in bins of dilepton rapidity, , and invariant mass, are applied on an event-by-event basis. This procedure changes the acceptance in the lowest invariant mass bin significantly (by about 50%), but has a small effect, not exceeding 3%, on the rest of the bins.
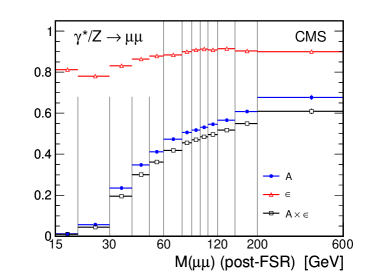
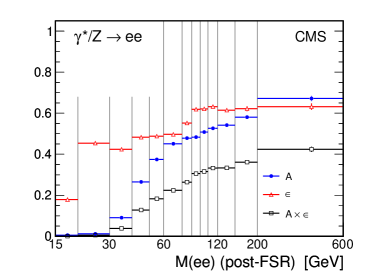
Figure 3 shows the variables , , and as functions of for dimuons (left) and dielectrons (right).
The FSR correction factors for a given invariant mass range are obtained from simulation by dividing the cross sections after FSR by the corresponding quantities before FSR. The factors are channel and invariant mass dependent and are up to few hundred of percent just below the Z peak but 10-20 % or less elsewhere. They are applied on (corrected) data as an additional step. The factors obtained within the detector acceptance and in the full phase space are applied to the corresponding measurements.
The total dimuon event selection efficiency is factorized as
| (5) |
where is the single muon selection efficiency; is the dimuon selection efficiency, which includes the requirement that the two muon tracks be consistent with originating from a common vertex and that they satisfy the angular criteria; and is the efficiency of triggering an event. The single muon efficiency is factorized as
| (6) |
where is the offline track reconstruction efficiency in the tracker detector; is the muon reconstruction and identification efficiency; and is the muon isolation efficiency. The trigger efficiency is given by
| (7) |
where is the efficiency of an offline selected muon to fire the trigger.
The track reconstruction efficiency is very high (). The angular criterion is nearly efficient for signal DY events, and the vertex probability requirement is more than efficient and has a negligible () dependence on .
The muon reconstruction and identification efficiency is estimated using clean samples of muon pairs in the Z peak (tag and probe, T&P, method ZCrossSection ). To determine the isolation efficiency, the Lepton Kinematic Template Cones (LKTC) method tag-and-probe is applied.
To describe the observed efficiency variations between data and simulation, efficiency correction factors are obtained in bins of and as the ratio of the efficiencies measured with data and with the simulated events:
| (8) |
The corrections to the efficiencies in simulation are implemented by reweighting simulated events, with weights computed as where is estimated per muon from Eq. (8) using efficiencies defined in Eq. (6) and . If or for a given muon, its trigger efficiency is set to zero.
The total event efficiency in the dielectron channel analysis is defined as the product of the two single electron efficiencies, which incorporate three factors: 1) the efficiency to reconstruct an electron candidate from an energy deposit in the ECAL; 2) the efficiency for that candidate to pass the selection criteria, including identification, isolation, and conversion rejection; 3) the efficiency for the leading electron to pass the trigger requirements. Each of these efficiencies is obtained from simulation and corrected by , as for the muon channel (Eq. (8)). The T&P method is used for all efficiency components. The event efficiency correction and its uncertainty are derived as for the muon channel by reweighting simulated events.
The overall efficiency correction is up to 10 percent with largest values at lowest invariant masses.
VII Systematic Uncertainties
The acceptance-related uncertainty resulting from the knowledge of the PDFs is estimated using PYTHIA with the CTEQ6.1 PDF set by a reweighting technique Bourilkov:2006cj . It is approximately the same for the dimuon and dielectron channels and is between one and three percent in the whole invariant mass range under study.
The uncertainty of the acceptance is estimated, for each dilepton invariant mass bin, using FEWZ, at NLO and NNLO accuracy in perturbative QCD. Variations of the factorization and renormalization scales lead to a systematic uncertainty smaller than 1% (at NNLO) for most of the invariant mass range used in the analysis presented here.
Since the POWHEG MC (NLO) simulation, modified to match the FEWZ (NNLO) calculations, is used to calculate the acceptance corrections used in the analysis, an additional (model-dependent) systematic uncertainty on the acceptance calculation is determined from the observed differences in acceptances based on FEWZ spectra and POWHEG distributions matched to FEWZ. This systematic uncertainty reaches up to 10% (at lowest invariant masses) in the dilepton invariant mass range considered in the analysis and is included in the comparison between the measurements and the theoretical expectations.
The dominant systematic uncertainty on the cross section measurement in the dimuon channel is the uncertainty on the background estimation. It reaches four percent at very low invariant masses and is also substantial at high masses where the measurement is statistically limited. The next most important uncertainties are related to the muon efficiency and to the muon momentum scale and resolution, directly related to the unfolding procedure. Dimuons from the Z region and the invariant mass shape distribution are used to assess these uncertainties. They are of the order of one percent except in the proximity to the Z peak (2-4 %) and also at very high masses where statistics is poor ( 2%). Comparisons of the FSR spectrum between data and simulation show that potential differences could not affect the cross section measurements by more that 2% and are typically confined within 0.5 %. Remaining systematic effects are within 1% and/or not exeeding the statistical precision of the measurement.
In the electron channel, the leading systematic uncertainty is associated with the couple of percent uncertainty on the energy scale correction of individual electrons. Its effect on the cross section measurement is very significant and reaches tens of percent at very low invariant masses and around the Z peak, it is several percent elsewhere. The second leading uncertainty for electrons is caused by the uncertainty on the efficiency scale factors which is statistically limited. It is close to 10% in the low invariant mass region and few percent in the rest of the spectrum. The dielectron background uncertainties follow the pattern described for muons but are slightly higher at low invariant masses reaching 4–6 %. The resolution effects through the unfolding procedure are smaller than the leading source for each of the invariant mass bins and are typically few percent. Because of significantly higher systematic uncertainty for all mass bins for the electron channel than for the muon channel, the FSR related contribution to the electron channel systematic uncertainty is neglected.
VIII Results
The DY cross section per invariant mass bin , , is calculated according to Eq. (1).
In order to provide a measurement independent of the luminosity uncertainty and to reduce many systematic uncertainties, the is normalized to the cross section in the Z region, , defined as the DY cross section in the invariant mass region . The result of the analysis is presented as the ratio
| (9) |
where is the number of events after the unfolding procedure, and the acceptances , the efficiencies , and the corrections estimated from data, , were defined earlier; , , , and refer to the Z region. For both lepton channels, the cross sections in the Z region measured in this analysis are in excellent agreement with the previous CMS measurement ZCrossSection .
In order to allow a more direct and precise comparison with theory predictions, the shape measured before the acceptance correction is also reported, thus eliminating PDF and theory uncertainties from the experimental results:
| (10) |
The shapes corresponding to the DY process after FSR, and , are modified by the FSR correction factors. to obtain the shapes before FSR, and , respectively. The shapes integrated in the normalization region are equal to one by construction.
The results are presented in Tables 1 and 2, respectively, for the dimuon and dielectron channels. The two shape measurements, shown in the last column of the tables, are in good agreement for 11 out of 13 invariant mass bins and remain statistically consistent (although marginally) for the remaining two bins, 40–50 and 120–150 .
| Invariant mass bin () | ||||||||
|---|---|---|---|---|---|---|---|---|
| 15–20 | 18 | 2 | 19 | 2 | 772 | 67 | 780 | 69 |
| 20–30 | 58 | 3 | 58 | 3 | 528 | 33 | 533 | 34 |
| 30–40 | 67 | 3 | 67 | 3 | 147 | 8 | 147 | 8 |
| 40–50 | 44 | 2 | 41 | 2 | 66 | 4 | 62 | 4 |
| 50–60 | 30 | 2 | 23 | 2 | 37 | 3 | 30 | 2 |
| 60–76 | 51 | 2 | 28 | 1 | 55 | 3 | 32 | 2 |
| 76–86 | 97 | 4 | 56 | 3 | 98 | 5 | 58 | 3 |
| 86–96 | 803 | 14 | 861 | 15 | 799 | 23 | 857 | 26 |
| 96–106 | 38 | 3 | 43 | 3 | 37 | 3 | 41 | 3 |
| 106–120 | 12 | 1 | 12 | 1 | 11 | 1 | 12 | 1 |
| 120–150 | 9.2 | 0.9 | 9.7 | 1.0 | 8.4 | 0.8 | 8.8 | 0.9 |
| 150–200 | 3.1 | 0.6 | 3.2 | 0.7 | 2.6 | 0.5 | 2.7 | 0.6 |
| 200–600 | 1.8 | 0.4 | 1.9 | 0.5 | 1.4 | 0.3 | 1.5 | 0.4 |
| Invariant mass bin () | ||||||||
|---|---|---|---|---|---|---|---|---|
| 15–20 | 6 | 3 | 6 | 3 | 487 | 230 | 508 | 238 |
| 20–30 | 13 | 2 | 13 | 2 | 536 | 96 | 559 | 97 |
| 30–40 | 24 | 4 | 22 | 4 | 129 | 22 | 131 | 21 |
| 40–50 | 28 | 4 | 24 | 4 | 52 | 8 | 47 | 7 |
| 50–60 | 30 | 5 | 19 | 3 | 39 | 6 | 27 | 4 |
| 60–76 | 78 | 12 | 30 | 4 | 84 | 13 | 36 | 5 |
| 76–86 | 144 | 60 | 61 | 25 | 147 | 60 | 64 | 26 |
| 86–96 | 722 | 62 | 839 | 60 | 715 | 62 | 834 | 60 |
| 96–106 | 44 | 21 | 55 | 26 | 43 | 20 | 53 | 25 |
| 106–120 | 13 | 3 | 15 | 3 | 12 | 2 | 14 | 3 |
| 120–150 | 5.4 | 1.2 | 6.0 | 1.3 | 4.8 | 1.1 | 5.4 | 1.2 |
| 150–200 | 2.5 | 0.8 | 2.8 | 0.8 | 2.1 | 0.6 | 2.3 | 0.7 |
| 200–600 | 2.1 | 0.6 | 2.4 | 0.7 | 1.5 | 0.5 | 1.7 | 0.5 |
The results are also normalized to the invariant mass bin widths, , defining
| (11) |
Assuming lepton universality, the dimuon and dielectron results for are combined in a weighted average, using as weights the inverse of the respective squared total uncertainties, where the statistical and systematic uncertainties are added in quadrature.
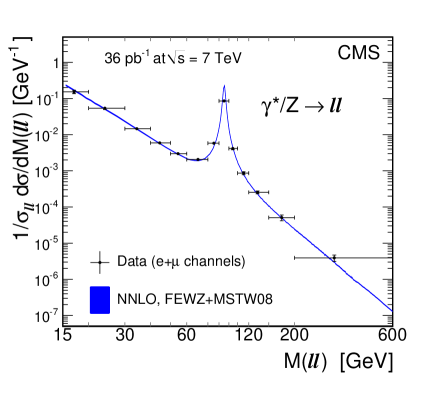
Figure 4 compares the measured (combined) results for the shape with the prediction from the FEWZ NNLO calculations, performed with the MSTW2008 PDF set ref:MSTW2008 . The measurements are very well reproduced by the theoretical calculations.
More details on the measurements can be found in Ref. DY_CMS .
IX Conclusions
The Drell–Yan differential cross section normalized to the cross section in the Z region has been measured in pp collisions at , in the dimuon and dielectron channels in the invariant mass range . The measurement is based on event samples collected by the CMS experiment, corresponding to an integrated luminosity of . Results are presented both inside the detector acceptance and in the full phase space, and the effect of final state QED radiation on the results is reported as well. A correct description of the measurements requires modeling to NNLO for dilepton invariant masses below about 30 . The measurements are in good agreement with the NNLO theoretical predictions, as computed with FEWZ.
Acknowledgements.
We would like to thank the authors of FEWZ and POWHEG for the fruitful discussions, co-operation, and cross-checks in performing the theoretical calculations for our analysis.References
- (1) K. Melnikov and F. Petriello, Phys. Rev. D 74 (2006) 114017.
- (2) S. Catani, L. Cieri, G. Ferrera et al., Phys. Rev. Lett. 103 (2009) 082001.
- (3) S. Catani and M. Grazzini, Phys. Rev. Lett. 98 (2007) 222002.
- (4) CMS Collaboration, arXiv:hep-ex/1108.0566v1. Submitted to JHEP.
- (5) CMS Collaboration, JINST 3 (2008) S08004.
- (6) CMS Collaboration, CMS-PAS-MUO-10-002, (2010).
- (7) CMS Collaboration, JINST 05 (2010) T03022.
- (8) CMS Collaboration, CMS-PAS-EGM-10-004, (2010).
- (9) CMS Collaboration, JHEP 04 (2011) 050.
- (10) CMS Collaboration, arXiv:1107.4789 (2011). Submitted to JHEP.
- (11) S. Alioli, P. Nason, C. Oleari et al., JHEP 07 (2008) 060.
- (12) P. Nason, JHEP 11 (2004) 040.
- (13) S. Frixione, P. Nason, and C. Oleari, JHEP 11 (2007) 070.
- (14) T. Sjostrand, S. Mrenna, and P. Z. Skands, JHEP 05 (2006) 026.
- (15) H. Lai et al., Phys. Rev. D 82 (2010) 074024.
- (16) J. Alwall, P. Demin, S. de Visscher et al., JHEP 09 (2007) 028.
- (17) J. Pumplin et al., JHEP 07 (2002) 012.
- (18) S. Agostinelli et al., Nucl. Instr. and Methods A 506 (2003) 250.
- (19) G. Cowan, ch. 11. Clarendon Press, Oxford, 1998.
- (20) G. Bohm and G. Zech, ch. 9. Verlag Deutsches Elektronen-Synchrotron, Hamburg, 1998.
- (21) R. Gavin, Y. Li, P. Petriello et al., arXiv:hep-ph/1011.3540.
- (22) D. Bourilkov, R. C. Group, arXiv:hep-ph/0605240.
- (23) A. D. Martin et al., Eur. Phys. J. C 63 (2009) 189.
- (24) G. Lafferty and T. Wyatt, Nucl. Instr. and Methods A 355 (1995) 541.