Peculiarities of the superconducting gaps and the electron-boson interaction in TmNi2B2C as seen by point-contact spectroscopy
Abstract
Point-contact (PC) investigations on the title compound in the normal and superconducting (SC) state ( K) are presented. The temperature dependence of the SC gap of TmNi2B2C determined from Andreev-reflection (AR) spectra using the standard single-gap approximation (SGA) deviates from the BCS behavior in displaying a maximum at about . A refined analysis within the two-gap approximation provides evidence for the presence of a second gap twice as large as the main gap (the first one), while the latter is close to that within the SGA. This way, TmNi2B2C expands the number of nickel borocarbide superconductors which exhibit a clear multiband character. Additionally, for the first time ”reentrant” features were found in the AR spectra for some PCs measured in a magnetic field. The PC spectroscopy of the electron-boson interaction in TmNi2B2C in the normal state reveals a pronounced phonon maximum at 9.5 meV and a more smeared one around 15 meV, while at higher energies the PC spectra are almost featureless. Additionally, the most intense peak slightly above 3 meV observed in the PC spectra of TmNi2B2C is presumably caused by crystalline-electric-field (CEF) excitations. The peak near 1 meV detected for some PC spectra is connected with a modification of the CEF probably due to boron or carbon vacancies, allowing to probe the local stoichiometry by PC spectroscopy.
pacs:
73.40.Jn, 74.45.+c, 74.70.DdI Introduction
Compared with the isomorphic nonmagnetic transition metal borocarbides Ni2B2C with =Y, Lu, Sc, La, Th, the rare-earth nickel borocarbide Ni2B2C (here is a rare-earth element) compounds with =Dy, Ho, Er, and Tm are of special interest due to two coexisting and competing ordered states in these systems: antiferromagnetic (AFM) and superconducting (SC), observed by electrical resistivity, specific heat, magnetization, neutron, etc. measurements (see Refs. Muller01 ; Muller02 ; Muller08 ; Gupta06 and Refs. therein). The energy scales of these two states are of similar size, with the SC critical temperature both larger (for = Ho, Er, and Tm) and lower (for =Dy) than the AFM Néel temperature . The SC state here is most probably of the BCS type and mediated by the electron-phonon interaction. The magnetism in these rare-earth compounds is provided by their localized rare-earth ion’s moments which order at relatively high temperatures compared with their dipole-dipole interaction due to the indirect Ruderman-Kittel-Katsuya-Yosida (RKKY) interaction mediated by the itinerant electrons. Moreover, the crystal electric field (CEF) splits the degenerate rare-earth ion states. Thus, CEF effects may influence the formation of the AFM and SC states. For a deepened understanding of Ni2B2C compounds spectral information both on the electronic structure and on the bosonic collective excitations are of importance.
Point-contact (PC) spectroscopy Naid is a unique tool to study simultaneously both the SC gap or order parameter and to provide spectral data as to normal state bosonic excitations (phonons, magnons, CEF excitations etc.) always present in these solids. Measuring the second derivative of the curves for the PC’s, information about the electron-phonon interaction function Kulik and analogously for other bosonic collective interactions in the normal state can be obtained. Also the behavior of the SC gap (i. e. of the order parameter in a more rigorous sense) in the SC state can be determined from the curves using a now routine approach BTK .
In this paper we focus on PC measurements on a rather special member of the rare-earth nickel borocarbide family, TmNi2B2C, which becomes superconducting below 11 K. But only below K does an AFM ordering appear where transversely polarized spin-density waves with an incommensurate modulation of the magnetic moments sets in. Muller01 ; Muller02 ; Muller08 ; Gupta06 Thus TmNi2B2C exhibits the largest difference between and in the whole Ni2B2C series, which points to a relatively weak magnetism which cannot destroy the superconductivity on large Fermi surface sheets (FSS’s), but only weakens it, although sizably, strongly dependent on the purity of the single crystals and as well as on the field direction.Muller01 ; Muller02 ; Muller08 ; Gupta06 The superconductivity is nevertheless affected by the special incommensurate magnetic state and its fluctuation above K, at least for somehow disordered samples (probably with respect to C–B local disorder). In this context the short periodicity of the incommensurate antiferromagnetic structure, 25 Å, as compared with the superconducting coherence length, 125 Å, is of interest gamel and a further argument given there that magnetism and superconductivity affect each other. In the present paper we do not consider the very coexistence of magnetism and superconductivity because this is already outside the range of our experimental setup ( K). For the temperature range above and at least for low external magnetic fields one may also expect to detect remnants of the multiple-gap features well-known for non-magnetic borocarbides. shulga ; BobrovLu ; Bashlakov ; raychaudhuri A clear hint for such a multiple-gap behavior is given by experimentally observed positive curvature pronounced here for the upper critical field applied to the -plane. Due to the large magnetization for to the -axis, is most strongly suppressed and its positive curvature as well. brison
To the best of our knowledge, no PC data concerning TmNi2B2C, are available, except our recent preliminary results. Naid07 ; Naid08 On the contrary, there are several papers devoted to investigation of other members of the nickel borocarbide family (see Refs. naidyuk7 ; Naid07 ; Naid08 and Refs. therein), where the SC gap as well as the electron-phonon spectral function were studied. The peculiar non-monotonic temperature dependence of the upper critical field to the -axis observed frequently cho has been attributed to Pauli paramagnetic effects debeer-schmitt . All this makes investigations of the missing TmNi2B2C by PC spectroscopy desirable in order to get a complete picture. Here we restrict ourselves to a study of the paramagnetic phase above K.
II Experimental details
TmNi2B2C single crystals were grown by the float-zone technique with optical heating. Souptel For homogenization and in order to minimize the amount of possible disorder on the boron and carbon sites, the crystals were wrapped into tantalum foil and subjected to a heat treatment at 1000∘ C for 72 h and subsequently at 500∘C for 72 h under purified argon atmosphere. The residual resistance ratio [RRR =(300 K)/(11 K)] of the investigated crystal significantly increased by this heat treatment: from RRR=14 before heating to RRR=28 after it. The high perfection of the single crystals is confirmed by the small width (about 0.45 ) of neutron diffraction peaks obtained for (103) Bragg reflection. The investigated single crystal had a resistivity of (11 K) = 1.7 cm in the normal state. Its SC transition temperature amounts = 10.6 K, determined from the midpoint value of the SC transition.
The PC spectra have been measured mainly along the direction by a standard ”needle-anvil” method, Naid touching a cleaved TmNi2B2C surface with a sharpened thin Cu wire. A number of PC spectra has been measured perpendicular to the direction, but we have found no qualitative difference between them and the PC spectra along the direction. The reason might be that the cleaved surface was quite irregular and rough, therefore the crystallographic direction in PC is not well defined and the PC spectra are expected to be averaged over a large angle range.
The differential resistance and the second derivatives were recorded through sweeping the current on which a small current was superimposed. The alternating voltage as well as its second harmonic have been recorded using the standard phase sensitive lock-in technique. It is well known that the first derivative of the curve between a normal metal and a superconductor, the so-called Andreev-reflection (AR) spectrum, reflects the SC gap. BTK The second derivative of the curve of the type is directly proportional to the electron-boson spectral function according to the PC spectroscopy theory (see Ref. Naid , chapter 3 and Ref. Kulik ). This derivative can be readily obtained: simply by dividing the measured by , i.e., .
III PC spectroscopy of the SC energy gap
To obtain a spectroscopic insight into the SC energy gap as well as into the spectral function of the electron-boson interaction, the contact size should be smaller than the inelastic electron mean-free path. To avoid a variation of the SC gap on the scale of the PC size, also the contact diameter should be less than the coherence length , which is in TmNi2B2C between 11 and 15 nm. cho ; Eskildsen ; gamel The elastic electronic mean-free path in TmNi2B2C is estimated as about nm, using typical for the nickel borocarbides cm2 (see Ref. Bhat ) and our residual resistivity cm. According to Wexler’s formula Wexler , (here we neglected contribution to the second term from the resistivity of a normal metal (needle) and suppose geometrically equal parts occupied by each metal in the case of heterocontact), the PC diameter can be estimated from their resistance and . Using a typical between 1 and 10 , one estimates a value between 30 nm and 10 nm. Thus, the necessary condition of the smallness of the PC size compared to and may be fulfilled for the investigated PCs. Even more importantly from the experimental or practical point of view is the observation of characteristic AR features in the spectra in the SC state along with the phonon structure in in the normal state, which can be used as criteria for a spectroscopic (ballistic or diffusive Naid ) regime in PC.
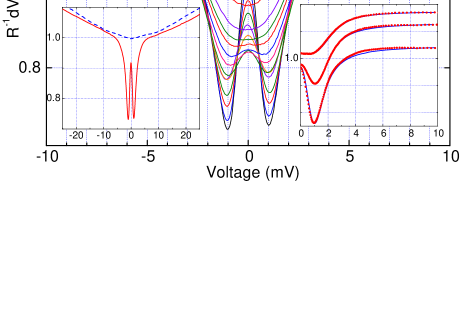
We succeeded in obtaining high-quality PC characteristics as shown in Fig. 1, which demonstrates clear AR features – deep minima around e at , here is the SC gap, and the absence of any other irregularities like spikes, humps, etc. For most PCs, the structure (minimum) which characterizes the SC state disappears at about 10 K, slightly below the mentioned bulk K. The experimental curves were fitted according to the well-known modified BTK theory (see Ref. Naid , section 3.7) within the single gap approximation (SGA). In the inset of Fig. 1, as an example, the calculated / along with the measured ones are shown at several temperatures. From the fitting of experimental at different temperatures, the temperature dependencies of the SC gap , the so-called Dynes or broadening parameter , Dynes78 the barrier strength , and the scaling factor have been determined (see Fig. 2 and Appendix).
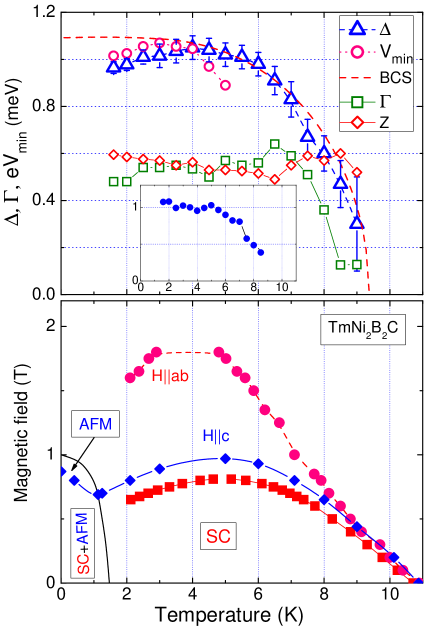
As shown in Fig. 2, and are nearly constant, excluding the region close to . However, in this region above 6 K the double minimum structure in is washed out and the self-action computer procedure gives more room for the fitting parameters by approaching . The most interesting feature is the temperature dependence of the gap . As shown in Fig. 2, deviates from the BCS-type behavior, reaching a maximum not at , but at about K . The majority of investigated PCs reveals a similar behavior for the extracted . Moreover, the minima positions in which at low temperatures should be close to the value also display maximum (see Fig. 2) directly supporting the obtained specific behavior in this temperature region. The upper critical field measured for fields along the direction and within the plane behaves similarly (see Fig. 2), that is, it has a maximum. This broad maximum is closely related to the reentrant behavior found in the temperature dependence of both the bulk resistivity (see inset of Fig. 5) and of the magnetic susceptibility of TmNi2B2C in magnetic field. Obviously, the recovery of the normal state at low temperature in the presence of a sufficiently high applied magnetic field is responsible for the anomalous decrease of at low temperatures. This anomaly might support our finding. In fact, since in the clean limit one has in the orbital approximation (ignoring a possible Pauli limiting behavior mentioned above debeer-schmitt ) , the anomalous decrease of the upper critical field is more pronounced in the gap itself.
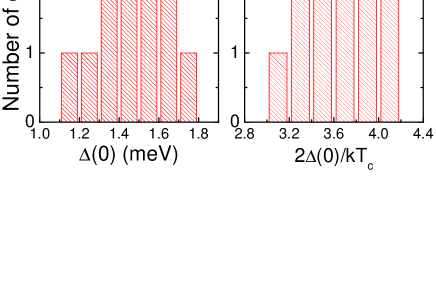
The gap distribution for the selected 14 contacts with pronounced AR minima along with the characteristic ratio k are shown in Fig. 3. The SC gap value (in the SGA extrapolated by the BCS dependence to =0) results in a somewhat wide range meV, which reveals a characteristic ratio k between 3 and 4.2, 333We measured systematically with AR minima position close to 1 mV (see, e. g., Fig. 1), corresponding to k 3, which may be connected with both anisotropy and/or a multiband scenario. See also the further section concerning two-gap calculations. here is the temperature where the AR features for the corresponding contact vanish, in other words, the local . It varies between 9 and 10 K. Then the mean k exceeds the BCS weak coupling value 3.52, which points quite generally to a strongly coupled SC state. Alternatively, it might also reflect simply the local gap anisotropy on a given FSS. In order to explain the nearly isotropic in DyNi2B2C peng ; tomy (see, e.g., Fig. 6 in Ref. jensen ), a somewhat anisotropic electron-phonon interaction and also a corresponding gap anisotropy must be assumed to compensate the different anisotropy of the Fermi velocities of the calculated cushion FSS, which would also affect . A similar enhanced gap ratio is also characteristic for other Ni2B2C compounds Naid07 ; Naid08 measured by AR spectroscopy. The gap distribution in TmNi2B2C might be connected both with the anisotropy and the multiband superconductivity, as suggested by the analysis of the PC data for the nonmagnetic LuNi2B2C, BobrovLu ; Kvit10 YNi2B2C, Bashlakov and the AFM ErNi2B2C Bobrov08 superconductors, or for the well-known two-gap superconductor MgB2. MgB2 On the other hand, existing tunneling spectroscopy data for TmNi2B2C Suderov01 read: meV and k 3.1 with error bars of 15%. Additionally, they did not show a remarkable anisotropy and exhibit a BCS-like weak-coupling temperature dependence of the gap in the whole temperature range, even in the AFM region below 1.2 K.
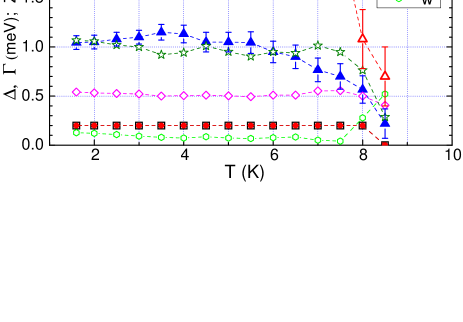
Analyzing in more details our data and the SGA fitting parameters, it turned out that: 1) usually a quite large is needed to fit the curves, 2) the scaling factor S (see Appendix) varies considerably (see, e. g., Fig. 2), 3) there is a wide distribution of the gaps. The large might point to a spatial (or directional) gap distribution due to anisotropy or the multiband character of the SC state, a picture which is now widely accepted in the borocarbide community. Therefore, supposing a multiband SC state we have also carried out a two-gap fit. 444The two-gap(band) approach is supported also by a recent three-dimensional study of the Fermi surface of LuNi2B2C Dugdale09 , where the contributions to the total density-of-states (DOS) at the Fermi energy from three bands equal to 0.24%, 22.64% and 77.1%, respectively, have been found. That is, basically only two bands contribute to the total DOS. In general, this fit is similar to the one-gap fit shown in Fig. 1(right inset), only the two-gap fit is a bit better in the 4–6 mV range for the curves at the lowest temperatures. The results are shown in Fig. 4. First of all we note that 1) is constant and more than two times smaller than that of our SGA fit 555At first glance it seems naturally to suppose a two times larger for the twice as large second gap. However, in this case the contribution of the second gap (or weight factor) strongly varies at low temperature (about 4 times): it decreases from 0.32 to 0.09 with temperature rising from 1.6 K to 4 K. In our opinion there is no physical reason for such behavior. and 2) the scaling factor is close to 1 and varies moderately, except the region close to , where the fit gives more freedom for fitting parameters due to a temperature broadening and smearing of a double-minimum structure of . These two observations suggest that the obtained results of our two-gap fit are physically reasonable. As it is seen from Fig. 4, the small gap exhibits a more or less similar behavior as the gap obtained in the SGA fit, while the second gap is two times larger, but its contribution to the spectra is about 10%, once again excluding the region close to . Thus we found plausible arguments for the presence of a second SC gap in TmNi2B2C. To clarify its nature, detailed directional PC investigations are desirable.
In the end of this section we would like to mention that except YbNi2B2C with heavy-fermion like properties, at first glance the electronic structure as predicted by the first electronic structure calculations based on the local density approximation (LDA) is hardly affected by the rare-earth component directly. Dugdale09 In particular, all these compounds exhibit a special FSS, called in the case of =Lu, Y, Ho and Dy as ”cushion”bergk or ”pillow”drechsler4 which is formed only by Ni 3 states, i. e., without an admixture of rare-earth 5 derived states. The latter mediate the RKKY exchange coupling of the magnetic moments of the 4 electrons to some of the conduction electrons whose superconductivity is then strongly affected by the presence of the localized rare-earth magnetic moments. On the contrary, the superconductivity on the ”cushion” FSS is almost perfectly protected against local magnetic fields caused by the exchange interaction between its conduction electrons and the 4-moments. However, recent band structure calculations for TmNi2B2C show explicitely that some FSS has somewhat changed their shape. In particular, the ”cushion” has not been detected. rosnerprivate By symmetry an analogous Ni- derived FSS free of an admixture with Tm states should nevertheless exist. Since its exact shape has not been resolved yet, we denote it, for the sake of simplicity, as ”pseudo-cushion”(pc)-FSS. On these grounds a similar local SC gap of 1 meV can be expected for that pc-FSS in TmNi2B2C, too. The PC data for the smaller gap reported above (which is less sensitive to the vicinity of magnetism) provide strong support for such an assignment in the title compound, too. The larger second gap reported here, too, with a stronger sensitivity to the vicinity of magnetism corresponds to the major FSS in nonmagnetic borocarbides, which in the present case is somewhat affected by the fluctuations of this AFM state occurring below 1.6 K.
III.1 ”Reentrant” features for characteristics in an external magnetic field
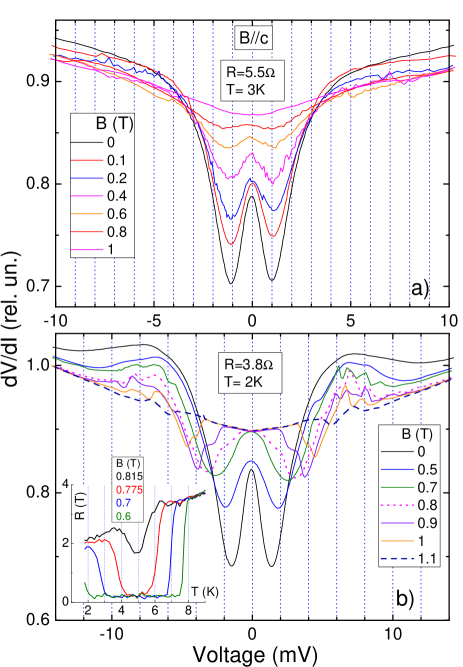
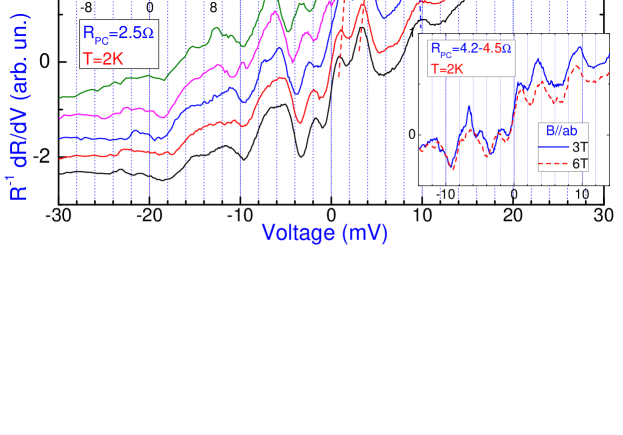
Let us turn to the measurements of in an external magnetic field. By studying the obtained curves one can distinguish two types of behavior. One of them is shown in the upper panel of Fig. 5. Here the external magnetic field does not substantially change the position of the minima (reflecting the SC gap) up to fields of about 1 T. The magnetic field reduces the intensity of the whole minimum and its influence looks like a smearing of the AR minima. A qualitatively similar behavior is observed for most of PCs based on the title compound and on many other superconductors, including nickel borocarbides Bashlakov ; raychaudhuri ; naidyuk7 ; XLu as well as simple SC metals, e. g., Nb Naid96nb . In the meantime the for some studied PCs have demonstrated a quite different behavior, 666The PC spectrum for this contact is shown in Fig. 7. It demonstrates clear CEF and phonon maxima, therefore it is unlikely that specific behavior is connected with a regime in PC that is not spectral (e.g., thermal). In our case humps in around 6 mV are likely connected with critical current or critical (Oersted) field effects. similar to that shown in Fig. 5(b). Here, the double-minimum structure undergoes significant modifications in a magnetic field. Below 0.6 T the d/d curves behave like in the previous case, but at higher field they transform into another structure with a plateau-like maximum at zero bias, so that the zero-bias resistance reaches its normal-state value at 0.7 T and then this normal-state region spreads out to higher voltages by further field increase until all curves transform into a parabolic-like normal-state behavior.
This structure of in Fig. 5(b) looks similar to reentrant behavior found in the temperature dependence of the bulk resistivity of TmNi2B2C in the external magnetic field 777We note, that the reentrant behavior in the magnetic field is not observed for all single crystals (according to unpublished data in Ref. Lamprecht ) and does not occur for very clean samples. Moreover, the critical field can differ by a factor up to 2 even for annealed samples, which can be connected with difficulties to control the stoichiometry and the appropriate site position for boron and carbon., where the normal state is restored at 2 K in a field above 0.7 T (see inset in Fig. 5b). This behavior of the bulk resistivity, i. e., the recovering of the normal state at low temperature under a magnetic field, may be connected with some kind of magnetic ordering induced by the external magnetic field. The temperature increase (e. g., above 2 K at 7 T, see inset in Fig. 5b) destroys this state and recovers the SC state. We assume that in our case the applied voltage plays a role similar to the temperature, namely, a relaxation of strongly nonequilibrium electron distribution function in a PC under an applied voltage Kulik can produce nonequilibrium phonons with an effective temperature eV/4 Kulik1 . Therefore in our case applied voltage increase recovers the SC state (SC features in d/d) in the field above 7 T at 2 K.
This qualitatively different behavior observed in both types of characteristics is consistent with the observation that reentrant behavior of in a magnetic field is not found for all TmNi2B2C single crystals. Lamprecht
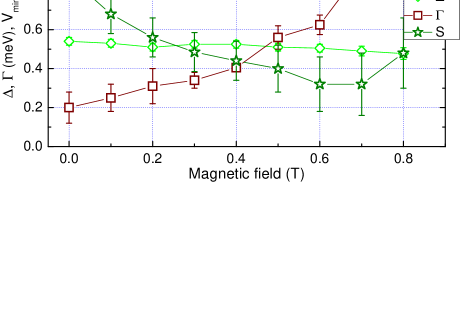
We have also recovered the magnetic field dependence of the SC gap and of the other fitting parameters again in the SGA. The results are shown in Fig. 6 using the spectra from Fig. 5(a). It turned out that the effective single gap is almost magnetic field independent, strictly speaking, it exhibits even a slight increase. This observation is in accord with the minima position in . However, this unusual, absolutely counterintuitive and striking behavior (never observed for any superconductor to the best of our knowledge) might be ascribed to an unresolved anisotropic multigap scenario. In fact, provided the PC reflects also some -geometry, a gap contribution from non-cushion FSS’s with a much higher upper critical field than the depicted highest field of 1 T might readily resolve the puzzle.
steeply increases in an external magnetic field as it has been found for many other type-II superconductors, Naid ; Naid96nb while in type-I superconductors is almost field independent. Naid96 The increase of is usually connected with a shortening of the bosonic (Cooper pairs) life-time due to the pair-breaking effect of an external magnetic field. Tinkham The scaling parameter decreases with the magnetic field. This can be understood as a shrinkage of the SC volume in the PC region, probably due to vortex penetration. However, the determination of the SC gap and other parameters from AR spectra in a magnetic field using the standard BTK approach with the introduction of the SC density of states smearing due to life-time effects Dynes78 only is, in principle, a simplified approach. As mentioned in Ref. Miyoshi , the SC density of states in the mixed state varies in space, i. e., becomes nonuniform. This special situation requires an appropriate theoretical description (not available at present) for the density of states to compute realistic AR spectra. Moreover, the local SC density of states in PC will depend on the position of the pinned vortex with respect to the PC core. Therefore the obtained effective parameters of the homogeneous model and their magnetic field dependence extracted from AR spectra measured in an external magnetic field above the lower critical field should be interpreted with some caution.
IV PC spectroscopy of bosonic excitations in the normal state
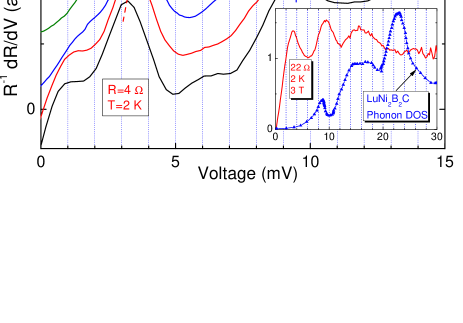
Now we consider the measured PC electron bosonic interaction spectra ( curves) of TmNi2B2C–Cu PCs. These spectra show clear maxima at about 3 mV and 9.5 mV (see Fig. 7) and a more smeared maximum at 15 mV (see inset in Fig. 7 and the following figures). The maxima at about 9.5 mV and 15 mV were not affected by magnetic field and correspond well to the low-energy maxima in the neutron phonon density of states of the nonmagnetic isostructural compound LuNi2B2C Gompf (see Fig. 7, inset), only the high-energy part of the obtained PC spectra remains almost featureless. The displayed in the PC spectra phonon features are similar to those observed in other nickel borocarbide compounds. Bashlakov ; naidyuk7 ; Naid07 ; Yanson97 ; YansonDy ; Kvit10 Thus, the observed peaks reflect the TmNi2B2C phonons excited by the inelastic scattering of electrons (energized by e-bias). Unfortunately, even for the PC with a relatively large resistance (see Fig. 7, inset) for which the conditions for the ballistic (spectroscopic) regime is fulfilled with a larger probability, so far we could not resolve the phonon features above 20 mV, contrary to the case of HoNi2B2C.Naid07 One of the reasons might be that the PC spectrum of TmNi2B2C contains a dominant 3-mV peak, which is connected with CEF excitations as is shown below.
Thus, excitations of Tm ions to the first CEF level by e-energized electrons followed by subsequent scattering on 9.5-mV and 15-mV phonons will lead to a shortening of the inelastic electron mean free path and to deviations from the ballistic (spectroscopic) regime in our PC with further increasing of bias e. This blocks energy-resolved spectroscopy at higher energies.
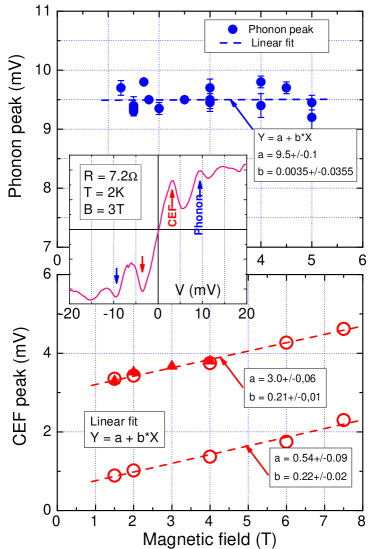
Next we will consider the mentioned low-energy peak near 3 mV, where the peak positions are marked by the tilted dashed line in Fig. 7. It can be assigned with the first excited CEF transition in TmNi2B2C according to Ref.Gasser . As shown in Fig. 8, a magnetic field shifts this maximum to higher energies whereas the maximum at about 9.5 mV remains fixed. This confirms phononic origin of the 9.5-mV maximum. The other CEF transitions at the higher energies mentioned in Ref.Gasser could not be resolved in the PC spectra, probably due to their lower intensity and the mentioned deviation from the spectroscopic regime with the bias increase. Thus, this low-lying first CEF excitation seems to play a dominant role in the transport properties of TmNi2B2C. The presence of such low-energy excitations in TmNi2B2C can be anticipated from the nonsaturated resistivity in this compound by lowering temperature with pronounced slope of until (see Fig. 5(b), inset).
We have also occasionally measured PC spectra with an additional peak at low energy near 1 mV (see Fig. 9). A magnetic field shifts this peak as well as the second peak at about 3 mV (see Fig. 8, bottom panel) to the higher energies, whereas the positions of the phonon maxima near 10 and 17 mV are stable. The 3-mV peak looks like the CEF peak on the previous spectra. The 1-mV peak persists up to the highest fields available in our experiment (7.5 T) exceeding the in the and directions by a factor of four or two, respectively. Such a behavior in a magnetic field excludes any residual superconductivity in our PCs as the origin of this peak 888On the contrary, the hump near 1 mV in at 1.5 and 2 T in Fig. 7 is likely caused by residual superconductivity because this structure disappears at higher fields.. The appearance of this 1 mV peak may testify to the nonstoichiometry of TmNi2B2C in the PC core. In contrast to =Ho, Er compounds, here in the region of C and/or B vacancies or disordered C and B sites the original magnetic Tm-ion ground state doublet splits into two singlet states (see Ref.Gupta06 , page 768). If so, then on the one hand the PC spectroscopy enables us to distinguish the ”fine structures” in the CEF schema of TmNi2B2C, while on the other hand it allows us to control the local stoichiometry. Another possibility is that TmNi2B2C exhibits a quadrupolar ordered phase below =13.5 K Andersen . The consequence of this would be that the quadrupolar ordering lowers the CEF symmetry, resulting in the mentioned ground-state splitting. In this context we note that a weak peak at about of 1 meV has been observed in the inelastic neutron spectra of Tm0.05Y0.95Ni2B2C.Rotter It was ascribed by the authors to a transition derived from a splitted, originally two-fold degenerate Tm-ion ground-state. Thus, we also assume here a similar transition resulting from a modified CEF Tm-ion ground state, either due to nonstoichiometry (vacancies) or due to a quadrupolar ordered phase. To finally elucidate the nature of these peaks, more detailed directional measurements in higher magnetic field with samples of well-defined stoichiometry are required as well.
V Conclusion
We have carried out investigations of the SC gap and of the electron-bosonic interaction spectra in TmNi2B2C by means of AR and PC spectroscopy, respectively. The SC gap in TmNi2B2C is found to deviate considerably from the usual BCS-type behavior in showing a broad maximum at . An improved two-band analysis of our data also shows the presence of a second SC gap being about two times larger than the former, which remains close to the small ”first” gap observed. The smaller gap has been assigned to a FSS which has a similar orbital structure and a gap value as the ”cushion” FSS found in other nickel-based 1221 borocarbide compounds. This not-yet-resolved FSS for TmNi2B2C is almost protected from the exchange interaction with the magnetic moments of the rare-earth ions. The observed second larger gap is only a bit smaller than the larger gap in nonmagnetic borocarbide superconductors. This way TmNi2B2C interpolates between ”cushion”-FSS-dominated almost single-band superconductors DyNi2B2C and HoNi2B2C within the commensurate AFM state and the nonmagnetic borocarbide superconductors YNi2B2C, LuNi2B2C, and probably, also the ScNi2B2C compound which, however, is less well studied.
We succeeded to measure PC electron-bosonic interaction spectra of TmNi2B2C with distinct phonon features at 9.5 mV and 15 meV along with intense low-energy maxima of a nonphonon nature at about 3 meV and additionally at about 1 meV for some spectra. The 3-meV maximum is due to excitation of Tm ions on the upper (first) CEF level by e-energized electrons. As to the 1-meV peak, it is likely connected with a modification of the CEF due to boron or carbon vacancies. This allows, in principle, for the PC spectroscopy to be regarded as a local probe to check the stoichiometry. Intense peaks of CEF excitations in PC spectra point to their significant contribution to the spectral function of the electron-boson interaction.
Acknowledgements
Two of us, Yu. G. N. and O. E. K., thank IFW-Dresden for hospitality and the Alexander von Humboldt Foundation for support. Support by Pakt für Forschung at the IFW-Dresden and the Deutsche Forschung Gemeinschaft as well as the National Academy of Sciences of the Ukraine are gratefully acknowledged. Discussions with H. Rosner, K.-H. Müller, and M. Schneider are kindly acknowledged.
Appendix
As a rule, the parameter is used to describe the nonthermal smearing of the experimental curves, namely, the broadening of the characteristic AR minima in , while the original physical meaning of in the Dynes model Dynes78 as a finite lifetime of charge carriers due to inelastic scattering is usually not under consideration. This is because other effects contribute to the broadening, e. g., as SC gaps distribution Pratap ; Bobrov05 (via nonhomogeneity, surface, multiband, etc. effects) or gap anisotropy (see also §4.3.4 in Ref. Daghero ).
Including in the fit procedure leads not only to the smearing of the whole calculated curve but also results in a reduced intensity of the whole AR (minima) structure. In this context we note, that for a high-quality fit of in full, not only the shape of must be described, but also its absolute intensity must be correct. In the present paper we also address this point, namely, we considered the, so-called, scaling factor , which is included to fit the intensity of calculated and experimental curves. For instance, =1 means that the calculated curve fits the measured also in absolute values. In the case of the ordinary superconductor with a large coherence length like Zn, Naid96 we succeeded in performing such a fit practically for all PCs. If 1, the measured has a reduced intensity due to suppression of the AR signal or the opening of some non-AR channel in the PC conductivity. Thus, the authors of Ref. Bobrov08 assumed that 1 is realized when the Fermi surface is only partially gapped in the SC state. Of course, the more common explanation of non-SC regions in the PC or multicontact scenario, including PCs with suppressed superconductivity, cannot be ruled out as well. Thus, in Ref. Miyoshi a contribution to the conductance from the normal vortex cores in the superconductor was taken into account to describe a progressive suppression of the AR features in an external magnetic field.
It turned out that even a seemingly nonphysical situation with 1 can also take place. As a rule, large values result in large . A more reasonable explanation would be the following: if the smearing of is due to a variation (distribution) of SC gaps over the Fermi surface, then the description of this smearing by including results in a reduced calculated intensity and finally leads to a scaling parameter . Hence such a situation with 1 might point to a gap distribution or to a multiband scenario.
We should also mention that a contribution to the minima may come from the Maxwell resistance, Naid which cannot be ignored for materials with a high residual resistivity like, e. g., the heavy-fermion compounds. Gloos Since the residual resistivity in Ni2B2C compounds is above 1cm, then the Maxwell contribution to can exceed 1 for a PC with a diameter of 10 nm. The vanishing of the Maxwell resistance in the SC state can lead to a situation where the PC resistance (the conductance) can decrease (increase) more than 2 times, thus it exceeds the limit of the maximal AR signal.
References
- (1) K.-H. Müller, V.N. Narozhnyi, Rep. Prog. Phys. 64, 943 (2001).
- (2) K.-H. Müller,G. Fuchs, S.-L. Drechsler and V. N. Narozhnyi, in: ”Magnetic and Superconducting Properties of Rare Earth Borocarbides of the Type Ni2B2C”, Handbook of Magnetic Materials, Ed. by K.H.J. Buschow (Elsevier, North-Holland, 2002), Vol. 14, pp. 199-305.
- (3) K.-H. Müller, M. Schneider, G. Fuchs and S.-L. Drechsler, Handbook on the Physics and Chemistry of Rare Earths, ed. by Karl A. Gschneidner Jr., Jean-Claude Bünzli, and Vitalij K. Pecharsky, (North-Holland, Elsevier, 2008), Vol. 38, p.175.
- (4) L. C. Gupta, Adv. in Physics, 55, 691 (2006).
- (5) Yu. G. Naidyuk and I. K. Yanson, Point-Contact Spectroscopy, Springer Series in Solid-State Sciences, (Springer Science+Business Media, Inc, 2005), Vol.145.
- (6) I. O. Kulik, A. N. Omelyanchouk and R. I. Shekhter, Sov. J. Low Temp. Phys. 3, 840 (1977) [Fiz. Nizk. Temp. 3, 1543 (1977)].
- (7) G. E. Blonder, M. Tinkham and T. M. Klapwijk, Phys. Rev. B 25, 4515 (1982); A. V. Zaitsev, Sov. Phys. - JETP 59, 1015 (1984); A. Plecenik, M. Grajcar, S. Benacka, P. Seidel, and A. Pfuch, Phys. Rev. B 49, 10016 (1994).
- (8) P. L. Gammel, D. Lopez, D. J. Bishop, M. R. Eskildsen, N. H. Andersen, K. Mortensen, I. R. Fisher, K. O. Cheon, and P. C. Canfield, J. Appl. Phys., 87, 5544 (2000).
- (9) S. V. Shulga, S.-L. Drechsler, G. Fuchs, K.-H. Müller, K. Winzer, M. Heinecke, and K. Krug, Phys. Rev. Lett. 80 1730 (1998).
- (10) N. L. Bobrov, S. I. Beloborod’ko, L. V. Tyutrina, V. N. Chernobay, I. K. Yanson, D. G. Naugle and K. D. D. Rathnayaka, Low Temp. Phys, 32, 489 (2006) [Fiz. Nizk. Temp. 32, 641 (2006)].
- (11) D. L. Bashlakov, Yu. G. Naidyuk, I. K. Yanson, G. Behr, S.-L. Drechsler, G. Fuchs, L. Schultz and D. Souptel, J. Low Temp. Phys., 147, 335 (2007).
- (12) P. Raychaudhuri, G. Sheet, S. Mukhopadhyay and H. Takeya, Physica C 460-462, 95 (2007).
- (13) J. P. Brison, N. Luchier, A. Sulpice, H. Suderow, P. Martinez-Samper, S. Vieira, A. I. Buzdin, and P. C. Canfield, J. of Magn. Magn. Mater. 272-276, 158 (2004).
- (14) Yu. G. Naidyuk, D. L. Bashlakov, N. L. Bobrov, V. N. Chernobay, O. E. Kvitnitskaya, I. K. Yanson, G. Behr, S.-L. Drechsler, G. Fuchs, D. Souptel, D. G. Naugle, K. D. D. Rathnayaka, J. H. Ross Jr., Physica C, 460-462, 107 (2007).
- (15) Yu. G. Naidyuk, G. Behr, N. L. Bobrov, V. N. Chernobay, S.-L. Drechsler, G. Fuchs, O. E. Kvitnitskaya, D. G. Naugle, K. D. D. Rathnayaka and I. K. Yanson, J. of Phys.: Conf. Series, 150, 052178 (2009).
- (16) Yu. G. Naidyuk, O. E. Kvitnitskaya, I. K. Yanson, G. Fuchs, K. Nenkov, A. Wälte, G. Behr, D. Souptel, and S.-L. Drechsler, Phys. Rev. B 76, 014520 (2007).
- (17) B. K. Cho, M. Xu, P. C. Canfield, L. L. Miller, and D. C. Johnston, Phys. Rev. B 52, 3676 (1995).
- (18) L. DeBeer-Schmitt, M. R. Eskildsen, M. Ichioka, K. Machida, N. Jenkins, C. D. Dewhurst, A. B. Abrahamsen, S. L. Bud’ko, and P. C. Canfield, Phys. Rev. Lett. 99, 167001 (2007).
- (19) D. Souptel, G. Behr, W. Löser, K. Nenkov, and G. Fuchs, J. of Crystal Growth, 275, e91 (2005).
- (20) M. R. Eskildsen, K. Harada, P. L. Gammel, A. B. Abrahamsen, N. H. Andersen, G. Ernst, A. P. Ramirez, D. J. Bishop, K. Mortensen, D. G. Naugle, K. D. D. Rathnayaka and P. C. Canfield, Nature, 393, 242 (1998).
- (21) A. K. Bhatnagar, K. D. D. Rathnayaka, D. G. Naugle, P. C. Canfield, Phys. Rev. B 56, 437 (1997).
- (22) A. Wexler, Proc. Phys. Soc. (London) 89, 927 (1966).
- (23) R. C. Dynes, V. Narayanamurty and J. P. Garno, Phys. Rev. Lett. 21, 1509 (1978).
- (24) Z. Q. Peng, K. Krug and K. Winzer, Phys. Rev. B 57, 8123(R) (1998).
- (25) C. V. Tomy, M. R. Lees, L. Afalfiz, G. Balakrishnan, and D. Paul, Phys. Rev. 52, 9186 (1995).
- (26) J. Jensen and P. Hedegård, Phys. Rev. B 76, 094504 (2007).
- (27) O. E. Kvitnitskaya, Yu. G. Naidyuk, I. K. Yanson, T. Niemeier, G. Fuchs, B. Holzapfel and L. Schultz, Supercond. Sci. Technol. 23 115001 (2010).
- (28) N. L. Bobrov, V. N. Chernobay, Yu. G. Naidyuk, L. V. Tyutrina, D. G. Naugle, K. D. D. Rathnayaka, S. L. Budko, P. C. Canfield and I. K. Yanson, Europhys. Lett., 83, 37003 (2008).
- (29) I. K. Yanson, Yu. G. Naidyuk, Fiz. Nizk. Temp. 69, 355 (2004) [Low Temp. Phys. 69, 261 (2004)].
- (30) H. Suderow, P. Martinez-Samper, S. Vieira, N. Luchier, J. P. Brison, and P. C. Canfield, Phys. Rev. B. 64, 020503(R) (2001).
- (31) S.B. Dugdale, C. Utfeld, I. Wilkinson, J. Laverock, Zs. Major, M.A. Alam, and P. Canfield, Supercond. Sci. Technol. 22, 01402 (2009).
- (32) B. Bergk, V. Petzold, H. Rosner, S.-L. Drechsler, M. Bartkowiak, O. Ignatchik, A. D. Bianchi, I. Sheikin, P. C. Canfield, and J. Wosnitza, Phys. Rev. Lett. 100, 257004 (2008).
- (33) S.-L. Drechsler, H. Rosner, I. Opahle, and H. Eschrig, Physica C 408-410, 104 (2004).
- (34) H. Rosner et al. to be published.
- (35) X. Lu, W. K. Park, S. Yeo, K.-H. Oh, S.-I. Lee, S. L. Bud ko, P. C. Canfield, and L. H. Greene, Phys. Rev. B 83, 104519 (2011).
- (36) Yu. G. Naidyuk, R. Häussler, and H. von Löhneysen, Physica B, 218, 122 (1996).
- (37) I. O.Kulik, I. K. Yanson, A. N. Omelyanchouk, Fiz. Nizk. Temp. 7 263 (1981) [Sov. J. Low Temp. Phys. 7 129 (1981)]
- (38) C. Lamprecht, Diploma thesis ”Untersuchung der magnetischen und supraleitenden Eigenschaften von Ni2B2C (- Ho, Tm)”, TU Dresden, Dresden (2007). Noteably, the reentrant behavior sometimes reported in the literature is not observed for all single crystals. Moreover, the upper critical field can differ by a factor of 2, even for annealed samples. This points, in our opinion, to the large role of residual disorder.
- (39) Yu. G. Naidyuk, H. v. Löhneysen, and I. K. Yanson, Phys. Rev. B 54, 16077 (1996).
- (40) M. Tinkham, Introduction to Superconductivity (McGraw-Hill, New-York, 1980).
- (41) Y. Miyoshi, Y. Bugoslavsky, and L. F. Cohen, Phys. Rev. B 72, 012502 (2005).
- (42) F. Gompf, W. Reichardt, H. Schober, B. Renker, M. Buchgeister, Phys. Rev. B 55, 9058 (1997).
- (43) I. K. Yanson, V. V. Fisun, A. G. M. Jansen, P. Wyder, P. C. Canfield, B. K. Cho, C. V. Tomy, and D. McK. Paul, Phys. Rev. Lett. 78, 935 (1997).
- (44) I. K. Yanson, N. L. Bobrov, C. V. Tomy, and D. McK. Paul, Physica C 334, 152 (2000).
- (45) U. Gasser, P. Allenspach, F. Fauth, W. Henggeler, J. Mesot, A. Furrer, S. Rosenkranz, P. Vorderwisch, M. Buchgeister, Z. Phys. B 101, 345 (1996).
- (46) N. H. Andersen, J. Jensen, T. B. S. Jensen, M. v. Zimmermann, R. Pinholt, A. B. Abrahamsen, K. Nørgaard Toft, P. Hedegård, and P. C. Canfield, Phys. Rev. B 73, 020504(R) (2006).
- (47) M. Rotter, C. Sierks, M. Loewenhaupt, J. Freudenberger and H. Schober, in Rare Earth Transition Metal Borocarbides (Nitrides):Superconducting, Magnetic and Normal State Properties eds. K.H. Müller and V. Narozhnyi (Kluwer Academic, Dordrecht, 2001), Vol.14, p. 137.
- (48) P. Raychaudhuri, D. Jaiswal-Nagar, G. Sheet, S. Ramakrishnan, and H. Takeya, Phys. Rev. Lett. 93, 156802 (2004).
- (49) N. L. Bobrov, S. I. Beloborod ko, L. V. Tyutrina, I. K. Yanson, D. G. Naugle, and K. D. D. Rathnayaka, Phys. Rev. B 71, 014512 (2005).
- (50) D. Daghero and R. S. Gonnelli, Supercond. Sci. Technol. 23, 043001(2010).
- (51) K. Gloos, F. B. Anders, B. Buschinger, C. Geibel, K. Heuser, F. Jahrling, J. S. Kim, R. Klemens, R. Müller-Reisner, C. Schank, G. R. Stewart, J. Low Temp. Phys. 105, 37 (1996).