Narrow absorption features in the co-added XMM-Newton RGS spectra of isolated Neutron Stars.
Abstract
We co-added the available XMM-Newton RGS spectra for each of the isolated X-ray pulsars RX J0720.43125, RX J1308.6+2127 (RBS1223), RX J1605.3+3249 and RX J1856.43754 (four members of the “Magnificent Seven”) and the “Three Musketeers” Geminga, PSR B0656+14 and PSR B1055-52. We confirm the detection of a narrow absorption feature at in the co-added RGS spectra of RX J0720.43125 and RX J1605.3+3249 (including most recent observations). In addition we found similar absorption features in the spectra of RX J1308.6+2127 (at ) and maybe PSR B1055-52 (at ). The absorption feature in the spectra of RX J1308.6+2127 is broader than the feature e.g. in RX J0720.43125. The narrow absorption features are detected with 2 to 5.5 significance.
Although very bright and frequently observed, there are no absorption features visible in the spectra of RX J1856.43754 and PSR B0656+14, while the co-added XMM-Newton RGS spectrum of Geminga has not enough counts to detect such a feature.
We discuss a possible origin of these absorption features as lines caused by the presence of highly ionised oxygen (in particular OVII and/or OVI at ) in the interstellar medium and absorption in the neutron star atmosphere, namely the absorption features at as gravitational redshifted (=1.17) OVIII.
keywords:
stars: neutron – pulsars: individual: RX J0720.43125 – pulsars: individual: RX J1308.6+2127 – pulsars: individual: RX J1605.3+3249 – pulsars: individual: RX J1856.43754 – pulsars: individual: Geminga – pulsars: individual: PSR B0656+14 – pulsars: individual: PSR B1055-521 Introduction
Neutron stars (NSs) give us the opportunity to study matter under extreme conditions, such as high densities (), strong magnetic fields () and high temperatures (). Such conditions cannot be generated in laboratories and theoretical predictions need observational input to understand satisfactorily the behaviour of matter under these conditions, in particular for the interior of NSs. One main goal of NS astrophysics is to constrain the Equation of State (EoS) at supra-nuclear densities that would give us fundamental insights into various fields of physics, therefore suitable targets have to be found.
Most of the known NSs (Manchester et al. 2005) are radio pulsars, among them nine double NSs were found so far (see Stairs 2006 for a review) that enable us to determine their masses with high accuracy. However, it is not possible to infer the radius or compactness of these objects. In principle, the radius could be measured from the luminosity of cooling (hence, blackbody radiation) NSs, if the distance and temperature are known, using the modified Stefan-Boltzman law. If spectral lines could be detected as well, they deliver an estimate for the compactness of the particular NS from measuring the gravitational redshift 111Here, , where denotes the Schwarzschild radius..
On the other hand, spectral features can be caused by the interstellar medium (ISM): The Sun is located in a 1MK hot cavity of radius, the so-called Local Bubble (Lallement et al. 2003) that was formed by multiple supernovae in the last few Myrs (Breitschwerdt & de Avillez 2006; Breitschwerdt et al. 2009). The Local Bubble (LB) is filled with a thin hot plasma including highly ionised mid Z-elements (in particular He-like oxygen). The exact temperature of the LB is currently under debate (Kuntz 2009; Shelton 2009), but this environment likely causes absorption features in the soft X-rays. Thus, narrow absorption features in the spectra of isolated X-ray sources can be caused by the ISM and/or by intrinsic processes.
We selected those isolated NSs for our work that are bright in the X-rays, have simple spectral properties and that are observed deep enough with XMM-Newton RGS, hence four members of the “Magnificent Seven” (RX J0720.43125, RX J1308.6+2127222RBS1223, RX J1605.3+3249 and RX J1856.43754) and all members of the “Three Musketeers” (Geminga, PSR B0656+14 and PSR B1055-52). We co-added the high resolution RGS spectra of these targets and searched for narrow, maybe redshifted, absorption lines.
1.1 The “Magnificent Seven”
During the ROSAT All Sky Survey, seven soft X-ray sources, the so called “Magnificent Seven” (hereafter M7), were discovered that are suitable targets for such investigations. The M7 exhibit soft X-ray spectra that are best modelled with blackbody radiation () with broad absorption features in some cases. These absorption features are interpreted as proton-cyclotron resonances or atomic transitions of bound species in a strong magnetic field at . No radio emission could be detected from the M7 (see e.g. Kondratiev
et al. 2009), but they exhibit X-ray pulsations with periods between and . All M7 are isolated, i.e. they are not associated with a supernova remnant, do not belong to a binary system and no sub-stellar companions are found so far (Posselt et al. 2009). The kinematic and characteristic age estimates yield values of (Haberl 2007; Tetzlaff et al. 2010). The two brightest members, RX J1856.43754 and RX J0720.43125, have known trigonometric parallaxes (Walter et al. 2010; Kaplan et al. 2007, yielding distances of and , respectively)333For RX J0720.43125, Eisenbeiss (2011) obtains a distance of ., which allows one to derive limits on the size of the emitting area from the analysis of the X-ray spectrum. For a review of the M7 we refer to Haberl (2007) and Kaplan & van
Kerkwijk (2009).
1.2 The “Three Musketeers”
Like the M7, the “Three Musketeers” (hereafter 3M) form an own sub-sample of NSs with similar properties (Becker & Truemper 1997). Their soft X-ray spectra are best modelled with two blackbodies of different normalisations and a hard power-law tail dominating above 2 keV (see De Luca et al. 2005 for a review). The magnetic fields of the 3M () are a factor of ten weaker than those of the M7, but the 3M are younger by trend (a few ). Geminga (discovered by Bignami et al. 1983) and PSR B0656+14 (discovered by Cordova et al. 1989) have distances derived from trigonometric parallaxes (Caraveo et al. 1996; Brisken et al. 2003; Walter 2005) ranging from 150 pc to 300 pc, while the distance of PSR B1055-52 (750 pc) is estimated from dispersion measurements (Kramer et al. 2003). Geminga and PSR B1055-52 also exhibit pulsations in gamma-rays (Fierro 1993; Bertsch et al. 1992).
2 XMM-Newton observations
All XMM-Newton Reflection Grating Spectrometer (RGS, den Herder et al. 2001) observations have been analysed and reprocessed with the standard XMM-Newton Science Analysis System (SAS) version 10.0 using the rgsproc task. We checked the background of each observation individually and created Good Time Intervall (GTI) files that filter out those times with count rates above 0.25 or 0.1 cts/s (depending on the source and background behaviour) determined for CCD number nine of RGS1 and ran rgsproc again for GTI filtering. The photons for the spectra were obtained from the default RGS extraction regions and we co-added the spectra using rgscombine (that also produces co-added background spectra and the corresponding response matrices) allowing to investigate the total average spectrum with high energy resolution. The RGS2 detector does not provide spectral information in the required energy band (due to the failure of chip four) around 0.57 keV, thus could not be used.
The co-added spectra are fitted and investigated using Xspec 12. We explain the data handling and fitting and fit results of the individual sources in the following sections.
2.1 RX J0720.43125
In contrast to the other M7, RX J0720.43125 shows significant spectral and temporal variations on time scales of years that might be caused by a glitch (van Kerkwijk et al. 2007, see also Kaplan & van
Kerkwijk 2005) or free precession (Hohle
et al. 2009; Hohle et al. 2010; Haberl 2007; Haberl
et al. 2006; de Vries et al. 2004). Due to this peculiarity, RX J0720.43125 is one of the best investigated members of the M7. Since more than ten years RX J0720.43125 is frequently observed with XMM-Newton and Chandra.
After co-adding all available XMM-Newton RGS spectra of RX J0720.43125, Hambaryan et al. (2009) reported the detection of a narrow absorption feature at . This feature was interpreted as the absorption line of highly ionised oxygen: either OVI and/or OVII at rest, or OVIII (in this case ) with a gravitational redshift of , see Hambaryan et al. (2009). In Hambaryan et al. (2009) it is argued that this absorption feature, if oxygen, may originate from the ambient medium of the NS, maybe from a circumstellar disk surrounding RX J0720.43125. The presence of such a disk may account partly for some of the peculiarities of RX J0720.43125 (Hambaryan et al. 2009).
Since the work of Hambaryan et al. (2009), we performed four further XMM-Newton observations. We re-investigated the data used by Hambaryan et al. (2009) together with the new XMM-Newton observations, that adds up to 650 ks in total (533 ks after GTI filtering), see Table 1.
| Obs. ID | date | counts | eff. exposure |
|---|---|---|---|
| 0.35-1.0 keV | [ks] | ||
| 0124100101 | 2000 May 13 | 11480 | 42.36 |
| 0132520301 | 2000 Nov 21 | 7878 | 30.24 |
| 0156960201 | 2002 Nov 6 | 7518 | 29.61 |
| 0156960401 | 2002 Nov 8 | 7796 | 31.22 |
| 0158360201 | 2003 May 2 | 15507 | 61.56 |
| 0161960201 | 2003 Oct 27 | 13513 | 44.67 |
| 0164560501 | 2004 May 22 | 8007 | 26.97 |
| 0300520201 | 2005 Apr 28 | 10366 | 37.97 |
| 0300520301 | 2005 Sep 22 | 10034 | 36.33 |
| 0311590101 | 2005 Nov 12 | 10917 | 39.57 |
| 0400140301 | 2006 May 22 | 5952 | 21.62 |
| 0400140401 | 2006 Nov 5 | 5592 | 21.82 |
| 0502710201 | 2007 May 5 | 4451 | 16.77 |
| 0502710301 | 2007 Nov 17 | 6138 | 24.81 |
| 0554510101 | 2009 Mar 21 | 3682 | 15.45 |
| 0601170301 | 2009 Sep 22 | 3570 | 15.61 |
| 0650920101 | 2011 Apr 11 | 4443 | 19.81 |
| 0670700201 | 2011 May 02 | 3741 | 16.99 |
| total | 140584 | 533.38 |
The X-ray spectra of RX J0720.43125 are best modelled with a blackbody and a broad absorption feature at (probably caused by proton cyclotron resonance) that is represented by a Gaussian absorption line (see Hohle
et al. 2009; Hohle et al. 2010; Haberl 2007; Haberl
et al. 2006; de Vries et al. 2004), both absorbed due to the interstellar medium. We use the Xspec model phabs*(bbodyrad+gaussian). However, the RGS1 spectrum begins at energies of 0.35 keV, i.e. the centre of the cyclotron line is outside the spectrum (at 0.3 keV) and the information of the continuum yielding the blackbody normalisation, and the properties of the cyclotron line is limited to lower energies. Thus, these parameters are degenerated (a higher value can be compensated by a broader and deeper cyclotron line etc.). For such investigations the EPIC-pn spectra are much more suitable, but pn does not provide the spectral resolution that is required here.
Therefore, we fitted the co-added RGS1 spectrum keeping all parameters free for fitting but fixed the line energy of the cyclotron line at 0.3 keV (also for the error calculations).
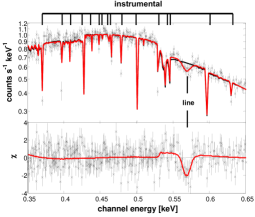
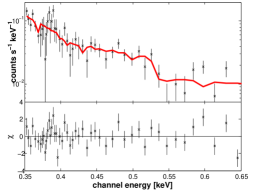
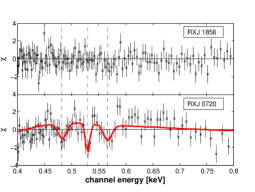
We fitted the RGS1 spectrum with this model, using the photons from . The co-added spectrum fits with . For the narrow absorption feature we included a further Gaussian line at . The fit including the narrow absorption feature yields . Note, that no instrumental features are present around , i.e. supporting an astrophysical origin. The fit results are listed in Table 8 and the spectrum is shown in Figure 1.
We confirm the presence of a narrow absorption feature at with an equivalent width (EW) of (that corresponds to 5.6 significance).
2.2 RX J1308.6+2127 (RBS1223)
The XMM-Newton EPIC-pn spectra of the M7 member RX J1308.6+2127 exhibit two broad Gaussian absorption features (Haberl 2007) with line energies of 0.30 keV and 0.23 keV (or one line at 0.30 keV or 0.29 keV, see Haberl et al. 2003), again below the RGS spectrum. Thus, these two lines appear as one broader line with a line energy at 0.205 keV, i.e. we use the Xspec model phabs*(bbodyrad+gaussian) and fixed the line energy for fitting, but released it for the error calculation. The XMM-Newton RGS observations of RX J1308.6+2127 sum up to 190 ks, where 170 ks are left after passing the GTI filters, see Table 2.
| Obs. ID | date | counts | eff. exposure |
|---|---|---|---|
| 0.35-1.0 keV | [ks] | ||
| 0090010101 | 2001 Dec 31 | 946 | 8.83 |
| 0157360101 | 2003 Jan 1 | 3055 | 28.71 |
| 0163560101 | 2003 Dec 30 | 3019 | 29.80 |
| 0305900201 | 2005 Jun 25 | 1633 | 16.73 |
| 0305900301 | 2005 Jun 27 | 1487 | 14.74 |
| 0305900401 | 2005 Jul 15 | 1230 | 12.43 |
| 0305900601 | 2006 Jan 10 | 1576 | 16.72 |
| 0402850301 | 2006 Jun 8 | 545 | 5.53 |
| 0402850401 | 2006 Jun 16 | 842 | 8.34 |
| 0402850501 | 2006 Jun 27 | 913 | 9.48 |
| 0402850901 | 2006 Jul 5 | 662 | 7.11 |
| 0402850701 | 2006 Dec 27 | 993 | 10.34 |
| total | 16901 | 168.76 |
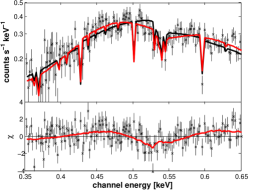
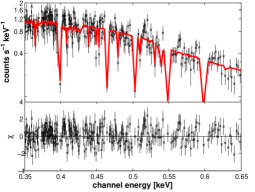
The co-added spectrum fits with . Although having less counts than the co-added spectrum of RX J0720.43125, it can be clearly stated that no significant narrow absorption feature at 0.57 keV is detected. However, the model overpredicts the count numbers in the energy range from 0.48 keV to 0.60 keV, that can be interpreted as a new absorption feature broader than the absorption feature in RX J0720.43125, but too narrow to be detected in EPIC-pn.
Including a further (broader) Gaussian absorption line at 0.53 keV decreases to 1.13. The co-added RGS1 spectrum is shown in Figure 2. Schwope et al. (2007) reported one absorption feature at 0.200.39 keV and a further broad feature either at 0.46 keV or at 0.73 keV in the XMM-Newton EPIC-pn spectra of RX J1308.6+2127. The second feature does not correspond to the line at 0.53 keV found here and there is no evidence for the feature found in Schwope et al. (2007) in our co-added RGS1 spectrum. The differences between RGS and pn were reduced in the last years (e.g. compared to Haberl et al. 2003 and Schwope et al. 2007) due to new calibrations. Thus an up-dated combined RGS and pn analysis is required with the new calibrations.
Maybe the X-ray spectrum of RX J1308.6+2127 is much more complex and the absorption features change with time (since the work of Schwope et al. 2007, we have five more observations available).
We stress that the RGS detector exhibits strong features in the energy range from 0.48 keV to 0.60 keV, but these features are narrow compared to the feature we found at 0.53 keV (that is not seen in the brighter spectrum of e.g. RX J0720.43125). Thus, the new absorption feature is not of an instrumental origin.
Since the line centre of the new absorption feature lies at 0.53 keV (the absorption energy of OI at rest, see also de Vries
et al. 2003) we used the Xspec absorption model vphabs to vary the abundance of oxygen during the fit procedure. The fit did not find a solution to compensate the absorption feature at 0.53 keV with a higher abundance of neutral oxygen, hence, this feature may originates from the NS itself.
The fit results are listed in Table 8.
2.3 RX J1605.3+3249
The first report of a narrow absorption feature in the co-added RGS spectra of an isolated NS was published by van Kerkwijk et al. (2004), who found an absorption line at 0.57 keV in the spectra of RX J1605.3+3249. Since then, nine further XMM-Newton observations of RX J1605.3+3249 were performed, i.e. 14 in total. However, almost all observations after February 2006 are strongly contaminated by high background and did not pass the GTI filtering. Finally, our sample of observations is not much different from that used by van Kerkwijk et al. (2004), see Table 3. We only could add observation 0302140501 (6 ks left after GTI filtering), but omitted observation 0302140601 (used in van Kerkwijk et al. 2004). The total exposure time sums up to 110 ks.
| Obs. ID | date | counts | eff. exposure |
|---|---|---|---|
| 0.35-1.0 keV | [ks] | ||
| 0073140301 | 2002 Jan 9 | 2717 | 20.08 |
| 0073140201 | 2002 Jan 15 | 3715 | 27.83 |
| 0073140501 | 2002 Jan 19 | 3009 | 22.21 |
| 0157360401 | 2003 Jan 17 | 4470 | 30.98 |
| 0302140501 | 2006 Feb 12 | 748 | 5.91 |
| total | 14660 | 107.01 |
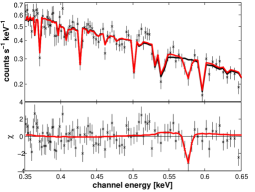
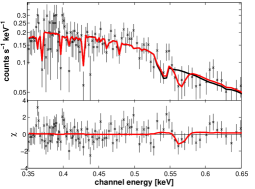
van Kerkwijk et al. (2004) found a broad absorption feature at 0.493 keV, again associated with a possible cyclotron line, i.e. we use the model phabs*(bbodyrad+gaussian) here too. This line energy lies well within the RGS energy range, but the best fit leads to a line energy at 0.403 keV that has to be fixed for the error calculation. Therefore, the value and the blackbody temperature lies below the values listed in van Kerkwijk et al. (2004), but is consistent within the errors, see Table 8. The co-added spectrum fits with .
Adding a further Gaussian absorption feature, the fit yields . We confirm the presence of an absorption line at with , with the 3.5 significance, as reported in van Kerkwijk et al. (2004). The co-added RGS spectrum of RX J1605.3+3249 is shown in Figure 3.
2.4 RX J1856.43754
This NS is the brightest member of the M7 and is known to exhibit no features in XMM-Newton EPIC-pn and Chandra HRC-S/LETG spectra (Burwitz et al. 2001, 2003) and is constant over time. Thus, RX J1856.43754 is used as calibration source for X-ray telescopes. Therefore, the XMM-Newton observations sum up to 1000 ks, where 880 ks remain after the GTI filtering, see Table 4.
| Obs. ID | date | counts | eff. exposure |
|---|---|---|---|
| 0.35-1.0 keV | [ks] | ||
| 0106260101 | 2002 Apr 8 | 8417 | 57.30 |
| 0201590101 | 2004 Apr 17 | 5158 | 36.61 |
| 0165971701 | 2004 Sep 24 | 4742 | 33.73 |
| 0165971601 | 2004 Sep 24 | 4654 | 33.29 |
| 0165971901 | 2005 Mar 23 | 2531 | 17.91 |
| 0213080101 | 2005 Apr 15 | 1579 | 11.39 |
| 0165972001 | 2005 Sep 24 | 4624 | 33.53 |
| 0165972101 | 2006 Mar 26 | 8953 | 68.71 |
| 0412600101 | 2006 Oct 24 | 8715 | 72.75 |
| 0412600201 | 2007 Mar 14 | 6049 | 50.24 |
| 0415180101 | 2007 Mar 25 | 3042 | 22.72 |
| 0412600301 (S004) | 2007 Oct 4 | 2926 | 22.25 |
| 0412600301 (U002) | 2007 Oct 4 | 2459 | 19.69 |
| 0412600401 | 2008 Mar 13 | 6052 | 48.34 |
| 0412600601 | 2008 Oct 4 | 7913 | 64.97 |
| 0412600701 | 2009 Mar 19 | 8300 | 68.65 |
| 0412600801 (S004) | 2009 Oct 7 | 872 | 6.90 |
| 0412600801 (U002) | 2009 Oct 7 | 8576 | 70.88 |
| 0412600901 | 2010 Mar 22 | 8652 | 72.22 |
| 0412601101 | 2010 Sep 28 | 7950 | 68.30 |
| total | 112170 | 880.38 |
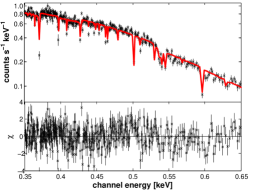
Although Burwitz
et al. (2001, 2003) found no absorption feature we include this source as well, since the co-added RGS spectra of RX J1856.43754 were not investigated before.
Likewise Burwitz
et al. (2001, 2003), we apply the Xspec model phabs*(bbodyrad), where the fit yields (see Table 8). The spectrum of RX J1856.43754 is completely featureless in the RGS1 energy range (Figure 4).
2.5 Geminga (PSR J0633+1746)
The first spectrum of Geminga with a sufficiently large count number was published by Halpern &
Ruderman (1993), using ROSAT data. They found the Geminga spectrum is best modelled with two blackbodies having and , respectively. Using new ROSAT data, Halpern &
Wang (1997) identified a power-law component above 2 keV with (the most recent value is , see Jackson et al. 2002; Caraveo et al. 2004). Therefore, we use phabs*(bbodyrad+bbodyrad+pow) for the data fitting.
Although Geminga was frequently observed with XMM-Newton (240 ks after GTI filtering), the total number of counts is only 3,100, i.e. less than half the photons Halpern &
Ruderman (1993) could use in their first Geminga spectrum (but with lower spectral resolution), see Table 5.
| Obs. ID | date | counts | eff. exposure |
|---|---|---|---|
| 0.35-2.0 keV | [ks] | ||
| 0111170101 | 2002 Apr 4 | 993 | 76.38 |
| 0201350101 | 2004 Mar 13 | 259 | 15.85 |
| 0301230101 | 2005 Sep 16 | 49 | 4.91 |
| 0311591001 | 2006 Mar 17 | 521 | 34.80 |
| 0400260201 | 2007 Oct 2 | 228 | 20.17 |
| 0400260301 | 2007 Mar 11 | 277 | 21.71 |
| 0501270201 | 2007 Sep 18 | 211 | 22.73 |
| 0501270301 | 2008 Mar 8 | 127 | 11.82 |
| 0550410201 | 2008 Oct 3 | 240 | 21.11 |
| 0550410301 | 2009 Mar 10 | 181 | 11.36 |
| total | 3086 | 240.84 |
Since the co-added RGS spectrum of Geminga has the lowest count number in our sample and the hot blackbody dominates the spectrum above 1 keV, but is strongly superimposed by the power-law (see e.g. Figure 1 in De Luca et al. 2005). We find the best fit with a negligible normalisation of the hot blackbody, whereas the power-law is clearly visible. Thus, we applied the model phabs*(bbodyrad+pow). The fit yields and the results are shown in Table 8.
We find no evidence for an absorption feature like in the case of RX J0720.43125, RX J1308.6+2127 or RX J1605.3+3249 in the co-added RGS spectrum of Geminga. However, weak features cannot be detected due to the low count number (Figure 5).
2.6 PSR B0656+14
The first investigation of the emission of PSR B0656+14 was performed with ROSAT data by Possenti et al. (1996), who modelled the spectrum with a blackbody and a second component that could be either a further blackbody or a power-law. Later, Greiveldinger
et al. (1996) applied the three component model (two blackbodies and a power-law with ) that yields the best fit. This model was later confirmed by Pavlov
et al. (2002) using Chandra data. Marshall &
Schulz (2002) found no evidence for spectral features in the Chandra spectra of PSR B0656+14, but used only two blackbodies (and no power-law) for their fit model. Today, only one RGS observation of PSR B0656+14 is available (Table 6). But this observation yields more counts than e.g. all Geminga observations in total.
| Obs. ID | date | counts | eff. exposure |
|---|---|---|---|
| 0.35-2.0 keV | [ks] | ||
| 0112200101 | 2001 Oct 23 | 7483 | 38.12 |
We first fitted the RGS1 spectrum of PSR B0656+14 with phabs*(bbodyrad+bbodyrad+pow). Both blackbodies dominate the spectrum in the RGS energy range, but the power-law becomes significant above 2 keV (see Figure 2 in De Luca et al. 2005), where the RGS1 spectrum has much less counts. Thus, the power-law is negligible and we further on use the model phabs*(bbodyrad+bbodyrad) (likewise in Marshall &
Schulz 2002). The fit yields and the spectral properties are listed in Table 8.
We find no evidence for a narrow absorption feature in the RGS1 spectrum of PSR B0656+14 (Figure 6) and thereby confirm the results in Marshall &
Schulz (2002). The count number of the RGS1 spectrum would have been sufficiently high to detect an absorption feature as found e.g. in the spectrum of RX J0720.43125, if present.
2.7 PSR B1055-52
The first spectral investigation of PSR B1055-52 was performed by Oegelman &
Finley (1993) using ROSAT data. Like in the case of PSR B0656+14, the best fit model required a blackbody and a further component that could be a second blackbody or a power-law with . Combining ROSAT and Chandra data, Pavlov
et al. (2002) showed that an adequate fit model requires three components: two blackbodies and a power-law with . Therefore we first use phabs*(bbodyrad+bbodyrad+pow).
Altogether, the RGS1 data of PSR B1055-52 sum up to 95 ks (90 ks after GTI filtering) with 4,000 photons (Table 7).
| Obs. ID | date | counts | eff. exposure |
|---|---|---|---|
| 0.35-2.0 keV | [ks] | ||
| 0113050101 | 2000 Dec 14 | 1109 | 22.75 |
| 0113050201 | 2000 Dec 15 | 2323 | 55.66 |
| 0113050801 | 2000 Dec 15 | 164 | 3.77 |
| 0113050901 | 2000 Dec 15 | 356 | 7.84 |
| total | 3952 | 90.02 |
For the same reasons as discussed in the case of Geminga, we found the best fit for a negligible normalisation of the second, hotter, blackbody. Therefore, we applied the model phabs*(bbodyrad+pow), that fits with (Table 8).
In contrast to the other 3M, PSR B1055-52 seems to exhibit a weak absorption feature at 0.57 keV, similar to those found in the co-added RGS1 spectra of RX J0720.43125 and RX J1605.3+3249. To check this, we add a Gaussian absorption line to our fit model (Figure 7). With the new model, the value does not change significantly to , but the fit easily finds its minimum with the new line at with . This feature is not consistent to the continuum within 2, i.e. less significant than the narrow absorption feature in RX J1605.3+3249, but we stress that the total count number in the case of the co-added RGS1 spectrum of PSR B1055-52 is more than three times less than in the case of RX J1605.3+3249, i.e. further observations are required to verify this absorption feature.
| model | unit | RX J0720.43125 | RX J1308.6+2127 | RX J1605.3+3249 | RX J1856.43754 | Geminga | PSR B0656+14 | PSR B1055-52 |
|---|---|---|---|---|---|---|---|---|
| component | ||||||||
| eV | ||||||||
| km | ||||||||
| eV | ||||||||
| km | ||||||||
| eV | 300 (fixed) | 205.83 (fixed) | 403 (fixed) | |||||
| width | eV | |||||||
| eV | -35.2 | -163 | -65.2 | |||||
| power law | ||||||||
| norm | ph | |||||||
| 1.50/456 | 1.32/208 | 1.22/110 | 1.16/759 | 1.21/66 | 0.88/305 | 1.16/121 | ||
| eV | ||||||||
| width | eV | |||||||
| eV | ||||||||
| significance | 5.6 | 3.2 | 3.5 | 2.1 | ||||
| 1.42/453 | 1.13/205 | 1.11/107 | 1.15/118 |
2.8 XMM-Newton Results
We co-added all available RGS data of the four brightest M7 (RX J0720.43125, RX J1308.6+2127/RBS1223, RX J1605.3+3249 and RX J1856.43754) and the 3M; Geminga, PSR B0656+14 and PSR B1055-52. We confirm the narrow absorption features at 0.57 keV in the spectra of RX J0720.43125 and RX J1605.3+3249 as reported in earlier work by Hambaryan et al. (2009) and van Kerkwijk et al. (2004), respectively. We found a new absorption feature at 0.53 keV in the co-added RGS spectrum of RX J1308.6+2127, that is broader than those found in the case of RX J0720.43125 and RX J1605.3+3249.
The co-added spectra of RX J1856.43754 and PSR B0656+14 are featureless, while the count number in the co-added spectra of Geminga is not sufficiently high to exclude such weak features. There might be a new absorption feature (comparable to those in the spectra of RX J0720.43125 and RX J1605.3+3249) present in the co-added spectrum of PSR B1055-52.
We fitted the absorption features using an additive Gaussian line and checked our results with the multiplicative gabs model. For both models we obtain exact the same values for the equivalent widths.444The documentation of gabs in the Xspec manual is misleading and might cause some confusion. The (parameter 3) in gabs is not the optical depth (although it is even called so in older manuals). The “correct” optical depth can be calculated by , where is the second parameter in the gabs model. This should be taken into account if equivalent widths have to be calculated. We thank Oleg Kargaltsev, who pointed this out (see also http://xspector.blogspot.com/2011/07/note-on-gabs-model.html).
Our results are summarised in Table 8 and we will discuss them in the next sections.
3 The Chandra HRC-S/LETG spectra of RX J0720.43125 and RX J1856.43754
Hambaryan et al. (2009) considered the absorption feature at 0.57 keV could be caused by gravitational redshifted OVIII. If true, OVII should appear at 0.48 keV with the same redshift (, see the more detailed discussion in section 4). However, we found no evidence for such a feature in the co-added RGS spectrum, see Figure 1. Therefore we also analysed the Chandra HRC-S/LETG spectra of RX J0720.43125555RX J1605.3+3249 and RX J1308.6+2127(RBS1223) are not as frequently observed as RX J0720.43125 with Chandra HRC-S/LETG. For example the 90 ks HRC-S/LETG observation of RX J1308.6+2127 has four times less counts than the co-added RGS spectrum. Thus, we do not discuss these spectra in this work. and RX J1856.43754 for comparison, since RX J1856.43754 does not exhibit any features in the Chandra HRC-S/LETG spectra (Burwitz
et al. 2001, 2003).
The Chandra HRC-S/LETG (Juda 1996; Evans 1997; Juda 1997; Kraft et al. 1997) data were analysed with CIAO 4.1. We created own GTI files using dmgti and filtered those events for data reduction with less than 60180 cts/s (depending on observation and background lightcurves). The photons (source plus background and background) from both first orders were cut out within the standard LETG spectral extraction windows. The HRC-S/LETG spectra were added using the CIAO command add grating orders to add the two first orders (all other orders have a negligible count number) and add grating spectra to add the HRC-S/LETG spectra. To prepare the HRC-S/LETG data for spectroscopic fitting in Xspec, the background was generated with the command tgbkg. Altogether, the co-added HRC-S/LETG spectra have exposure time (see Table 9). For details of the reduction of the Chandra data we also refer to Hohle et al. (2010).
| Obs. Id. | Start Date | Counts | Eff. exposure |
| 0.15-1.0 keV | [ks] | ||
| 368 | 2000 Feb 1 | 580 | 2.10 |
| 745 | 2000 Feb 2 | 3 | 0.14 |
| 369 | 2000 Feb 4 | 2660 | 6.12 |
| 5305 | 2004 Feb 27 | 9691 | 35.68 |
| 5581 | 2005 Jan 23 | 17703 | 62.05 |
| 5582 | 2005 Jun 1 | 19639 | 69.69 |
| 6364 | 2005 Aug 27 | 9323 | 31.68 |
| 6369 | 2005 Oct 8 | 4448 | 16.14 |
| 7177 | 2005 Oct 9 | 2067 | 7.18 |
| 7243 | 2005 Dec 14 | 4992 | 17.05 |
| 7244 | 2005 Dec 15 | 4295 | 16.16 |
| 7245 | 2005 Dec 16 | 2964 | 11.10 |
| 5584 | 2005 Dec 17 | 2972 | 10.87 |
| 7251 | 2006 Sep 9 | 2713 | 10.59 |
| 10861 | 2009 Jan 20 | 2948 | 11.11 |
| 10700 | 2009 Feb 14 | 5478 | 21.61 |
| 10701 | 2009 Sep 11 | 8228 | 32.36 |
| 11820 | 2010 Jun 19 | 8650 | 33.56 |
| 13181 | 2010 Nov 18 | 4937 | 19.90 |
| 13188 | 2010 Nov 19 | 3709 | 14.04 |
| total | 118000 | 429.60 |
We fitted the co-added Chandra HRC-S/LETG spectrum of RX J0720.43125 with the same model as in Table 8 (without the narrow absorption feature at 0.57 keV), using the photons from , but ignoring the edges of the chip gaps at , and , to avoid systematic fit errors. The fit yields for 258 degrees of freedom applying the standard model with blackbody radiation and the broad absorption feature at . The spectral properties are listed in Table 10 and are consistent to those derived from XMM-Newton EPIC-pn spectra, see Hohle
et al. (2009)666The EPIC-pn spectra are fitted for the individual observations in one session. Since RX J0720.43125 is variable, only , line energy and line are kept constant in time. and Table 8. Note, the averaged temperature of RX J0720.43125 derived from the Chandra HRC-S/LETG spectrum (Table 10) is different to that obtained with the RGS data (Table 8), since the source is variable and the observations of the different instruments were performed at different times. In addition, possible systematic errors in the effective area calibrations between both instruments can lead to different temperatures.
| model | unit | RX J0720.43125 | RX J1856.43754 |
|---|---|---|---|
| component | |||
| bbodyrad | |||
| kT | eV | ||
| norm | km | ||
| eV | |||
| width | eV | ||
| eV | |||
| /d.o.f. | 1.07/258 | 1.02/505 | |
| eV | |||
| width | eV | ||
| eV | |||
| significance | 3.0 | ||
| eV | |||
| width | eV | ||
| eV | |||
| significance | 3.9 | ||
| eV | |||
| width | eV | ||
| eV | |||
| significance | 2.7 | ||
| /d.o.f. | 1.02/249 |
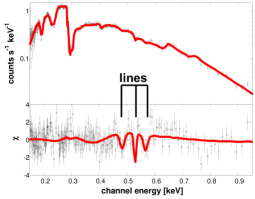
The narrow absorption feature at found by Hambaryan et al. (2009) should also be present in the co-added Chandra HRC-S/LETG spectrum of RX J0720.43125. Indeed, regarding the fit residuals in Figure 8, such an absorption feature appears at the particular energy range, but less clear than in Figure 1. Two other absorption features at and seem even more significant with respect to the continuum (Figure 8), thus, in addition to the narrow absorption feature found by Hambaryan et al. (2009), two other Gaussian absorption lines (at and ) are added to the fit model.
Fitting the data with the additional lines, the fit yields with 249 degrees of freedom. Since all lines are rather weak, for a cross-check Chandra pipeline products were used as well as reprocessed data for the co-added spectrum together with two different absorption models (phabs and tbabs) for the ISM and different grouping of the co-added spectra using the task grppha. In all cases, the lines are present, see Figure 8. The parameters of the absorption lines are listed in Table 10.
The absorption feature at is not seen in the co-added RGS spectrum of RX J0720.43125, thus we also co-added all available Chandra HRC-S/LETG spectra of the much brighter NS RX J1856.43754 (for the individual observations we refer to Burwitz
et al. 2001, 2003; Drake et al. 2002) for comparison.
For the fitting procedure we applied the same model as in subsection 2.4. The fit results are listed in Table 10 and are in good agreement to the values published in Burwitz
et al. (2001, 2003).
The fit residuals of the Chandra HRC-S/LETG spectrum of RX J1856.43754 do not exhibit the absorption features we found in the fit residuals of the Chandra HRC-S/LETG spectrum of RX J0720.43125, see Figure 9. Thus, although weak, the features found in the spectrum of RX J0720.43125 are not of an instrumental origin.
4 Discussion
The identification of narrow absorption lines in the X-ray spectra of highly magnetised NSs is non-trivial: If a line originates from the NS atmosphere, it is redshifted by a factor of (, ) to (, ) and the ion itself is not known. Considering abundances, lines in NS spectra may originate from highly ionised mid-Z elements or iron (Mori &
Ho 2007), probably from the lines, since they would cause the most strongest features. The strong magnetic field would shift and broaden the spectral lines.
An alternative interpretation is the interstellar origin of these absorption features, caused by the ISM, in particular in the LB, see e.g. Lallement et al. (2003) or Breitschwerdt & de Avillez (2006); Breitschwerdt et al. (2009). Some of the NSs in this work are likely located within the LB (e.g. RX J1856.43754), whereas other sources are outside (e.g. PSR B1055-52). We will discuss the two interpretations in the following sections.
4.1 Absorption features from the neutron star atmosphere
The detected line at corresponds to OVII or OVI (Hirata &
Horaguchi 1995) without gravitational redshift, as discussed in Hambaryan et al. (2009).
This line is actually a blend that mainly consists of the resonance line () at 573.95 eV of the triplet of He-like oxygen (OVII). This resonance line is superimposed with numerous weak OVI lines (see Hirata &
Horaguchi 1995; Kaastra et al. 2009 for details), therefore the absorption feature at appears not as a perfect Gaussian and the equivalent widths and the line widths () are larger than expected from the single, fully resolved lines (note, the resolution of RGS1 at 0.57 keV is ). The intercombination line () at 568.63 eV and the forbidden line () at 560.99 eV of the OVII triplet do not contribute to the absorption feature, since they appear only in emission (not detected in our spectra).
If highly ionised oxygen is present close to the NS surface, the OVIII line (; i.e. OVIII ) at could appear at with a reasonable redshift of (or ) and the corresponding OVII resonance line should appear at (). In Hambaryan et al. (2009) it is argued, that such an absorption feature may be detected in the co-added RGS spectra of RX J0720.43125.
We find no evidences for such a feature, neither in the co-added RGS spectra of RX J0720.43125, nor in the co-added RGS spectra of RX J1605.3+3249 (see Figure 1 or Figure 3). The RGS detector exhibits an intrinsic feature at that may superimpose a weak feature and inhibit a possible detection. However, we find such an absorption feature in the co-added Chandra HRC-S/LETG spectra of RX J0720.43125 (Figure 8 and Figure 9). This feature is rather weak, but comparable (regarding to its broadness) to the absorption feature at 0.57 keV (Figure 1), thus should be seen in the co-added RGS spectra of RX J0720.43125 too (although superimposed by a much narrower instrumental feature).
Intriguingly, the absorption feature at (if real, see Figure 9) would fit the interpretation of a gravitational redshifted line (implying a redshift of 777With this value, RX J0720.43125 would exceed its Schwarzschild radius by a factor of 3.7, i.e. would have an intrinsic radius of 15.6 km (assuming a mass of ) or 18.3 km at infinity. However, the absorption features may originate from regions above the NS surface. Then, the given values for the radius are upper limits.) and such features are expected at the particular energy range from NS atmosphere models (see Mori &
Ho 2007, in particular Figure 14 therein for field strength and 1 MK surface temperature, as measured for RX J0720.43125). On the other hand, the absorption feature at 0.48 keV is not very significant and requires further confirmation. The measured magnetic field strengths of the M7 (and the 3M) significantly increase the binding energy of atoms, if close to the NS. Under these conditions, the temperatures of might be too low to generate significant amounts of highly ionised oxygen, as discussed in Hambaryan et al. (2009). However, the atomic physics is not well understood for magnetic fields of about .
Note, there is no such feature (at 0.48 keV) expected from the ISM (CVI would appear in this energy range, but significantly weaker, Hirata &
Horaguchi 1995; Kaastra et al. 2009). An absorption feature at (OVIII at rest, see Hambaryan et al. 2009) remains undetected, probably due to the lack of photons in this energy range (if from the ISM, the high temperatures that are required to generate OVIII are not likely).
The absorption feature found at in the Chandra HRC-S/LETG data of RX J0720.43125 (see Figure 8) likely originates from the K-edge of neutral oxygen OI (Kaastra et al. 2009) at rest. This indicates an overabundance of neutral oxygen in the line of sight or might result from inexact modeling of this edge. Although we use different ISM absorption models (e.g. phabs or tbabs), this particular feature remains.
The absorption feature at is well detected in the XMM-Newton RGS spectrum of RX J0720.43125 (Hambaryan et al. 2009) and it appears (although weak) in the Chandra HRC-S/LETG spectra, i.e. its presence is certain (5.5 significance in the RGS spectra). Moreover, a similar feature is also detected in the co-added RGS spectra of RX J1605.3+3249 (van Kerkwijk et al. 2004 and Figure 3). The energies of the line centres are well fitted in both cases (Table 8), where the line centre of the absorption feature in the spectrum of RX J1605.3+3249 is shifted by with respect to the line centre of the absorption feature in the spectrum of RX J0720.43125. This shift cannot be explained by the same transition of a particular ion (e.g. OVII) at rest caused by different radial motion, since the required speed would be . Either the two lines represent different transitions ( at 573.95 eV in the case of RX J1605.3+3249 and at 568.63 eV in the case of RX J0720.43125; both for OVII at rest) but that raises the questions why one transition is completely suppressed and why the intercombination line at (RX J0720.43125) is seen in absorption, not in emission. Alternatively, the shift might be caused by a slightly different gravitational redshift due to different NS compactness ( for RX J1605.3+3249) and both absorption features are caused by the OVIII line.
We found a similar feature at in the co-added RGS spectrum of PSR B1055-52. However, the spectrum has not enough counts to identify this line undoubtedly and to determine the line energy of the line centre sufficiently accurate.
Note, spectral lines originating from the NS surface should appear splitted (and shifted) due to the Zeeman-effect (Sarazin &
Bahcall 1977) and broadened by pressure (Paerels 1997), that is not considered in this interpretation. Furthermore, the magnetic field is not constant over the NS surface, i.e. the lines should be broadened due to the contributions from different surface patches.
4.2 Absorption features of an interstellar or circumstellar origin
The distances of RX J0720.43125 and RX J1605.3+3249 are (from direct parallax measurements, Kaplan et al. 2007; Eisenbeiss 2011) and (estimated from extinction models, Posselt et al. 2007), respectively. Given the average volume density of OVII in the ISM (Yao &
Wang 2005, assuming that oxygen is completely ionised to OVII), the expected OVII column densities for these two NSs are and a factor of two or three larger for PSR B1055-52, since this NS is more distant (Kramer
et al. 2003). The hydrogen column densities from these three NSs are in the order of (Table 8). Applying the oxygen abundance relative to hydrogen (, Anders &
Grevesse 1989), the expected column density of OVII should be in the order of (again assuming that oxygen is completely ionised to OVII).
The measured equivalent widths of the narrow absorption features at 0.57 keV yield (RX J0720.43125), (RX J1605.3+3249) and (PSR B1055-52), taking fit errors (Table 8) and different velocity dispersions (Futamoto et al. 2004) into account and assuming that the absorption feature at 0.57 keV is a pure line (not a blend).
Hambaryan et al. (2009) discussed a possible circumstellar origin of the absorption feature at 0.57 keV in the RGS spectra of RX J0720.43125 to explain this difference of the column densities and showed that the absorption feature might be (partly) caused by an ambient medium surrounding RX J0720.43125 in distance from the NS, superimposed by absorption lines from the ISM. The model in Hambaryan et al. (2009) is also applicable to RX J1605.3+3249 and PSR B1055-52, since both NSs have temperatures and magnetic field strengths comparable to that of RX J0720.43125. However, circumstellar disks surrounding isolated NSs with ages of the order of million years should be rare. Thus, it is unlikely that three sources out of seven in our sample host a disk.
Regarding the equivalent widths and the significance of the detection, the strongest narrow absorption features are present in the spectra of RX J0720.43125 and RX J1605.3+3249. Both NSs are located outside the LB (Lallement et al. 2003), i.e. are embedded in a denser medium than in the solar vicinity. The LB hosts hot plasma containing highly ionised oxygen (Breitschwerdt & de Avillez 2006; Breitschwerdt et al. 2009), such as OVII or OVI that is in the line of sight to these NSs. In contrast, the closest NS, RX J1856.43754, is almost certainly located within the LB (the most recent parallax measurement yields a distance of , see Walter et al. 2010) towards the Galactic centre, i.e. embedded in a thin medium and therefore should not exhibit the narrow absorption feature.
The distance of RX J1308.6+2127 (RBS1223) is highly uncertain and ranges from (see Haberl 2007 and references therein), but this NS has a high Galactic latitude and is located either within the LB (for smaller distances), or above the Galactic plane. Even in the latter case, RX J1308.6+2127 is still surrounded by a low density medium (the local chimney, see Lallement et al. 2003 who shows the distribution of measured column densities). Therefore, also the spectra of RX J1308.6+2127 should not exhibit narrow absorption features.
Geminga and PSR B0656+14 are located at roughly the same region above the Galactic plane, probably within the local chimney (the distances range from 150 pc to 300 pc for both objects, see Caraveo et al. 1996; Brisken et al. 2003; Walter 2005), like in the case of RX J1308.6+2127. Both NSs do not exhibit narrow absorption features, although in the case of Geminga the count number of the co-added RGS spectrum is too low to allow a final statement.
Finally, the spectrum of PSR B1055-52 shows an uncertain absorption feature and this NS is likely located outside the LB and is probably the most distant object in our sample (Kramer
et al. 2003 estimated 750 pc from dispersion measurements).
If caused by the ISM, other X-ray sources (particularly much more distant) like e.g. Cyg X2 (Yao et al. 2009), LMXB GS 1826238 (Pinto et al. 2010, and other Galactic low-mass X-ray binaries; Yao &
Wang 2005) or Mrk 421 (Rasmussen et al. 2007; Kaastra
et al. 2006, with 955 ks exposure time) should exhibit similar absorption features. While the expected OVII resonance line at 573.95 eV of an interstellar origin is clearly visible (in particular in Kaastra
et al. 2006, Figure 2 therein and Rasmussen et al. 2007, Figure 1 therein), these sources do not show an absorption feature at 568.6 eV in their RGS spectra as detected in the case of RX J0720.43125. The line energy in the Chandra HRC-S/LETG spectra of RX J0720.43125 yields (Table 10), i.e. this value is almost compatible (within its errors) with the energy of the OVII resonance line at rest.
5 Conclusions
We investigated the co-added RGS spectra of the four brightest M7 (RX J0720.43125, RX J1308.6+2127/RBS1223, RX J1605.3+3249 and RX J1856.43754) and the 3M; Geminga, PSR B0656+14 and PSR B1055-52 and searched for narrow absorption features, in particular at 0.57 keV.
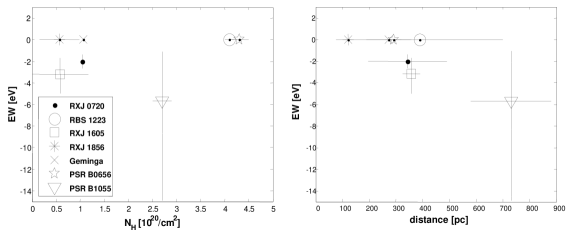
We find that those NSs, that are either nearby or located in a medium with low densities do not exhibit narrow absorption features, whereas those NSs, that are distant and surrounded by a dense medium do exhibit narrow absorption features. The equivalent widths of the narrow absorption features at 0.57 keV do not correlate with the value, and hardly correlate with the distances (Figure 10).
Other well investigated X-ray sources (Cyg X2 Yao et al. 2009, LMXB GS 1826238 Pinto et al. 2010, Mrk 421 Rasmussen et al. 2007; Kaastra
et al. 2006) do not exhibit an absorption feature at 568.6 eV as detected in the case of e.g. RX J0720.43125 (RGS). If this feature would have an origin in the NS atmosphere, the gravitational redshift and, thus, the compactness points either to a large radius and/or a small mass. However, we stress that the underlying atomic physics is not yet well understood for high magnetic field strengths.
Acknowledgments
The XMM-Newton project is supported by the Bundesministerium für Wirtschaft und Technologie/Deutsches Zentrum für Luft- und Raumfahrt (BMWI/DLR, FKZ 50 OX 0001) and the Max-Planck Society. MMH acknowledges support by the Deutsche Forschungsgemeinschaft (DFG) through SFB/TR 7 “Gravitationswellenastronomie”. We thank Valeri Hambaryan for fruitfull discussions, who encouraged us for this work, and the anonymous referee for helpfull comments.
References
- Anders & Grevesse (1989) Anders E., Grevesse N., 1989, GCA, 53, 197
- Becker & Truemper (1997) Becker W., Truemper J., 1997, A&A, 326, 682
- Bertsch et al. (1992) Bertsch D. L., Brazier K. T. S., Fichtel C. E., Hartman R. C., Hunter S. D., Kanbach G., Kniffen D. A., Kwok P. W., Lin Y. C., Mattox J. R., 1992, Nat, 357, 306
- Bignami et al. (1983) Bignami G. F., Caraveo P. A., Lamb R. C., 1983, ApJ, 272, L9
- Breitschwerdt & de Avillez (2006) Breitschwerdt D., de Avillez M. A., 2006, A&A, 452, L1
- Breitschwerdt et al. (2009) Breitschwerdt D., de Avillez M. A., Fuchs B., Dettbarn C., 2009, ssr, 143, 263
- Brisken et al. (2003) Brisken W. F., Thorsett S. E., Golden A., Goss W. M., 2003, ApJ, 593, L89
- Burwitz et al. (2003) Burwitz V., Haberl F., Neuhäuser R., Predehl P., Trümper J., Zavlin V. E., 2003, A&A, 399, 1109
- Burwitz et al. (2001) Burwitz V., Zavlin V. E., Neuhäuser R., Predehl P., Trümper J., Brinkman A. C., 2001, A&A, 379, L35
- Caraveo et al. (1996) Caraveo P. A., Bignami G. F., Mignani R., Taff L. G., 1996, ApJ, 461, L91+
- Caraveo et al. (2004) Caraveo P. A., De Luca A., Mereghetti S., Pellizzoni A., Bignami G. F., 2004, Science, 305, 376
- Cordova et al. (1989) Cordova F. A., Middleditch J., Hjellming R. M., Mason K. O., 1989, ApJ, 345, 451
- De Luca et al. (2005) De Luca A., Caraveo P. A., Mereghetti S., Negroni M., Bignami G. F., 2005, ApJ, 623, 1051
- de Vries et al. (2003) de Vries C. P., den Herder J. W., Kaastra J. S., Paerels F. B., den Boggende A. J., Rasmussen A. P., 2003, A&A, 404, 959
- de Vries et al. (2004) de Vries C. P., Vink J., Méndez M., Verbunt F., 2004, A&A, 415, L31
- den Herder et al. (2001) den Herder J. W., Brinkman A. C., Kahn S. M., et. al B., 2001, A&A, 365, L7
- Drake et al. (2002) Drake J. J., Marshall H. L., Dreizler S., Freeman P. E., Fruscione A., Juda M., Kashyap V., Nicastro F., Pease D. O., Wargelin B. J., Werner K., 2002, ApJ, 572, 996
- Eisenbeiss (2011) Eisenbeiss T., 2011, PhD Thesis, University Jena, Germany
- Evans (1997) Evans N. R., 1997, Chandra News, 5, 16
- Fierro (1993) Fierro 1993, ApJ, 413, L27
- Futamoto et al. (2004) Futamoto K., Mitsuda K., Takei Y., Fujimoto R., Yamasaki N. Y., 2004, ApJ, 605, 793
- Greiveldinger et al. (1996) Greiveldinger C., Camerini U., Fry W., Markwardt C. B., Oegelman H., Safi-Harb S., Finley J. P., Tsuruta S., Shibata S., Sugawara T., Sano S., Tukahara M., 1996, ApJ, 465, L35+
- Haberl (2007) Haberl F., 2007, AP&SS, 308, 181
- Haberl et al. (2003) Haberl F., Schwope A. D., Hambaryan V., Hasinger G., Motch C., 2003, A&A, 403, L19
- Haberl et al. (2006) Haberl F., Turolla R., de Vries C. P., Zane S., Vink J., Méndez M., Verbunt F., 2006, A&A, 451, L17
- Halpern & Ruderman (1993) Halpern J. P., Ruderman M., 1993, ApJ, 415, 286
- Halpern & Wang (1997) Halpern J. P., Wang F., 1997, ApJ, 477, 905
- Hambaryan et al. (2009) Hambaryan V., Neuhäuser R., Haberl F., Hohle M. M., Schwope A. D., 2009, A&A, 497, L9
- Hirata & Horaguchi (1995) Hirata R., Horaguchi T., 1995, Department of Astronomy, Faculty of Science, Kyoto University and National Science Museum
- Hohle et al. (2009) Hohle M. M., Haberl F., Vink J., Turolla R., Hambaryan V., Zane S., de Vries C. P., Méndez M., 2009, A&A, 498, 811
- Hohle et al. (2010) Hohle M. M., Haberl F., Vink J., Turolla R., Zane S., de Vries C. P., Méndez M., 2010, A&A, 521, A11+
- Jackson et al. (2002) Jackson M. S., Halpern J. P., Gotthelf E. V., Mattox J. R., 2002, ApJ, 578, 935
- Juda (1997) Juda J., 1997, Chandra News, 5, 20
- Juda (1996) Juda M., 1996, Chandra News, 4, 9
- Kaastra et al. (2009) Kaastra J. S., de Vries C. P., Costantini E., den Herder J. W. A., 2009, A&A, 497, 291
- Kaastra et al. (2006) Kaastra J. S., Werner N., Herder J. W. A. d., Paerels F. B. S., de Plaa J., Rasmussen A. P., de Vries C. P., 2006, ApJ, 652, 189
- Kaplan & van Kerkwijk (2005) Kaplan D. L., van Kerkwijk M. H., 2005, ApJ, 628, L45
- Kaplan & van Kerkwijk (2009) Kaplan D. L., van Kerkwijk M. H., 2009, ApJ, 705, 798
- Kaplan et al. (2007) Kaplan D. L., van Kerkwijk M. H., Anderson J., 2007, ApJ, 660, 1428
- Kondratiev et al. (2009) Kondratiev V. I., McLaughlin M. A., Lorimer D. R., Burgay M., Possenti A., Turolla R., Popov S. B., Zane S., 2009, ApJ, 702, 692
- Kraft et al. (1997) Kraft R. P., Chappell J. H., Kenter A. T., Kobayashi K., Meehan G. R., Murray S. S., Zombeck M. V., Fraser G. W., Pearson J. F., Lees J. E., Brunton A. N., Barbera M., Collura A., Serio S., 1997, in O. H. Siegmund & M. A. Gummin ed., Society of Photo-Optical Instrumentation Engineers (SPIE) Conference Series Vol. 3114 of Society of Photo-Optical Instrumentation Engineers (SPIE) Conference Series, Performance and calibration of the AXAF High-Resolution Camera II: the spectroscopic detector. pp 53–73
- Kramer et al. (2003) Kramer M., Bell J. F., Manchester R. N., Lyne A. G., Camilo F., Stairs I. H., D’Amico N., Kaspi V. M., Hobbs G., Morris D. J., Crawford F., Possenti A., Joshi B. C., McLaughlin M. A., Lorimer D. R., Faulkner A. J., 2003, MNRAS, 342, 1299
- Kuntz (2009) Kuntz K. D., 2009, in R. K. Smith, S. L. Snowden, & K. D. Kuntz ed., American Institute of Physics Conference Series Vol. 1156 of American Institute of Physics Conference Series, X-ray Evidence for the Local Hot Bubble. pp 3–15
- Lallement et al. (2003) Lallement R., Welsh B. Y., Vergely J. L., Crifo F., Sfeir D., 2003, A&A, 411, 447
- Manchester et al. (2005) Manchester R. N., Hobbs G. B., Teoh A., Hobbs M., 2005, VizieR Online Data Catalog, 7245, 0
- Marshall & Schulz (2002) Marshall H. L., Schulz N. S., 2002, ApJ, 574, 377
- Mori & Ho (2007) Mori K., Ho W. C. G., 2007, MNRAS, 377, 905
- Oegelman & Finley (1993) Oegelman H., Finley J. P., 1993, ApJ, 413, L31
- Paerels (1997) Paerels F., 1997, ApJ, 476, L47+
- Pavlov et al. (2002) Pavlov G. G., Zavlin V. E., Sanwal D., 2002, in W. Becker, H. Lesch, & J. Trümper ed., Neutron Stars, Pulsars, and Supernova Remnants Thermal Radiation from Neutron Stars: Chandra Results. pp 273–+
- Pinto et al. (2010) Pinto C., Kaastra J. S., Costantini E., Verbunt F., 2010, A&A, 521, A79+
- Posselt et al. (2009) Posselt B., Neuhäuser R., Haberl F., 2009, A&A, 496, 533
- Posselt et al. (2007) Posselt B., Popov S. B., Haberl F., Trümper J., Turolla R., Neuhäuser R., 2007, AP&SS, 308, 171
- Possenti et al. (1996) Possenti A., Mereghetti S., Colpi M., 1996, A&A, 313, 565
- Rasmussen et al. (2007) Rasmussen A. P., Kahn S. M., Paerels F., Herder J. W. d., Kaastra J., de Vries C., 2007, ApJ, 656, 129
- Sarazin & Bahcall (1977) Sarazin C. L., Bahcall J. N., 1977, ApJ, 216, L67
- Schwope et al. (2007) Schwope A. D., Hambaryan V., Haberl F., Motch C., 2007, AP&SS, 308, 619
- Shelton (2009) Shelton R. L., 2009, ssr, 143, 231
- Stairs (2006) Stairs I. H., 2006, Journal of Physics G Nuclear Physics, 32, 259
- Tetzlaff et al. (2010) Tetzlaff N., Neuhäuser R., Hohle M. M., Maciejewski G., 2010, MNRAS, 402, 2369
- van Kerkwijk et al. (2004) van Kerkwijk M. H., Kaplan D. L., Durant M., Kulkarni S. R., Paerels F., 2004, ApJ, 608, 432
- van Kerkwijk et al. (2007) van Kerkwijk M. H., Kaplan D. L., Pavlov G. G., Mori K., 2007, ApJ, 659, L149
- Walter (2005) Walter F. M., 2005, in Neutron Stars at the Crossroads of Fundamental Physics On the Parallax of Geminga
- Walter et al. (2010) Walter F. M., Eisenbeiss T., Lattimer J. M., Kim B., Hambaryan V., Neuhaeuser R., 2010, ArXiv e-prints
- Yao et al. (2009) Yao Y., Schulz N. S., Gu M. F., Nowak M. A., Canizares C. R., 2009, ApJ, 696, 1418
- Yao & Wang (2005) Yao Y., Wang Q. D., 2005, ApJ, 624, 751