Measurement of the Cross Section in TeV pp Collisions with the ATLAS Detector
Abstract
We report a measurement of the production cross section in collisions at 7 . The leptonic decay channels are analyzed using data corresponding to 1.02 of integrated luminosity collected by the ATLAS detector during 2011 at the CERN Large Hadron Collider. With 414 observed candidate events and an estimated background of 17028 events, the measured production cross section is pb, in agreement with the Standard Model NLO prediction of 463 pb.
I Introduction
The measurement of the production cross section at the LHC provides an important test of the Standard Model (SM) through the sensitivity to the triple gauge boson couplings that result from the non-Abelian structure of the gauge symmetry group, . Furthermore, non-resonant production is an irreducible background in searches for the Higgs boson in the same final state. Understanding the detection sensitivity of ATLAS to -pair production is crucial for Higgs boson searches. The WW cross section has been measured at LHC with the ATLAS detector using limited statistics based on 2010 data (34 ) atlas-ww2010 , this paper presents new results with 1.02 integrated luminosity collected in 2011.
Candidate events are reconstructed in the leptonic decay channels, , where is an electron or muon. Sequential decays to electrons and muons via leptons are also included as signal: . The resulting final state has two high-transverse-momentum (high-) charged leptons and substantial transverse momentum imbalance in the final state (referred to as missing transverse energy below) due to the neutrinos or antineutrinos escaping detection. The major backgrounds for this final state are Drell-Yan, top quark, jet and diboson (, and ) production.
II The ATLAS detector and data sample
The ATLAS detector detectorpaper is a multipurpose particle physics apparatus with nearly 4 solid angle coverage. ATLAS uses a right-handed coordinate system with its origin at the nominal interaction point (IP) in the centre of the detector and the -axis along the beam pipe. The -axis points from the IP to the centre of the LHC ring, and the axis points upward. Cylindrical coordinates are used in the transverse plane, being the azimuthal angle around the beam pipe. The pseudorapidity is defined in terms of the polar angle as . Closest to the beamline are inner tracking detectors which use layers of silicon-based and straw-tube detectors, located inside a thin superconducting solenoid that provides a 2T magnetic field, to measure the trajectories of charged particles within . The solenoid is surrounded by a hermetic calorimeter system. A liquid argon (LAr) sampling calorimeter is divided into a central barrel calorimeter and two end-cap calorimeters, each housed in a separate cryostat. Fine-grained LAr electromagnetic (EM) calorimeters, with excellent energy resolution, provide coverage for 3.2. An iron-scintillator tile calorimeter provides hadronic coverage in the range 1.7. In the end-caps (1.5), LAr hadronic calorimeters match the outer limits of the end-cap EM calorimeters. LAr forward calorimeters provide both EM and hadronic energy measurements, and extend the coverage to 4.9. Outside the calorimeters is an extensive muon spectrometer in a toroidal magnetic field, providing precise muon measurements within 2.7. The muon trigger system covers the range 2.4.
A three-level trigger system is used to select interesting events in real time. The electron trigger selects electrons that deposit at least 20 GeV of transverse energy in the calorimeter. The muon trigger requirement consists of a logical OR between a trigger that requires a muon detected with a transverse momentum of at least 18 GeV and a looser quality trigger that requires a muon of at least 40 GeV in the barrel section of the muon spectrometer. The data used for this analysis were recorded up to June 2011 and correspond to an integrated luminosity of 1.02 fb-1. The luminosity is determined with a relative uncertainty of 3.7% using van der Meer scans ATLAS-CONF-2011-011 .
Monte Carlo simulation samples are used to develop and validate the analysis procedures, to calculate the acceptance for events and to evaluate the contributions from some background processes.
For the signal, we use the next-to-leading order (NLO) generator MC@NLO MCatNLO in conjunction with the CTEQ6.6 CTEQ66 parton distribution functions (PDF). Herwig herwig is used for leptonic decays and for the parton shower simulation and hadronization. Jimmy Jimmy is used for the underlying event simulation. In addition, the gg2ww Binoth:2006mf MC generator (interfaced to Herwig and Jimmy) is used to simulate the events from the gluon-gluon fusion process.
The Drell-Yan and the jets backgrounds are generated with Alpgen. The top ( and ) and diboson ( and ) backgrounds are modeled with MC@NLO interfaced to the Herwig and Jimmy programs. The single top background samples are produced with the AcerMC generator AcerMC . is modeled using Pythia/MadGraph Alwall:2007st , and hadronic multi-jet backgrounds with the Pythia generator.
The detector response for all the generated MC events is simulated by passing them through a detailed simulation simulation of the ATLAS detector based on the GEANT4 program Geant4 . These simulated data samples are then reconstructed, selected, and analyzed as it is done for the data.
III Object reconstruction
Brief descriptions of the relevant physics objects used in this analysis are given in this section. These objects are the collision vertices, electrons, muons, missing transverse energy, and hadronic jets.
The collision vertices in each bunch crossing are reconstructed using the inner tracking system. To remove cosmic-ray and beam-induced backgrounds, we require the primary vertex to have three or more tracks.
Electron candidates are formed by matching a cluster of energy in the electromagnetic calorimeter to a charged track found in the inner tracking system. In this analysis, we use electrons with or , which avoids the transition region between the barrel and the end-cap electromagnetic calorimeters.
We use the ATLAS “tight” electron identification criteria atlas-winclusive . The of the leading electron in the channel and the of the electron in the channel are required to exceed 25 GeV. The sub-leading in the channel must be greater than 20 GeV. The isolation requirement is that the sum of the energy in the calorimeter cells within a cone of 0.3 around the electron, excluding the energy in the electron cluster and after corrections for leakage and pileup effects, must be less than 4 GeV. In addition, the longitudinal impact parameter of the track relative to the primary vertex must be smaller than 10 mm, and the transverse impact parameter significance must be less than 10, where and are the transverse impact parameter relative to the primary vertex and its uncertainty, respectively. The electron identification efficiency is measured in data using control samples of and events. The overall electron selection efficiency in this analysis is about 78% for the central region (), and decreases to about 64% in the endcap region ().
Muons are reconstructed using information from the muon spectrometer, the inner tracking detectors, and the calorimeters. The absolute value of the pseudorapidity of the combined muon is required to be less than 2.4. The muon transverse momentum measured by combining information from the muon spectrometer and inner detector systems must be greater than 20 GeV. To suppress muons originating from hadronic jets, the muons must be isolated such that the sum of other tracks in a cone of = 0.2 around the muon track divided by the muon is less than 0.1. The muon reconstruction and identification efficiencies are measured using candidates in data. The overall muon reconstruction efficiency is found to be 92.8% 1.0% (syst) in data with negligible statistical uncertainty.
Jets are reconstructed from calorimeter clusters using the anti- algorithm antikt-jet ; Cacciari:2005hq ; Fastjet with a jet resolution parameter of . These jets are calibrated using - and -dependent correction factors ATLAS-CONF-2011-032 based on MC simulation, and validated by extensive test beam and collision data. The selected jets are required to have GeV and . The jet energy scale uncertainty depends on and and ranges from 2% - 8% for GeV and due to calibration ATLAS-CONF-2011-032 .
The missing transverse energy is reconstructed using calorimeter energies from clusters in the detection range and muon momenta measured by the muon spectrometer and inner detector. The mis-measured energies of leptons or jets can produce false . To reduce the rate of backgrounds that arise from these mis-measurements, particularly the Drell-Yan background, we use a relative missing transverse energy (), which is defined as the following:
| (1) |
where is the difference in the azimuthal angle between the and the nearest lepton or jet. The asymmetric requirement on helps to optimize the WW detection significance. This requirement also reduces the background from , where the real from the semileptonic decays is parallel to the momenta of the leptons.
IV Event selection
Di-lepton events are selected using the lepton identification requirements described in the previous section. For each di-lepton final state (, or , or ), we require each electron (or muon) to have (or ) 20 GeV, and we require exactly two leptons with opposite charges. The electron in the channel and the leading electron in the channel must have GeV. Both leptons are required to originate from the primary vertex. At least one of the selected leptons is required to have fired its corresponding trigger (“trigger matching”). The leptons must also have a minimum separation (effectively imposed by the lepton isolation requirement) in space of in the channel and in the and the channels.
To reduce the Drell-Yan background and the background from hadronic multi-jets, the invariant mass of the dilepton pair ( or ) is required to exceed 15 GeV and is not allowed to be within 15 GeV of the -mass. In addition, the invariant mass of the dilepton pair ( or ) is required to exceed 10 GeV.
As shown in Fig. 1, further suppression of the remaining Drell-Yan and other backgrounds is achieved by requiring 40 GeV for the channel, 45 GeV for the channel and 25 GeV for the channel. To optimize the signal to background ratio, different cuts are chosen for the different channels. The figure shows the distribution prior to applying the jet-veto selection criteria for the , and channels.
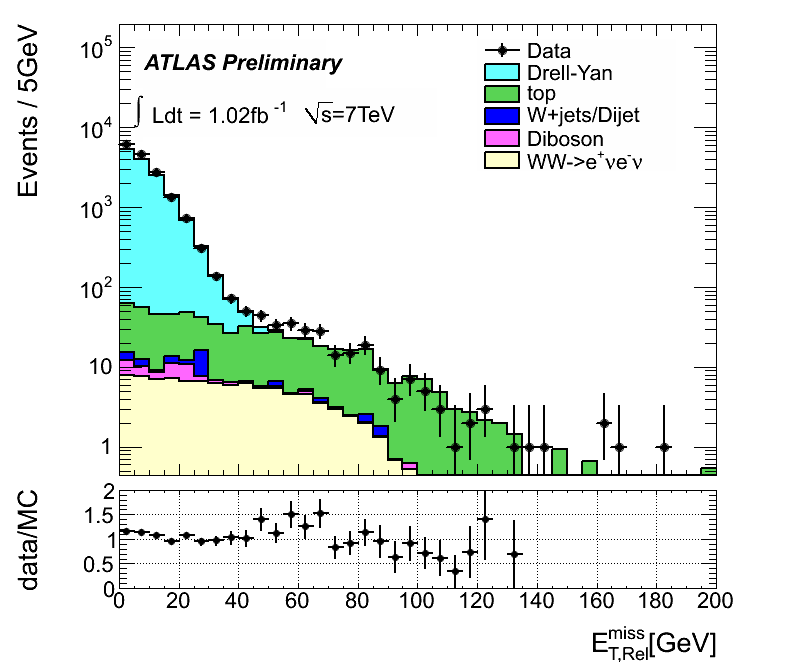
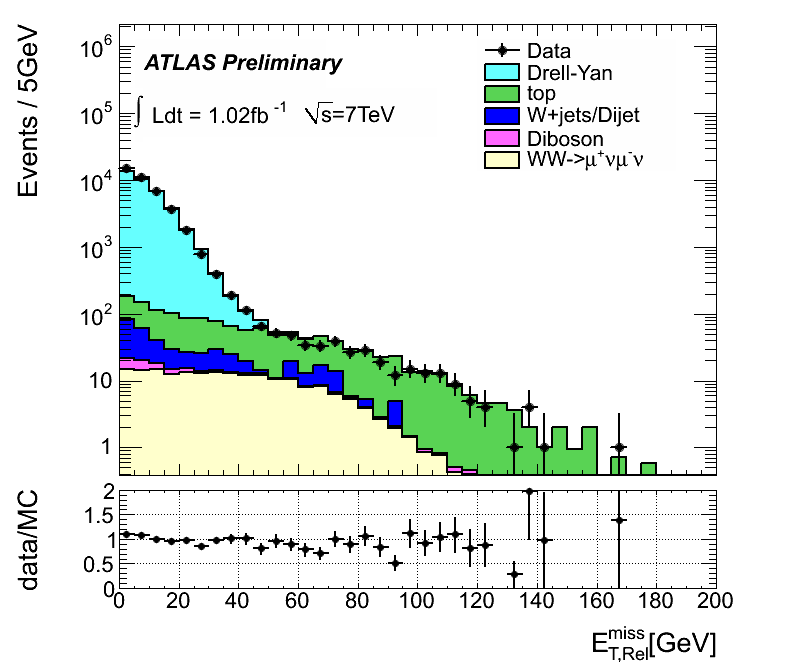
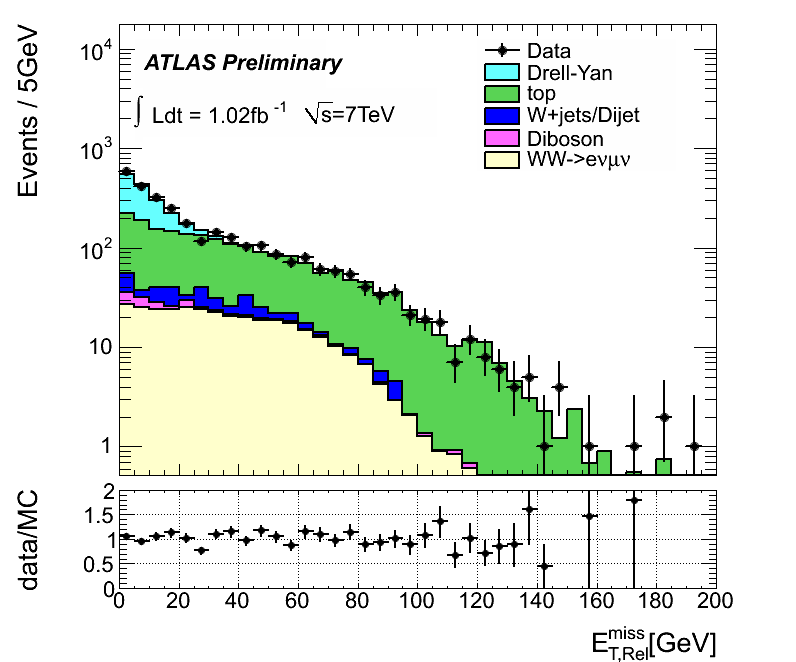
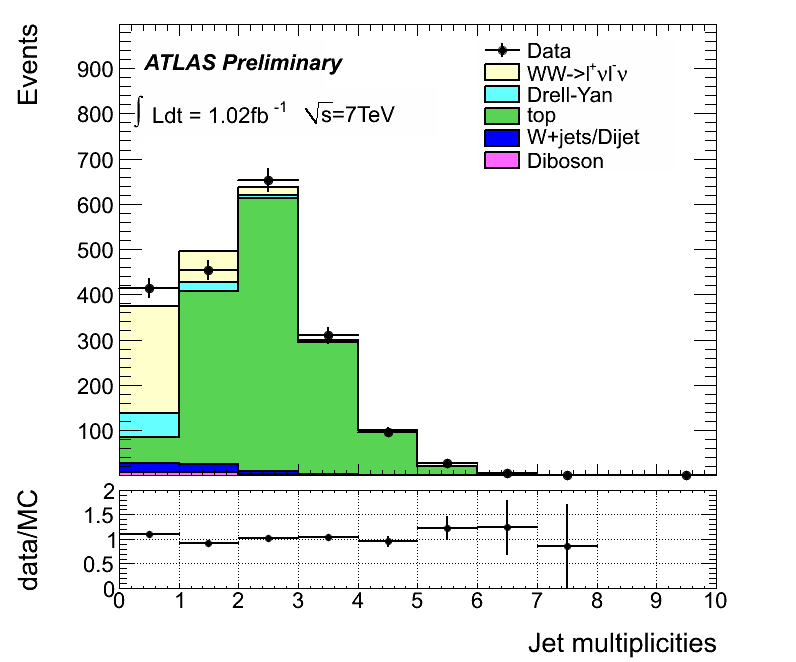
Suppression of the top background is accomplished by rejecting events containing jets with GeV and (the jet-veto requirement). Figure 1 shows that the majority of the signal is in the zero-jet bin of the jet multiplicity distribution, while the top events populate the higher jet multiplicity bins.
After all the selection criteria are applied to the di-lepton samples, 414 candidate events remain: 74 in the channel, 97 in the channel, and 243 in the channel.
The signal acceptance is one of the key ingredients for determining the cross section. Determining this acceptance relies on detailed MC signal modeling and event selection efficiency corrections using control data samples. These corrections differ by at most a few percent from unity, indicating the inherent accuracy of the simulation. Detailed information on the event selection acceptance is provided below. Table 1 shows the number of MC events passing each selection cut for the three di-lepton channels. The MC events shown in the table are normalized to 1.02 fb-1 using the SM production cross sections with and initial states. In order to minimize the systematic uncertainty due to initial state radiation (ISR) and jet-energy scale, we use control samples of data and MC to determine the jet-veto efficiency correction factor to the selection Campbell:2009kg : with (syst). The two efficiency numbers, and , are the fraction of the events with zero jets found in data and MC, respectively. The main contributions to the given systematic uncertainty are due to factorisation and renormalisation scale choice evaluated using MC@NLO and MCFM MCFM . The overall event selection acceptances for signal events are 5.0% for , 8.9% for , and 12.6% for events. The contributions from are less than 8% of the final selected signal events in all three di-lepton channels. The overall systematic uncertainty in the selection acceptance is 6.8% for the combination of the three di-lepton channels. This overall uncertainty includes the uncertainties due to lepton identification (4.2%), the jet-veto (4.8%), the uncertainty (2.2%) and the uncertainties of the PDFs used in MC modeling (1.3%). The PDF uncertainty includes the error matrices of the CTEQ6.6 PDF sets and the differences between the CTEQ6.6 and the MSTW MSTW PDF sets.
| Cuts | Channel | Channel | Channel | |||
|---|---|---|---|---|---|---|
| Total Events | 552.3 | 211.4 | 552.3 | 211.4 | 1104.5 | 423.1 |
| 2 leptons (SS+OS) | 116.6 | 11.8 | 229.0 | 25.5 | 332.7 | 35.5 |
| 2 leptons (OS) | 115.7 | 11.6 | 229.0 | 25.5 | 331.3 | 35.3 |
| leading electron Pt 25GeV | 114.4 | 11.4 | - | - | 305.5 | 30.2 |
| trigger matching | 114.2 | 11.4 | 231.9 | 25.8 | 305.3 | 30.2 |
| 15 GeV, 10 GeV | 113.5 | 11.3 | 229.7 | 25.6 | 304.5 | 30.1 |
| Z mass veto | 88.2 | 8.4 | 176.6 | 19.0 | - | - |
| cut | 38.6 | 2.9 | 69.7 | 5.2 | 193.2 | 16.1 |
| Jet veto (No. of Jet=0) | 27.8 | 1.7 | 49.4 | 3.1 | 139.6 | 10.9 |
| Acceptance | 5.0% | 0.8% | 8.9% | 1.5% | 12.6% | 2.6% |
The systematic uncertainties on the signal acceptance are summarized in Table 2, which gives the sources and associated uncertainties in signal acceptance for the , and channels.
| Sources | |||
|---|---|---|---|
| Luminosity | 3.7% | 3.7% | 3.7% |
| Cross-section (theory) | 5% | 5% | 5% |
| 1.2% | 1.4% | 1.4% | |
| Trigger | 1.0% | 1.0% | 1.0% |
| Lepton smearing | 0.2% | 0.1% | 0.1% |
| Reco eff. scale factors | 1.4% | 0.0% | 0.7% |
| / scale correction | 0.9% | 0.0% | 0.4% |
| Particle ID eff. scale factors | 3.3% | 1.4% | 1.6% |
| Isolation | 4.0% | 2.0% | 3.0% |
| in-time contribution | 3.5% | 3.9% | 1.4% |
| out-of-time contribution | 0.5% | 0.5% | 0.3% |
| Jet-veto | 4.8% | 4.8% | 4.8% |
| Total experimental uncertainty | 8.1% | 6.7% | 6.2% |
| Overall uncertainty | |||
| for WW signal estimation | 10.3% | 9.2% | 8.9% |
V Background estimation
The main backgrounds for the signal come from Drell-Yan events, top ( and single top), jets, and diboson (, , and ) production, as described in this section.
Drell-Yan events (), like events, produce two high leptons. Much of this background is removed by the di-lepton invariant mass cuts and cuts. Given the relatively large cross section of the Drell-Yan process, it contributes a non-negligible background to the signal due to energy/momentum mis-measurements of the two leptons or as a result of hadronic activity in the rest of the event. Extra pileup collisions are a significant contribution to this hadronic activity.
The Drell-Yan backgrounds are determined from MC events generated with Alpgen and passed through the ATLAS detector simulation. The systematic uncertainties are determined using a data-driven method which compares the distributions in data and MC within the peak region. The distributions are found to be consistent within statistical uncertainties. As a conservative estimate of the systematic, the observed difference is added in quadrature with the statistical uncertainty. This systematic uncertainty is applied to the background predictions from MC. With the assumptions that the mechanism that causes a discrepancy between data and MC is independent of the invariant mass of the two leptons, and that any discrepancy between data and MC is caused by a mis-modeling of the Drell-Yan sample, a systematic uncertainty of 10.4% for the Drell-Yan background estimation from the MC simulation is determined. The estimated Drell-Yan backgrounds together with statistical and systematic uncertainties are shown in Table 3.
After removing the largest background from events in di-lepton samples, the dominant background is from and , followed by the leptonic decays of two real bosons. This background can be effectively suppressed by requiring that there are no jets with GeV and . However, some top events containing only jets with less than 30 GeV can still mimic the SM events.
The top backgrounds in the final selection are estimated using a data driven method which is cross-checked with the Monte Carlo simulation. In this method, the top background in the zero jet bin is estimated using the number of observed events in the -jet bins (where ) in data and the ratio of zero-jet events over the number of -jet events in MC, The uncertainties on luminosity and on the top cross sections cancel out in the MC ratio. A second method uses a top control sample selected using -tagging to estimate the top contribution. Both data-driven methods give top background yields consistent with MC and with each other. The final top background estimated is (stat)(syst) events, the systematic uncertainty is dominated by the jet-energy scale uncertainty (37%).
bosons produced in association with a hadronic jet give rise to backgrounds when the jet is misidentified as a lepton. The rate at which hadronic jets are misidentified as leptons may not be accurately described in the MC. The jets background is therefore determined from data. The jet background is estimated by defining a control region, similar to the signal selection, that is enriched in W+jet events. The jet control region is defined using an alternative lepton definition that is rich in hadronic jets. Jet-rich electrons are defined as isolated electromagnetic clusters matched to a track in the inner detector that fail the medium atlas-winclusive electron identification requirements. Jet-rich muons are defined as “combined” muons that pass a looser isolation requirement and fail the muon selection. Events containing one fully identified lepton and a jet passing this jet-rich lepton definition are selected. These events are then required to pass the full event selection, where the jet is treated as if it were a fully identified lepton. The jets background is estimated by scaling the control sample () by a measured fake factor. The fake factor () is defined as the ratio of the rate at which jets satisfy the full lepton identification to the rate at which they satisfy the jet-enriched lepton selection. The fake factor is measured in a di-jet data sample, parametrized as a function of lepton , and is found to be 0.02 (0.25) for electrons (muons) in the 30-40 GeV region. The jets background is determined as . Samples with same sign di-leptons are also enhanced in jets events and are used as a control sample, with looser lepton identification, to cross check the method described above. The jets prediction based on the fake factor method agrees well with the observed same sign di-lepton data. The jets background estimation in the signal region is given in Table 3 for the three di-lepton channels. The statistical uncertainty is due to the limited statistics in the jet control regions. The systematic uncertainty is due to the uncertainty on the determination of . The uncertainty on is about 30% for both electrons and muons, and is determined by the measured variations of in different run periods and in data samples containing jets of different energies. The assigned systematic uncertainty covers variation of the quark/gluon composition of the jets in the jet data sample compared to jets in the jets sample, and the effects of changing instantaneous luminosity on . The total jets contribution to the final selected candidate events is estimated to be (stat)(syst).
Other backgrounds to originate from the diboson processes , and . The leptonic decays of and events can mimic the signal when one or more of the charged leptons is not reconstructed and instead contributes to . The process is suppressed by the veto cut. The process is a background only for the and channels, since the probability for a photon to be misidentified as a muon is negligible. These diboson background contributions are estimated using MC simulations (MC@NLO for , Pythia for and Pythia/MadGraph for ). The total diboson background contribution is estimated to be 6.8 0.4 (stat) 0.8 (syst) events for 1.02 fb-1 of integrated luminosity. The quoted systematic uncertainty includes uncertainties in the luminosity (3.7%), the SM diboson cross-sections (5%), the jet veto efficiency (9.6%), the di-lepton trigger and identification efficiencies (4.5%) and uncertainty (2.2%). The hadronic dijets background contribution is negligible in the signal region as determined by Pythia MC and cross-checked by data.
VI WW Production and Fiducial Cross Sections
The observed and expected number of events after applying all selection cuts are shown in Table 3. Both statistical and systematic uncertainties are given for all three di-lepton channels in the table.
| Final State | Combined | |||
|---|---|---|---|---|
| Observed Events | 74 | 97 | 243 | 414 |
| Background estimations | ||||
| Top(data-driven) | 9.50.33.6 | 12.3 0.44.7 | 36.81.314.0 | 58.62.122.3 |
| W+jets (data-driven) | 5.30.41.7 | 12.42.95.2 | 32.93.89.2 | 50.54.814.7 |
| Drell-Yan (MC/data-driven) | 18.71.91.9 | 19.21.72.1 | 16.02.81.7 | 54.03.7 4.5 |
| Other dibosons (MC) | 0.90.10.1 | 2.40.20.3 | 3.40.30.4 | 6.80.40.8 |
| Total Background | 34.42.04.4 | 46.33.47.3 | 89.14.916.8 | 169.86.427.1 |
| Expected Signal | 29.50.33.0 | 52.50.44.9 | 150.50.713.4 | 232.40.921.5 |
| Significance () | 5.0 | 7.7 | 15.9 | 17.8 |
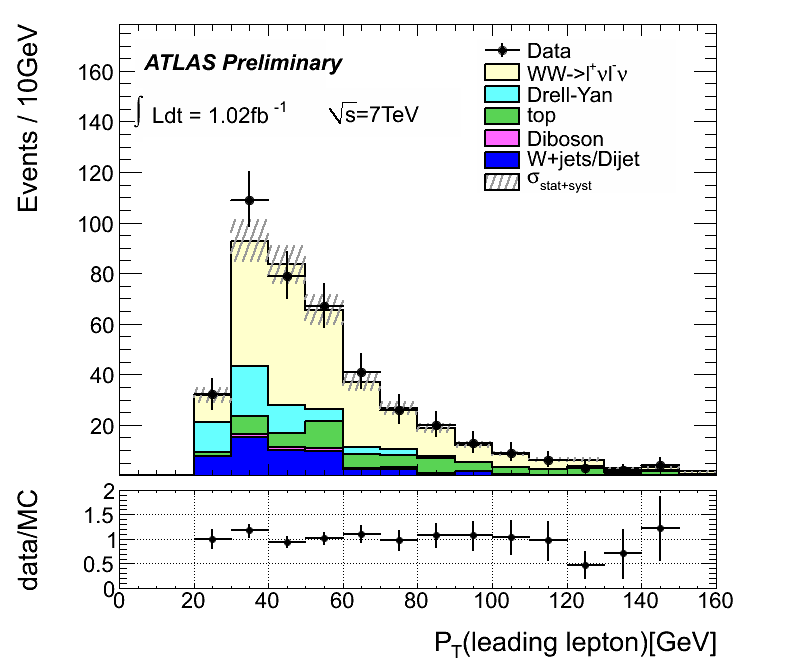
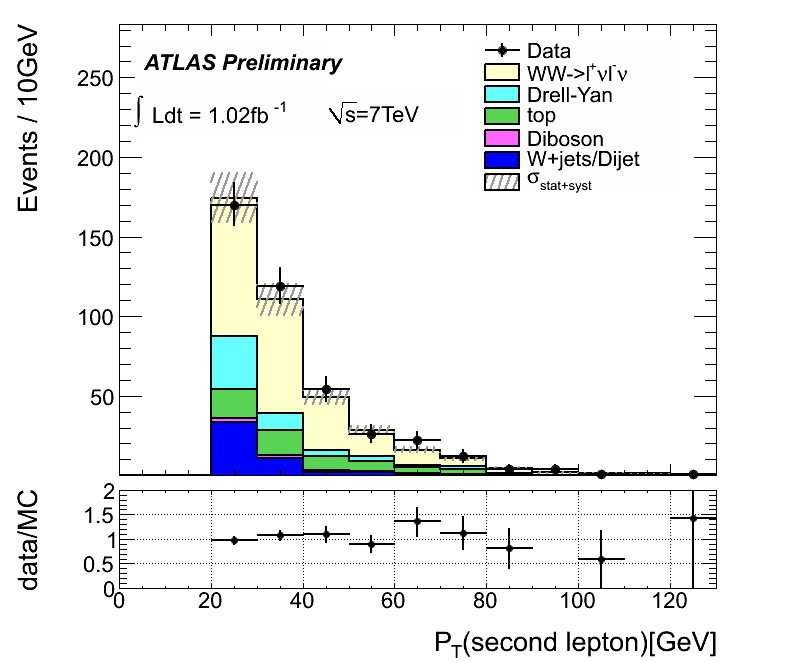
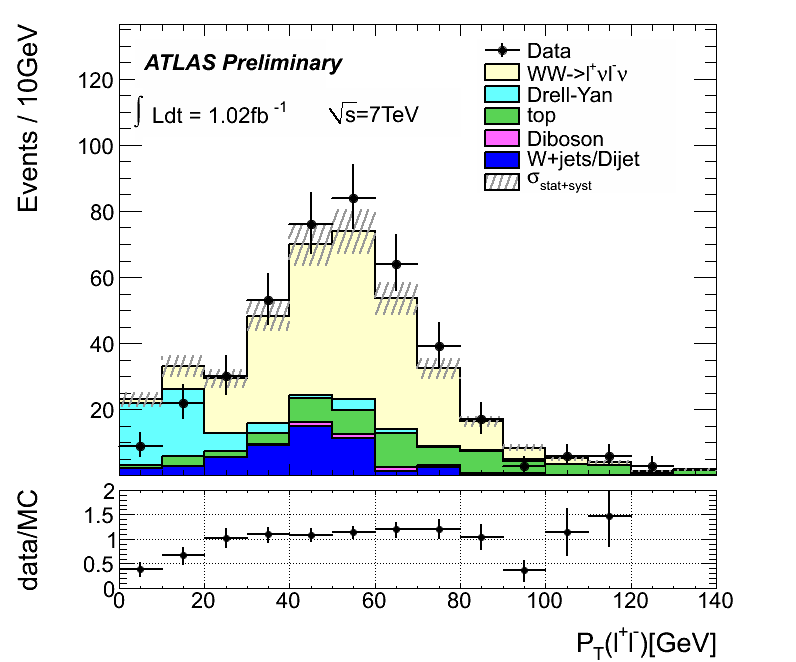
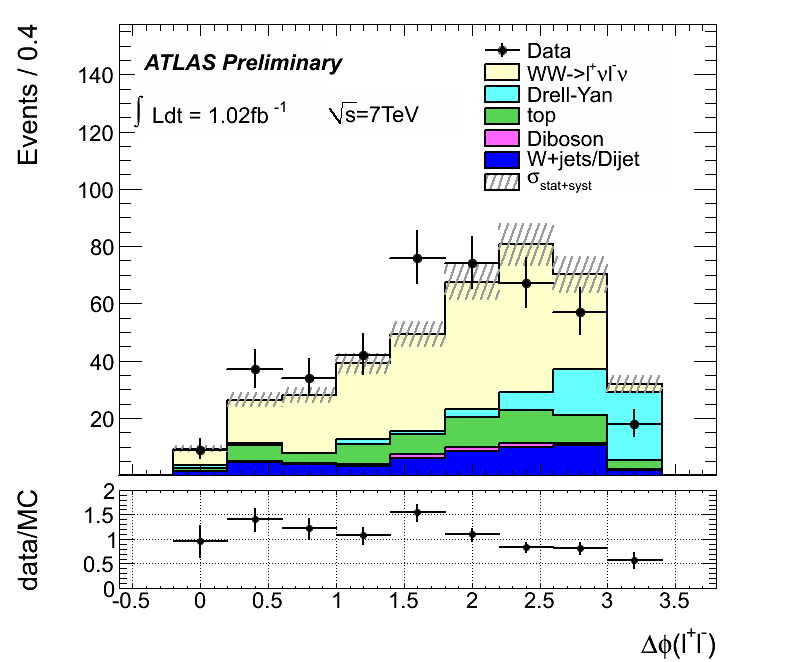
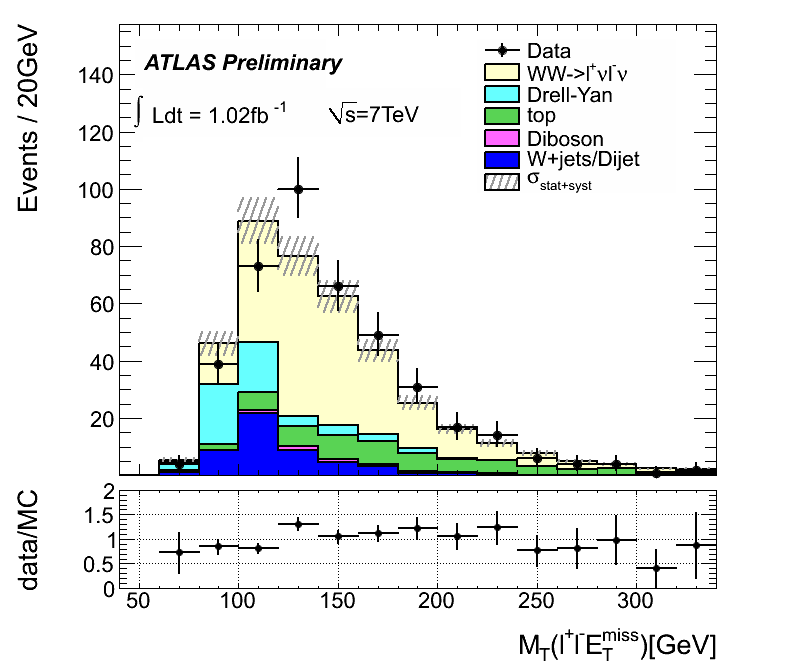
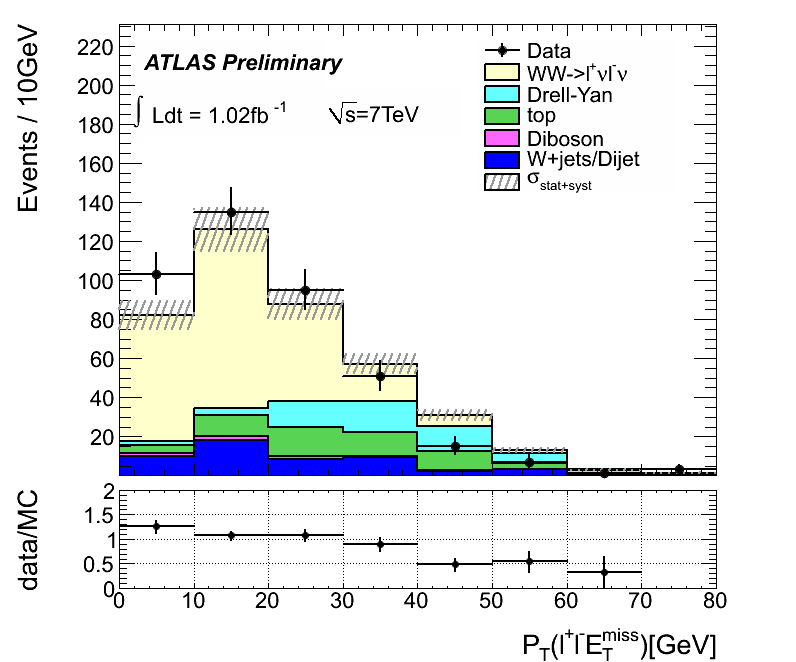
The kinematic distributions of the final candidates together with the predicted signal and estimated background are shown in Figures 2. The distributions of transverse mass and transverse momentum of the di-lepton plus system, where and denote transverse energies and momenta for leptons, and and denote missing transverse energy and momentum in the event. The MC distributions in these plots are normalized to the integrated luminosity of 1.02 and the SM cross sections with event selection acceptance. The data agree reasonably well with the estimated signal and background.
The total and fiducial production cross sections are determined from the three dilepton channels (, and ) by maximizing the log-likelihood functions shown in Equation 2 and 3, respectively:
| (2) |
| (3) |
where runs over the three dilepton channels. , and represent the SM expected signal, estimated background events and observed data events for the -th dilepton channel while is the branching ratio (including the contribution via decays) and is the total integrated luminosity. The overall correction factor required to evaluate the fiducial cross section is defined as , and takes into account the detector resolution, efficiency and background corrections relating the reconstructed event selection to the true particle-level phase space region defining the cross section. The overall detector acceptance described in the total cross section measurement section relates the fiducial phase space acceptance and the correction factor : Table 1 gives the overall efficiencies for prompt , and decays from . It also gives the detection efficiencies involving the electron or muon decay from s.
The mean values of the total cross sections obtained from the log-likelihood maximization are listed in Table 4, and they are consistent with the SM NLO prediction for production of 463 pb. The statistical uncertainty is determined from the likelihood fit, and the systematic uncertainty of our measurement is 13.4%, which includes the signal acceptance uncertainty () of 6.8% and the uncertainty on the background estimation () of 11.5%. The systematic error is calculated using error propagation: The systematic uncertainties on the cross section measurements from each dilepton channel are listed in Table 4. The luminosity contributes 3.7% systematic uncertainty to the cross-section measurements and it is listed separately in the table. By combining all three dilepton channels, the statistical error (8.3%) is smaller than the systematic uncertainty (13.4%) in this measurement.
| Channels | Total cross-section (pb) | (pb) | (pb) | (pb) |
|---|---|---|---|---|
| 62.1 | 13.5 | 9.1 | 2.3 | |
| 44.7 | 8.7 | 7.7 | 1.7 | |
| 47.3 | 4.8 | 6.2 | 1.8 | |
| Combined | 48.2 | 4.0 | 6.4 | 1.8 |
In order to minimize the extrapolation from the measured to the theoretical cross section, the fiducial phase space is defined using WW selection cuts on MC truth information. denotes the acceptance for the decays under consideration (including decays), defined as the fraction of decays satisfying the geometrical and kinematical constraints at the generator level (fiducial acceptance). It is defined here after the decay leptons emit photons via QED final state radiation; photons within a cone are added back to the decay leptons (“dressed” leptons). denotes the ratios between the total number of generated events which pass the final selection requirements after reconstruction and the total number of generated events within the fiducial acceptance. This corrections factor includes the efficiencies for triggering, reconstructing, and identifying the decays falling within the acceptance. The systematic uncertainty of is about 6.9%. It includes the parton distribution function uncertainty (1.2% for , 1.4% for and ), the renormalization and factorization scales uncertainty (5.3% for , 4.4% for and 1.5% for ) and the uncertainty due to the parton shower/fragmentation modeling difference between MC@NLO and MCFM NLO MC generators (4.8%). The MC scale uncertainty was evaluated using MC samples where the normalization and the factorization scales were changed to one half and to twice their nominal value.
The overall event selection efficiency can be presented as . Using the overall efficiencies for different channels shown in Table 1, we can determine the once the are determined. The systematic uncertainties from various sources for are listed in Table 2. The systematic uncertainty associated with the jet-veto cut, 4.8%, is replaced by a 4.5% JES uncertainty term. The systematic uncertainty on related to changes in the normalization and factorization scales is 1.9% in the channel, 2.9% in the channel, and 5.1% in the channel. A total cross section measurement requires the evaluation of the systematic on , for which the systematics on and partially overlap. Table 5 gives the fiducial phase space acceptance and the correction factor for all three dilepton channels.
| Channels | |||
|---|---|---|---|
| Channels | expected (fb) | measured (fb) | (fb) | (fb) | (fb) |
|---|---|---|---|---|---|
| 66.8 | 90.1 | 18.9 | 11.3 | 3.3 | |
| 63.8 | 62.0 | 12.1 | 10.7 | 2.3 | |
| 245.1 | 252.0 | 24.6 | 29.4 | 9.3 |
VII Summary
The production cross section in collisions at is measured using three leptonic decay channels and 1.02 of data collected by the ATLAS detector during 2011. A total of 414 candidates are selected with an estimated background of 17028 events. The measured cross section is pb, consistent with the SM NLO prediction of pb.
Acknowledgements.
The author would like to thank CERN for the very successful operation of the LHC and the ATLAS Collaboration for excellent work on the Monte Carlo simulation and the software package for physics analysis. The author is supported by the Department of Energy (DE-FG02-95ER40899) of the United States.References
- (1) ATLAS Collaboration, Phys. Rev. Lett. 107, 041802 (2011).
- (2) ATLAS Collaboration, JINST 3 (2008) S08003.
- (3) ATLAS Collaboration, ATLAS-CONF-2011-011.
- (4) S. Frixione and B. R. Webber, JHEP 06 (2002) 029, hep-ph/0204244.
- (5) P. M. Nadolsky et al., Phys. Rev. D78 (2008) 013004, arXiv:0802.0007 [hep-ph].
- (6) G. Corcella et al., JHEP 0101 (2001) 010, arXiv:hep-ph/0011363.
- (7) J. M. Butterworth et al., Z. Phys. C72 (1996) 637–646.
- (8) T. Binoth, M. Ciccolini, N. Kauer, and M. Kramer, JHEP 12 (2006) 046, arXiv:hep-ph/0611170.
- (9) T. Sjostrand et al., Comput. Phys. Commun. 135 (2001) 238–259, arXiv:hep-ph/0010017.
- (10) B. P. Kersevan and E. Richter-Was, arXiv:hep-ph/0405247.
- (11) J. Alwall et al., JHEP 09 (2007) 028, arXiv:0706.2334 [hep-ph].
- (12) ATLAS Collaboration, Eur.Phys.J. C70 (2010) 823–874, arXiv:1005.4568 [physics.ins-det].
- (13) S. Agostinelli et al., GEANT4: A Simulation toolkit, Nucl.Instrum.Meth. A506 (2003) 250–303.
- (14) ATLAS Collaboration, JHEP 12 (2010) 060, arXiv:1010.2130 [hep-ex].
- (15) M. Cacciari, G. P. Salam, and G. Soyez, JHEP 04 (2008) 063, arXiv:0802.1189 [hep-ph].
- (16) M. Cacciari and G. P. Salam, Phys. Lett. B641 (2006) 57–61, arXiv:hep-ph/0512210.
- (17) M. Cacciari, G. P. Salam, G. Soyez, http://fastjet.fr/.
- (18) ATLAS Collaboration, ATLAS-CONF-2011-032.
- (19) J. M. Campbell et al., Phys. Rev. D80 (2009) 054023, arXiv:0906.2500 [hep-ph].
- (20) J. M. Campbell and R. K. Ellis, Phys. Rev. D62 (2000) 114012, arXiv:hep-ph/0006304.
- (21) A. D. Martin et.al., Eur. Phys. J. C63 (2009) 189–285, arXiv:0901.0002 [hep-ph].