The SAURON Project - XX. The Spitzer [3.6] - [4.5] colour in early-type galaxies: colours, colour gradients and inverted scaling relations
Abstract
We investigate the [3.6] - [4.5] Spitzer-IRAC colour behaviour of the early-type galaxies of the SAURON survey, a representative sample of 48 nearby ellipticals and lenticulars. We investigate how this colour, which is unaffected by dust extinction, can be used to constrain the stellar populations in these galaxies.
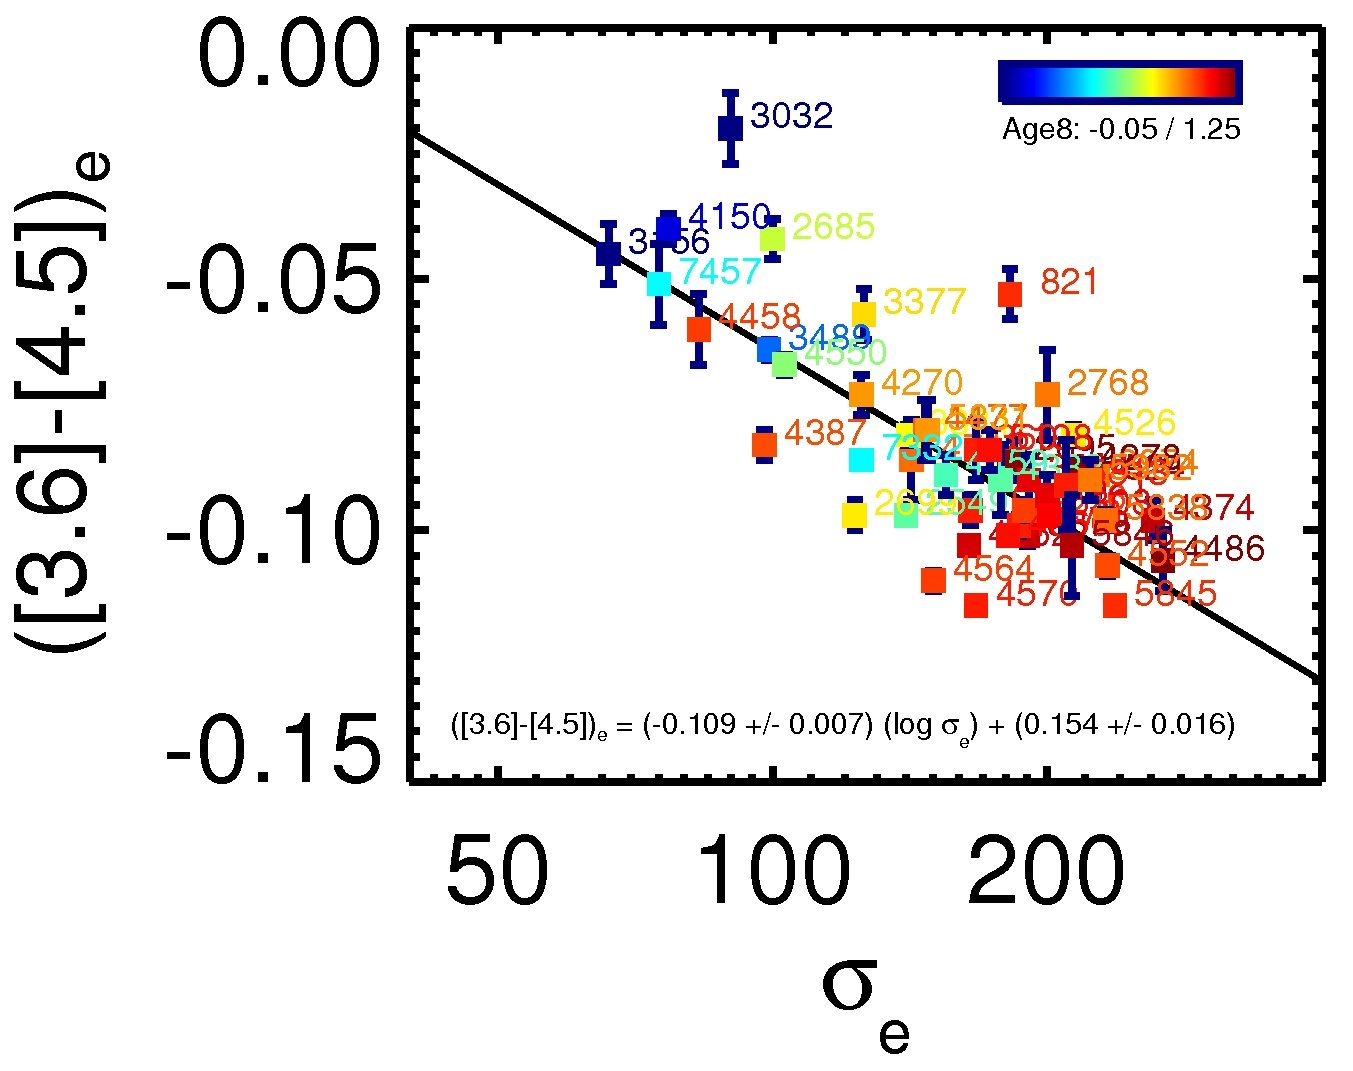
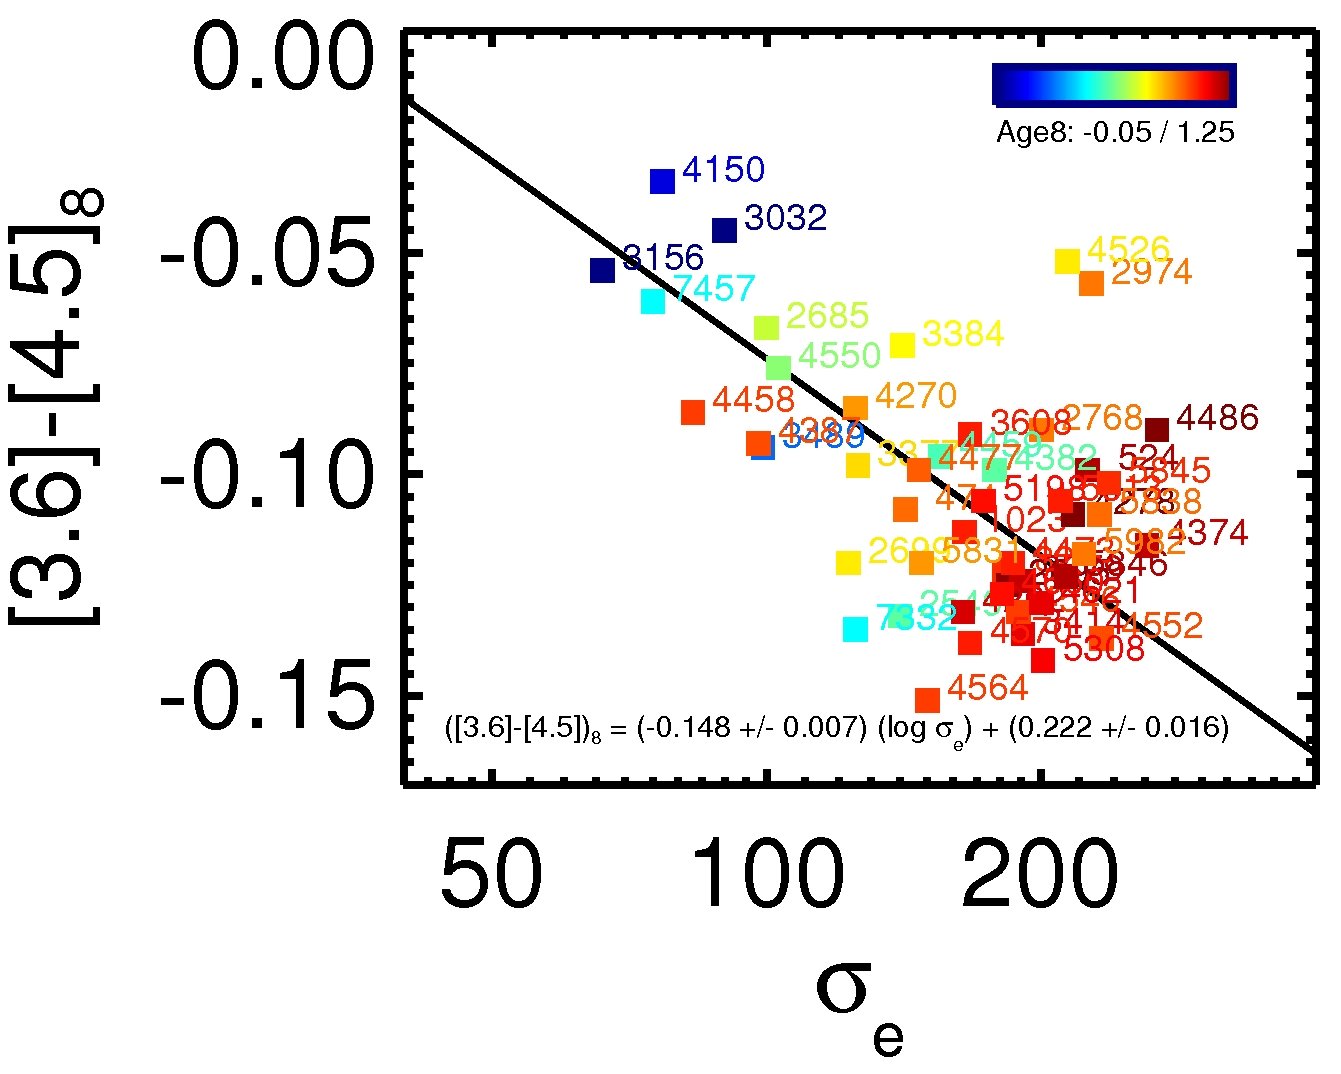
We find a tight relation between the colour and effective velocity dispersion, a good mass-indicator in early-type galaxies: ([3.6]-[4.5])e = (-0.109 0.007) log + (0.154 0.016). Contrary to other colours in the optical and near-infrared, we find that the colours become bluer for larger galaxies. The relations are tighter when using the colour inside re (scatter 0.013 mag) , rather than the much smaller re/8 aperture (scatter 0.023 mag) , due to the presence of young populations in the central regions. We also obtain strong correlations between the colour and 3 strong absorption lines (H, Mg b and Fe 5015). Comparing our data with the models of Marigo et al., which show that more metal rich galaxies are bluer, we can explain our results in a way consistent with results from the optical, by stating that larger galaxies are more metal rich. The blueing is caused by a strong CO absorption band, whose line strength increases strongly with decreasing temperature and which covers a considerable fraction of the 4.5 m filter. In galaxies that contain a compact radio source, the colour is generally slightly redder (by 0.015 0.007 mag using the aperture) than in the other galaxies, indicating small amounts of either hot dust, non-thermal emission, or young stars near the center.
We find that the large majority of the galaxies show redder colours with increasing radius. Removing the regions with evidence for young stellar populations (from the H absorption line) and interpreting the colour gradients as metallicity gradients, we find that our galaxies are more metal poor going outward. The radial [3.6] - [4.5] gradients correlate very well with the metallicity gradients derived from optical line indices. We do not find any correlation between the gradients and galaxy mass; at every mass galaxies display a real range in metallicity gradients.
Consistent with our previous work on line indices, we find a tight relation between local [3.6] - [4.5] colour and local escape velocity. The small scatter from galaxy to galaxy, although not negligible, shows that the amount and distribution of the dark matter relative to the visible light cannot be too different from galaxy to galaxy.
1 Introduction
Scaling relations play a fundamental role in the study of galaxy formation. As an example, studies based on SDSS (Baldry et al. 2004) have shown that nearby luminous galaxies exist in two varieties: galaxies on the red sequence, which form an upper, red envelope in the relation between optical colour and integrated absolute magnitude of the galaxies, and those that are found in the blue cloud, that have bluer colours than those on the red sequence, and much larger scatter. Galaxies on the red sequence are generally early-type galaxies, while those in the blue cloud are generally late-type, disk galaxies that are blue because of their star formation, and will eventually move towards the red sequence (Faber et al. 2007).
The red sequence, or the colour-magnitude relation, is an example of a mass-metallicity relation. On the relation one can see that as galaxies become more massive and brighter they become redder in, e.g., , indicating that their metallicity increases. Since the red sequence consists of the reddest galaxies at a certain magnitude, it is thought that it is the sequence of the oldest galaxies. Galaxies that are younger are found at bluer colours, towards the blue cloud. The colour-magnitude relation in nearby clusters has been known for more than 50 years. First established by Baum (1959), it was later used by Sandage (1972) to derive the relative distance between the Virgo and Coma clusters. Bower, Lucey & Ellis (1992) showed that tight colour-magnitude relations in , and could be determined for those clusters. Ellis et al. (1997) showed that a tight colour-magnitude relation continues to exist in rich clusters up to z=1, with gradually fewer objects on the red sequence as one goes to higher redshift (see also Sánchez-Blázquez et al. 2009).
Apart from studying the stellar populations of clusters of galaxies, the colour-magnitude relation can also be used to study individual nearby galaxies. If galaxies lie below the red sequence, they must be younger on average. This technique has often been used in the literature (e.g. Schweizer & Seitzer 1992, Bower et al. 1992). A problem is that colours are affected by extinction, so that features, such as central dust lanes, limit the accuracy of this method. To circumvent this problem, one can study line strength - magnitude relations, and, instead of using magnitudes as a proxy of galaxy masses, one can obtain smaller scatter using velocity dispersion (), in a certain galaxy aperture (e.g., Terlevich et al. 1981, Bender, Burstein & Faber 1993, Bernardi et al. 2003, Kuntschner et al. 2006 (hereinafter Paper VI), Sánchez-Blázquez et al. 2006). Analysis of such line strength vs. velocity dispersion relations using SSP models shows that the metallicity of a galaxy goes up with increasing mass, and that more massive galaxies are older (e.g., Thomas et al. 2005, Kuntschner et al. 2010, Paper XVII).
This is Paper XX in the SAURON series, in which we study the properties of nearby galaxies using integral field spectroscopy and anciliary data. Here we study the 48 early-type galaxies of SAURON sample (de Zeeuw et al. 2002, Paper II) which contains a representative range in absolute magnitude and ellipticity, including elliptical and lenticular galaxies, in the Virgo cluster and in the local field. For this sample, many physical parameters have already been determined, making it easier to perform a thorough analysis of this relation.
In Shapiro et al. 2010 (Paper XV) we identify galaxies hosting low-level star formation, as traced by PAH emission, using the Spitzer [3.6] - [8.0] colour, with measured star formation rates that compare well to those estimated from other tracers. Data from these satellites have revealed that star formation is occurring in a significant fraction of early-type galaxies (Yi et al. 2005; Young et al. 2009; Temi et al. 2009) and that this late-time star formation contributes 1 - 10% of the current stellar mass (Schawinski et al. 2007; Kaviraj et al. 2007). From the SAURON maps, Sarzi et al. 2006 (Paper V) identified a subset of the sample in which the low [OIII]/H emission-line ratios and settled gas systems can only be interpreted as sites of star formation activity. In these systems, the ionized gas is arranged in a regular, disk-like configuration, with low velocity dispersion (Paper V). Stellar population estimates (Paper VI; Paper XVII) and GALEX UV imaging (Jeong et al. 2009, hereafter Paper XIII) have further revealed that these systems contain the young stellar populations that must exist in the presence of on-going star formation. Additional evidence for star formation in these galaxies comes from CO observations, which reveal the presence of molecular gas and show that, in some cases, this gas is organized into disks that are co-spatial and corotating with the ionized gas and the young stars (Combes et al. 2007; Young et al. 2009). However, it is important to note that despite this evidence for trace on-going star formation in this subset of the sample, wide field optical imaging of the SAURON galaxies continues to confirm that all the galaxies in this sample reside solidly on the red sequence in optical colors (Falcón-Barroso et al. 2011, Paper XIX). In the latter paper, the location of our galaxies in various scaling relations is explored: the V-[3.6] – magnitude and V-[3.6] – relations, the Fundamental Plane, as well as the Kormendy and Faber-Jackson relations. It was found that the SAURON sample shows a tight colour – and Fundamental Plane relation, with an even smaller scatter for the slow rotators. Spirals also lie on these relations, albeit with more scattter.
As mentioned before, not only the age, but also the abundance distribution of various element changes as a function of galaxy mass. Although the Mg b line at 5170Å has been used most often for line strength – relations, other indices also mostly correlate with velocity dispersion (e.g. Sánchez-Blázquez et al. 2006). These correlations depend on the individual abundance of the elements responsible for the absorption lines. In principle, it should be possible to derive the element enrichment history of galaxies by studying various line strength - relations. Results, however, are slow to come, mainly because very high quality data are required. For example, it has been known for years that [Mg/Fe] increases for more massive galaxies. This is interpreted by assuming that Mg (and other -elements) form more quickly, from SN type II (Peletier 1989, Worthey et al. 1992). Some other elements follow Mg. For other elements, the situation is much less clear. For example, the behaviour of the Ca II IR triplet, which becomes less strong for more massive galaxies (Saglia et al. 2002, Cenarrro et al. 2003), is not well understood, since it is an -element, which should follow elements like Mg, and show Ca/Fe values larger than solar for large ellipticals. In reality, Ca seems to be under-abundant w.r.t. Fe (see e.g. Cenarro et al. 2003). In the near-infrared, even less is known, because of the lack of good data and models. In a recent paper Mármol-Queraltó et al. (2009) show indications that the index- relation for the CO band at 2.3 m is different in the Fornax cluster than in the field, indicating that this band strength is not dependent on age and metallicity in the same way as certain lines in the optical. It looks as if the CO-band contains a strong contribution from AGB stars of intermediate age.
The more one goes towards the near-infrared, the less the effects of extinction are, and also the effects of young stars. In the infrared, the contribution from old stars, and also evolved stars, such as those on the AGB, is dominant. In principle, the only advantage in using line strengths instead of colours in the near-IR is that line strengths are maybe simpler to understand. Accurate colour- relations, however, could significantly add to our understanding of stellar populations in galaxies. In this paper, we decided to use the large, high-quality database of Spitzer-IRAC images to study the stellar populations of elliptical galaxies. Buta et al. (2010) nicely show that the 3.6 m Spitzer filter in galaxies is dominated by stellar photospheric light. In early-type galaxies, where the contribution from the interstellar medium is relatively limited. The same can be said about the 4.5 m filter. Comparing the light in the two filters should give a colour which basically measures the average temperature of the stars, which is determined by the stellar populations. This study is particularly useful for interpreting the large surveys that are currently being done with the Spitzer Space Telescope in its last phase, with warm detectors.
With the contribution from young stellar populations minimized, the Spitzer [3.6]-[4.5] colour is well suited to measure metallicity gradients, which can provide useful information to study galaxy formation. Classical monolithic collapse scenarios (Larson 1974, Carlberg 1984, Arimoto & Yoshii 1987),as well as their (revised) up-to-date versions which start from semi-cosmological initial conditions (e.g. Kawata 2001; Kobayashi 2004) predict strong metallicity gradients. In these scenarios primordial clouds of gas sink to the centre of an overdensity where a rapid burst of star formation occurs. Infalling gas mixes with enriched material freed from stars by stellar evolutionary processes and forms a more metal rich population. Because the gas clearing time (and hence the number of generations which enrich the interstellar medium) is dependent on the depth of the potential well, the metallicity gradient is dependent on the mass of the galaxy.
Mergers, dominant in hierarchical galaxy formation scenarios, will dilute existing gradients (e.g. White 1980, di Matteo et al. 2009). The study of metallicity gradients hence can help distinguish between competing scenarios of galaxy formation and can eventually lead to a more detailed understanding of those scenarios. Many attempts have been made to model metallicity gradients in more detail (Carlberg 1984, Arimoto & Yoshii 1987, Chiosi & Carraro 2002, Kobayashi 2004, Pipino et al. 2008, 2010), of which the models by Kawata & Gibson (2003) are so far the most consistent with observations (Spolaor et al. 2009).
Much work has also been devoted to determine metallicity gradients in large elliptical galaxies, either by use of colour gradients (Sandage 1972, Franx, Illingworth & Heckman 1989, Peletier et al. 1990, Peletier, Valentijn & Jameson 1990, Saglia et al. 2000, La Barbera et al. 2004, La Barbera et al. 2005, La Barbera & de Carvalho 2009) or by spectroscopy (Davies, Sadler & Peletier 1993, Carollo & Danziger 1993, Sánchez-Blázquez, Gorgas & Cardiel 2006,Ogando et al. 2008). In Paper XVII we have determined age, metallicity and [/Fe] gradients for the SAURON early-type galaxy sample, assuming that at every position in the galaxy the stellar populations could be represented by SSPs. There is consensus that colour and line strength gradients, when converted to metallicity gradients, indicate that galaxies become slowly more metal poor with increasing radius, however gradients are shallower than predicted by classic monolithic collapse scenarios. Metallicity gradients seem to peak around = 100 - 150 km/s (Peletier et al. 1990, Sánchez-Blázquez, Gorgas & Cardiel 2006,, Paper XVII). Towards the faint end of the galaxy sequence gradients decrease (den Brok et al. 2011, Spolaor et al. 2010, Koleva et al. 2009). For galaxies with 100 km/s there seems to be a strong correlation between colour gradient and , with real scatter at every . For galaxies more massive than 150 km/s there does not seem to be any correlation between metallicity gradient and any more, and the scatter seems to be considerable. To be able to use the information that is contained in the metallicity gradients, it is important to understand their correlations, and their scatter at a given . Since the Spitzer data at 3.6 and 4.5 m are relatively easy to interpret, without being affected by extinction, and with only a small dependence on the presence of young stellar populations, we have calculated the gradients in the [3.6] - [4.5] colour, and have investigated their properties.
The content of this paper is as follows: in Section 2 the [3.6] - [4.5] m colour and its use for stellar population analysis of galaxies is introduced. In Section 3 the data reduction and analysis are described. In Section 4 we discuss various scaling relations with the [3.6] - [4.5] colour. In section 5 the gradients and their correlations are discussed. The observational relations of sections 4 and 5 are discussed in Section 6, after which in Section 7 the conclusions are given.
2 The colour as a tracer of old stellar populations
As far as stellar populations of galaxies are concerned, the colour is almost virgin territory. Reasons for this are the fact that ground-based observations in the mid-infrared suffer from a large background from thermal emission from the Earth, and that there have been very few space missions with adequate instruments and detectors up to now. One of the first extragalactic mid-infrared spectra ever published is the spectrum of M82 (Willner et al. 1977). Using single-detector aperture photometry they found a featureless Rayleigh-Jeans tail from 2 micron, combined with a strong Polyaromatic Hydrocarbon (PAH) feature at 3.3 m. Much later, ISO-CVF spectra of the elliptical galaxy NGC 1399 (Madden & Vigroux 1999) showed that the spectrum between 5 and 10 m is consistent with a blackbody spectrum of T=4700K, showing no evidence for PAH-features. Kaneda et al. (2007) showed a high S/N spectrum of the early-type galaxy NGC 1316, starting at 2.5 m, which is almost featureless, apart from an absorption feature at 4.5 m. Very few other galaxy spectra are available in the literature, also because the IRS, the low resolution spectrograph on board of the Spitzer Space Telescope, only covers the spectral region redward of 5 m.
Modelling of IRS spectra of elliptical galaxies shows that the emission mainly comes from the Rayleigh-Jeans tail of stellar photospheric spectra, together with a silicate emission feature at 9-12 m due to mass loss from AGB stars. This feature has been used to determine the age of about 20 galaxies (Bressan et al. 2006, Bregman et al. 2006), showing that all of these are old, a result implying that emission from young stars is very hard to find in the mid-IR. In a smaller fraction of these galaxies line emission was found: unresolved line and silicate emission in M87 that likely originates in the dusty torus surrounding the AGN, and unresolved PAH emission in NGC 4550 and NGC 4435 (Bressan et al. 2006). In Fig. 1 the spectral energy distributions of various galaxy components (starlight, warm dust emitting in the PAH lines and active galactic nuclei) are shown together with the and m filter transmission curves of IRAC on the Spitzer Space Telescope (Fazio 2005).
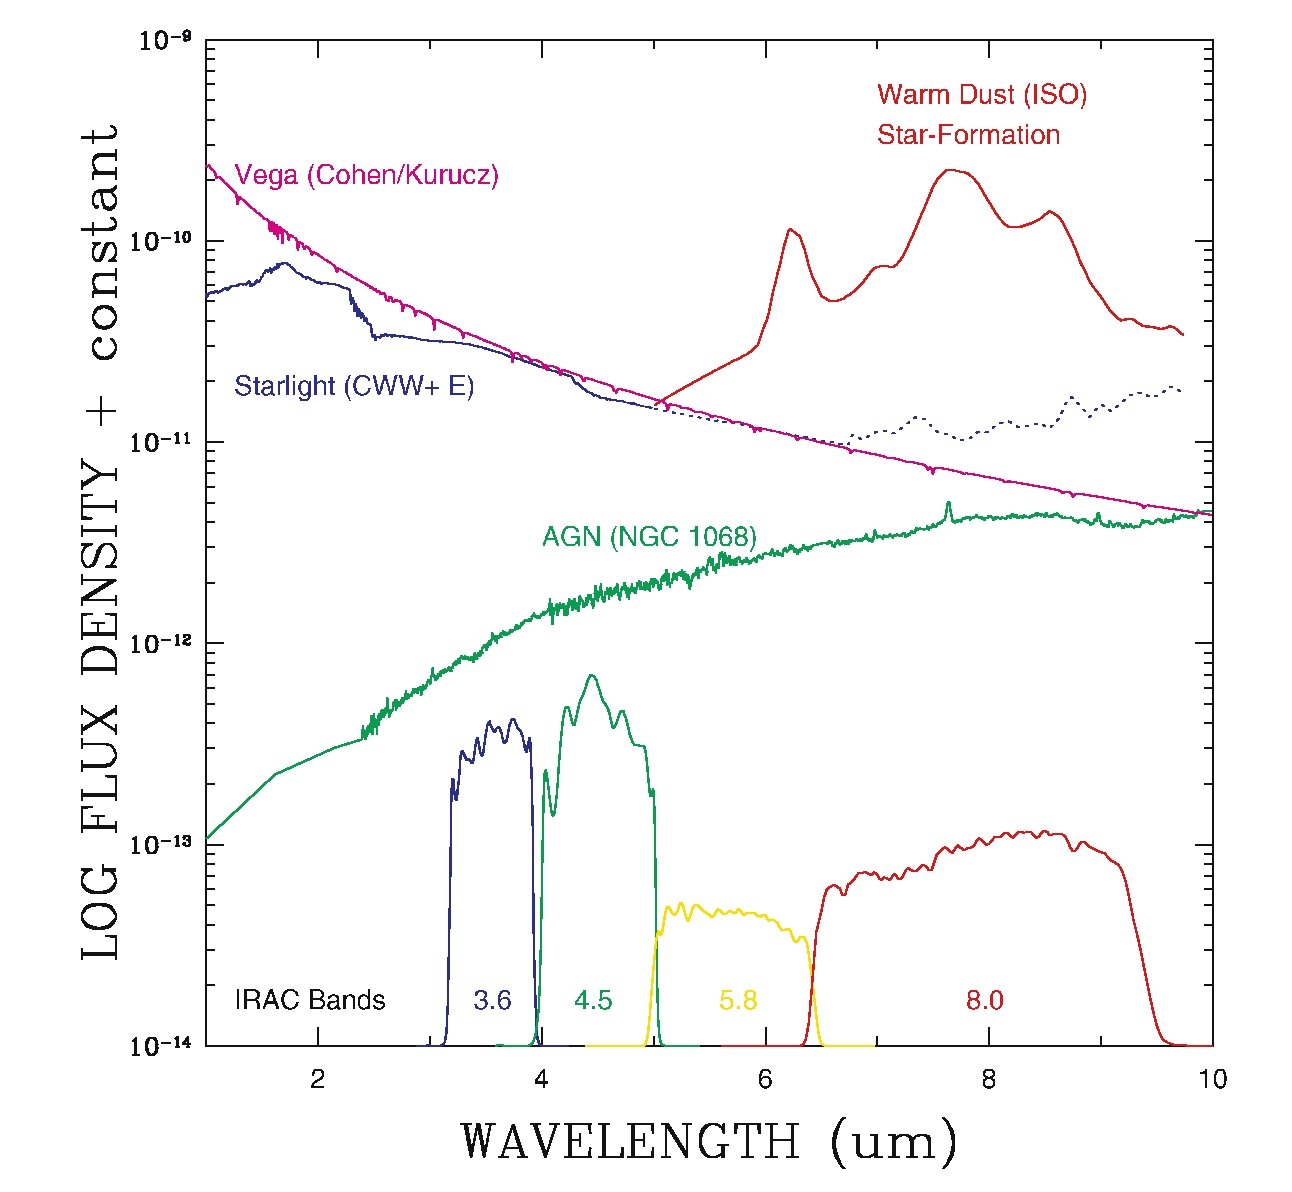
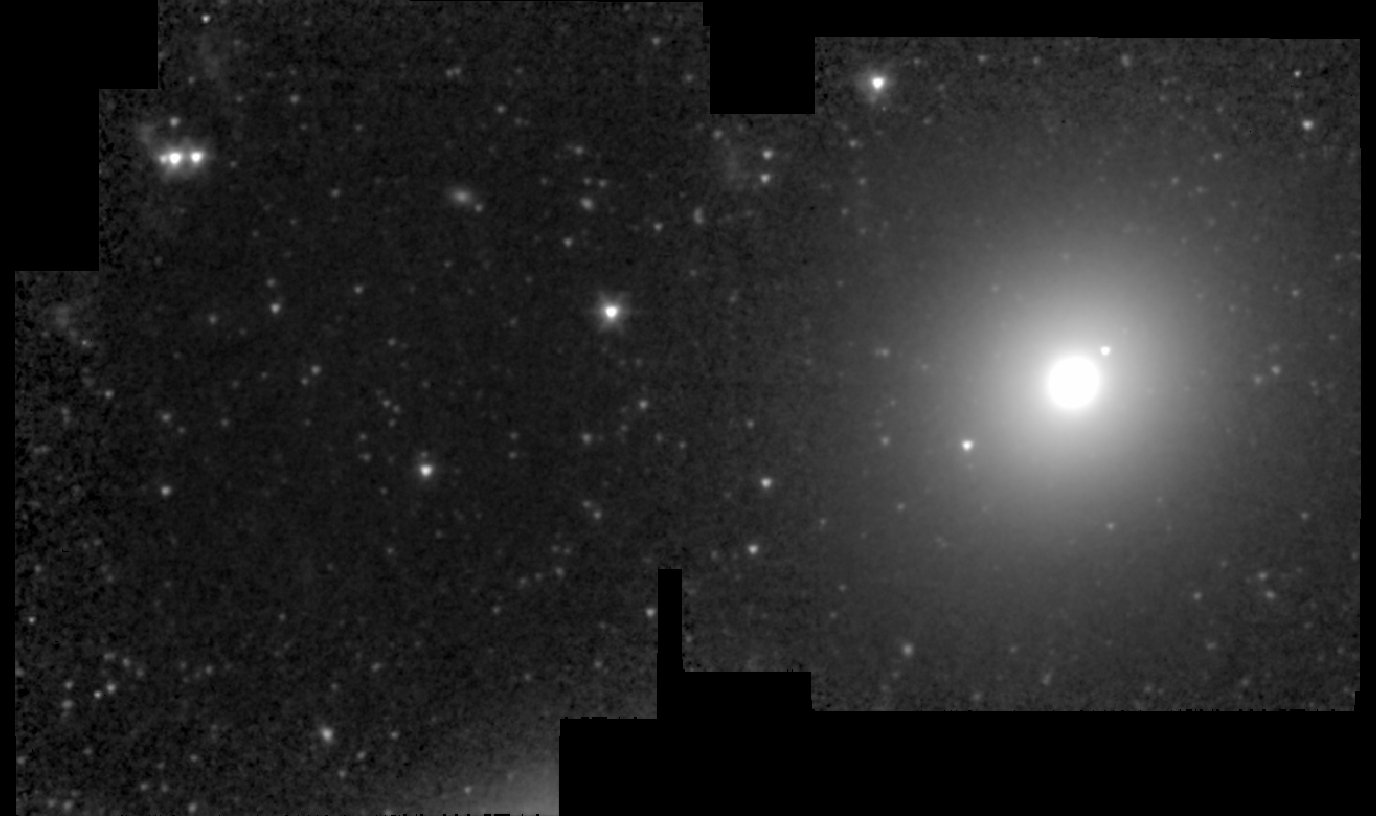
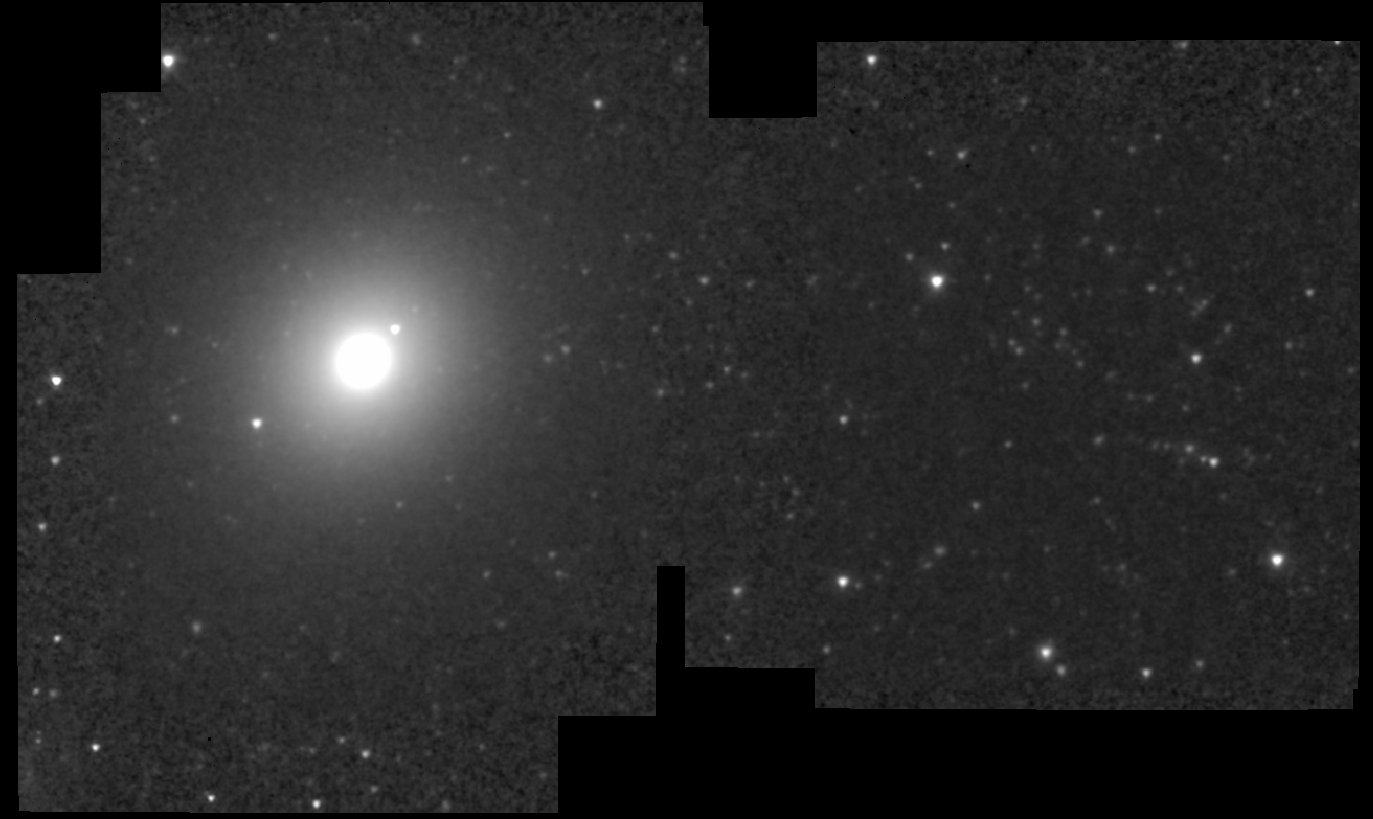
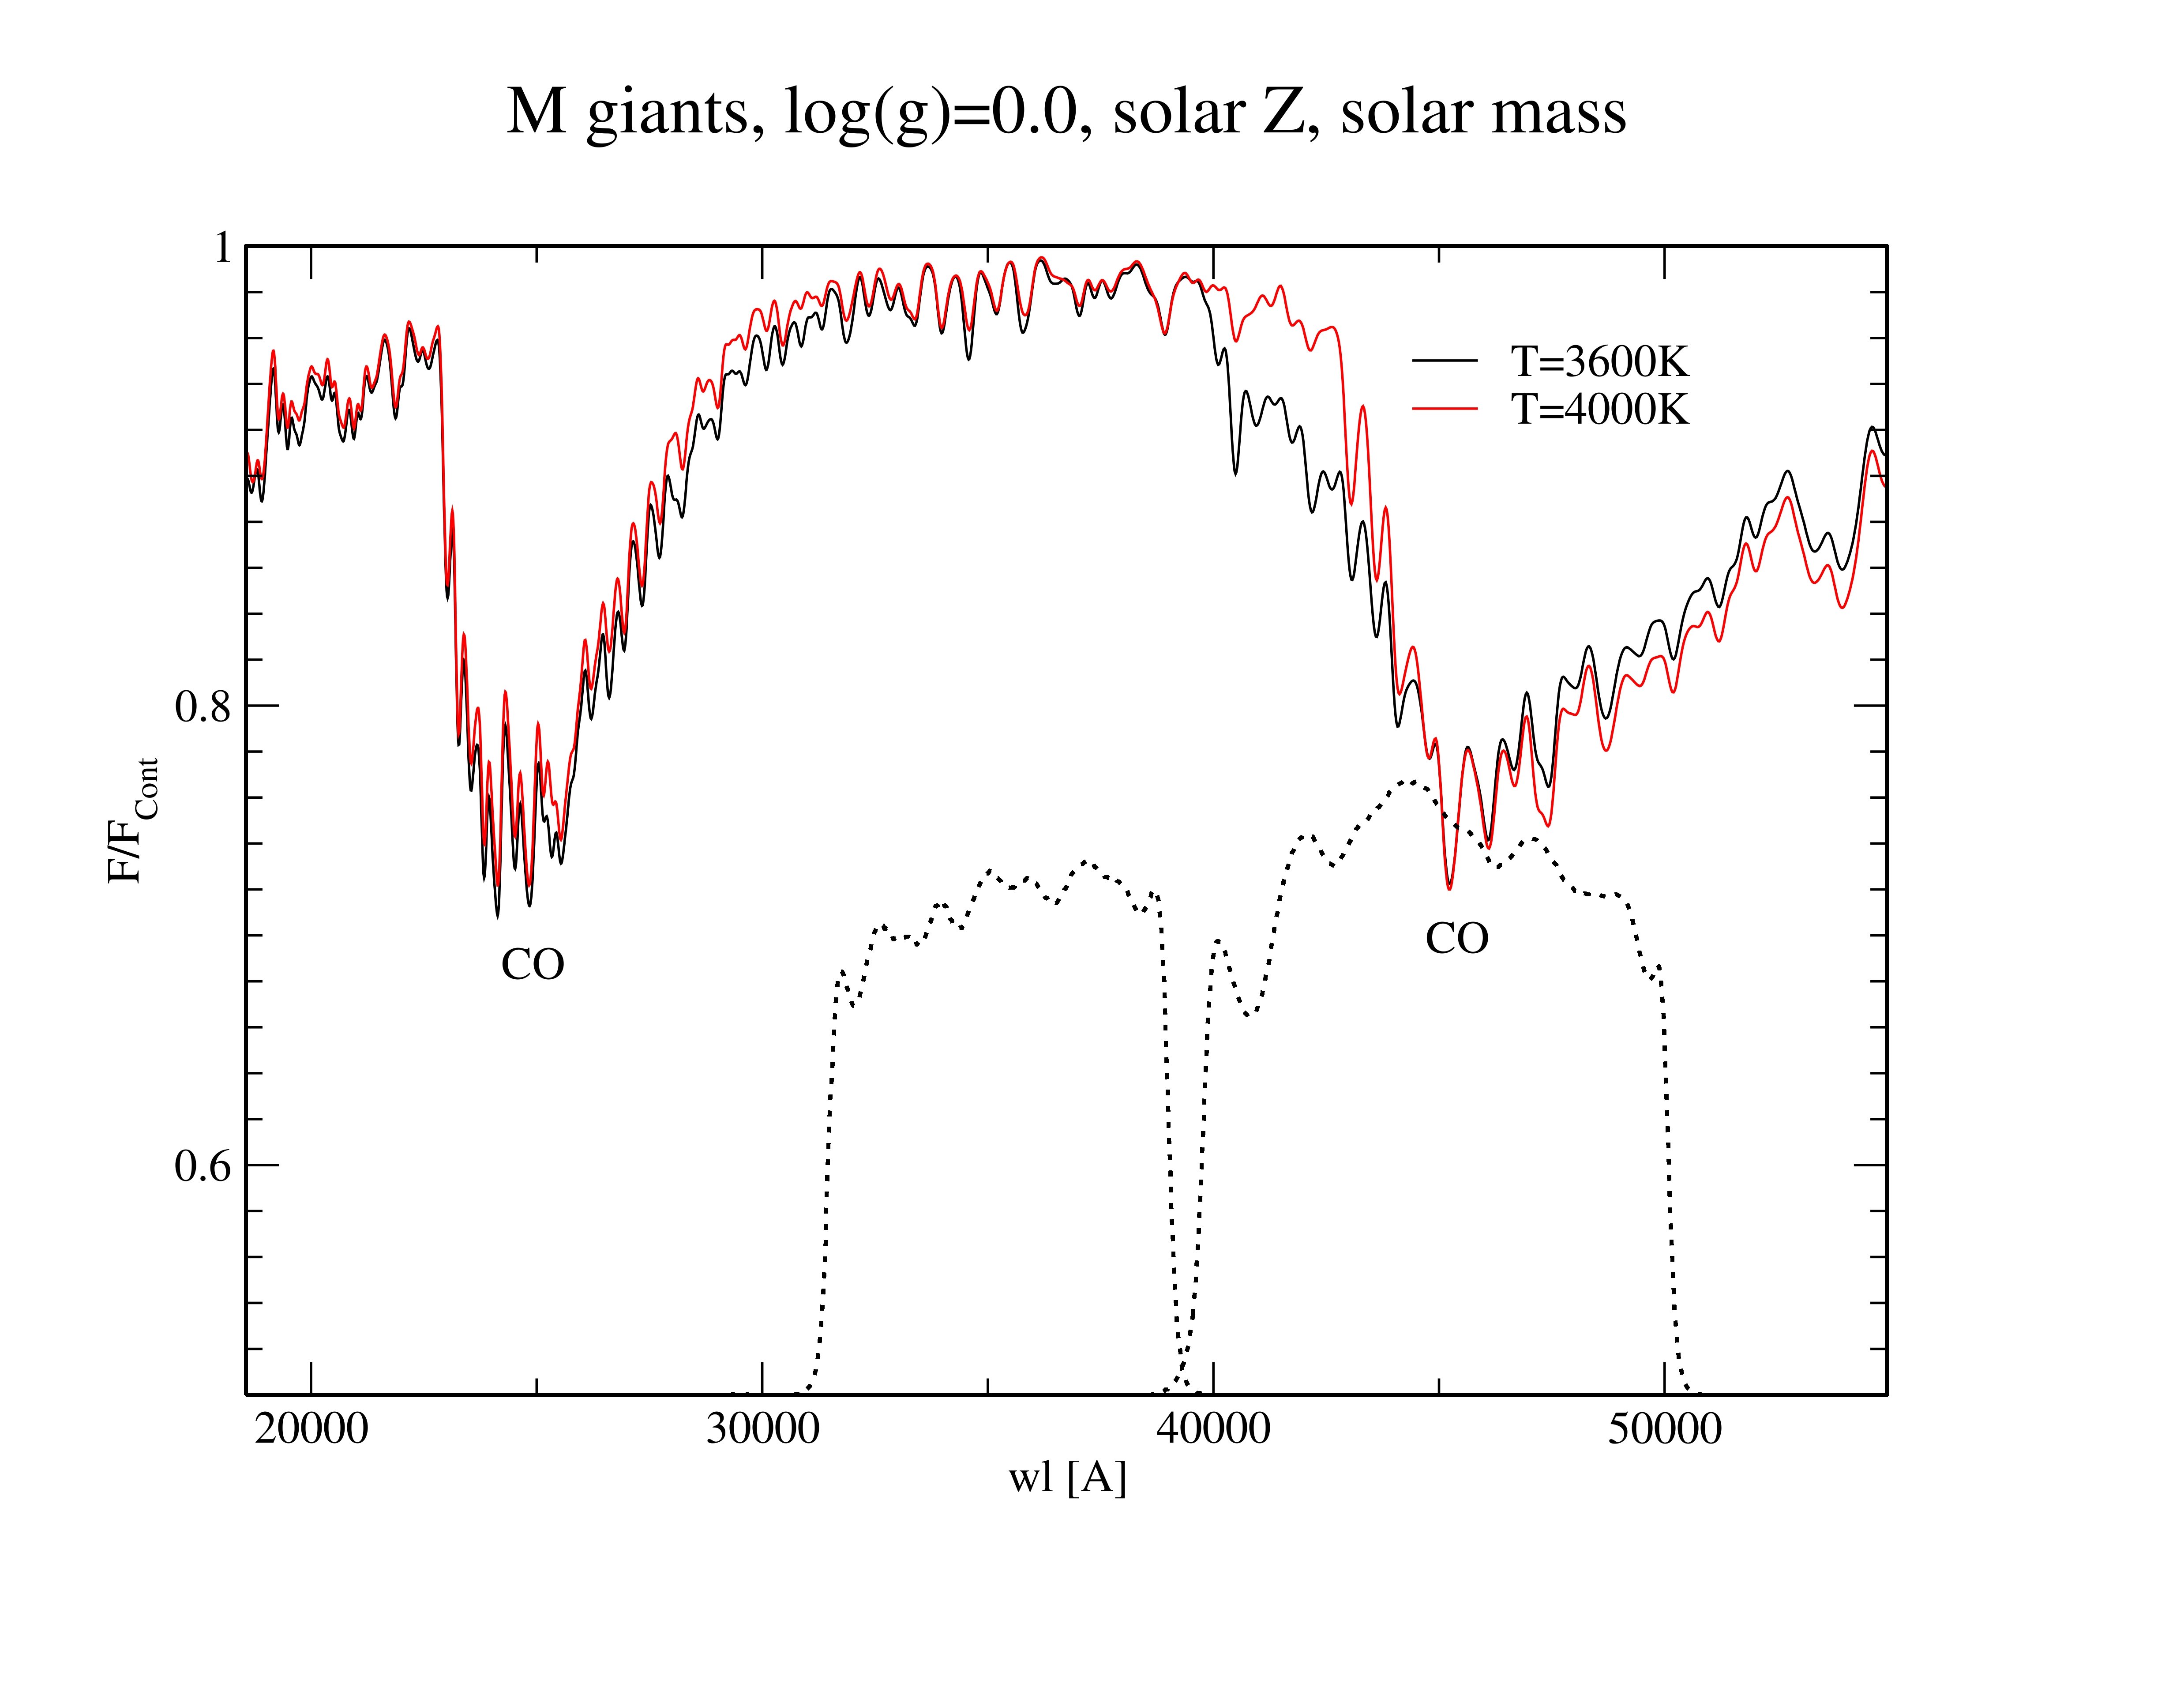
As far as extragalactic IRAC photometry is concerned, almost all the published work is aimed at studying star formation and PAHs (e.g. Calzetti et al. 2005, Paper XV, Muñoz-Mateos et al. 2009). 3.6 and 4.5 m images have been published, but the colour information is almost never quantitatively analyzed. This is remarkable, since the data quality is exceptional (see Fig.2). As an exception, Temi et al. (2008) show a [3.6] - [4.5] m colour profile, averaging a number of elliptical galaxies in the Spitzer archive. They note that the profile is rather flat, but has a positive gradient, i.e. that the galaxies become slightly redder in the outer parts. This behaviour is noteworthy, since it is contrary to the behaviour in all other optical filters, in which elliptical galaxies generally become bluer outwards (e.g. Peletier et al. 1990). However, it can be understood when one realises that the 4.5 m filter is dominated by a strong CO absorption band (e.g. Cohen et al. 1996). We show some stellar model spectra in Fig. 3 (Bressan, private communication), where the spectral energy distributions between and m of two M-type giant stars with different temperatures are compared with each other. When going radially outwards in an elliptical galaxy, the metallicity goes down. This causes an increase in the average stellar temperature, causing the CO-band to become weaker, and the flux in the 4.5 filter to increase, causing the colour to redden, despite the increasing average temperature.
3 Data reduction and analysis
3.1 Spitzer data
For our analysis we use pipeline-reduced -images obtained with IRAC on the Spitzer Space Telescope (Fazio et al. 2005) in the 3.6 and 4.5 m filters. We then used the standard MOPEX pipeline to make the final mosaics, sampling them at a pixel size of 0.6′′. We used the zero magnitude flux densities provided by Reach et al. (2005).
IRAC images suffer from complex scattering of light in the focal planes, particularly for the Si:As detectors ( and m). This effect causes sources to have extended halos, making it difficult to apply the flux calibration obtained from stars to galaxies, and to apply accurate surface brightness profiles. The scattering has two components: 1- the PSFs at and m have more extended wings than expected, 2- there is diffuse scattering which distributes a portion of the flux on a pixel throughout the entire array. The problem is discussed in detail at http://irsa.ipac.caltech.edu/data/SPITZER/docs/irac/iracinstrumenthandbook/, Section 4.10 and 4.11. Here it is shown that the effects of scattering are smallest in the short-wavelength channels ( and m) of IRAC, and that the aperture corrections in both filters are very similar. Since the main aim of this work is the study of the mid-IR colours, we cross-convolved each image with the PSF of the other filter, using the PSFs and the IDL software of Gordon provided on the Spitzer Space Telescope website. This results in images with exactly the same PSF at 3.6 and at 4.5 m, except on scales larger than 10′′, due to the limited size of the convolution kernels. Beyond this length scale it is most probable that the PSF in both images is very similar (Fig. 4.7 of the Spitzer handbook). We also decided not to apply any aperture corrections to our profiles, nor to our integrated colours, since these are rather uncertain. Similar considerations led e.g. the SINGS team (Dale et al. 2009) to the same conclusions. The tightness of the scaling relations shown in this paper shows that the PSF is sufficiently stable and constant from galaxy to galaxy that this approach is scientifically valid.
3.2 Colours and colour profiles
The large field of view of SAURON (31′′ 40′′, Paper II) made it possible to measure velocity dispersions, morphological parameters such as boxiness and ellipticity, ionized gas properties, line strength indices and GALEX UV fluxes for each galaxy in circular apertures of radius and . We use the values tabulated in Sarzi et al. (2006, Paper V), Paper VI, Emsellem et al. (2007, Paper IX), and Bureau et al. (2011, Paper XVIII). Some important parameters are reproduced here in Table 1. To investigate possible correlations with these parameters, we measured the colour within the same apertures. These numbers are are also given in Table 1. In Fig. 2 example images of the galaxy NGC 3379 are given. The quality of these images is typical for the whole dataset. Technical details about the observations, such as proposal ID and integration times, are given in Paper XV. The photon noise for all galaxies is so low that Poisson errors in the magnitudes are negligible. We have calculated the errors due to the uncertainties in the sky background, which are mainly due to small structures in the background of the Spitzer images (see Table 1). Systematic errors due to, e.g., PSF scattering effects, might play a role, but in the colours many systematic errors cancel out. From the tightness in the scaling relations presented in the next section it is clear that the systematic errors in the colours have to be very similar from galaxy to galaxy.
NGC re PA (a4/a)e rmin rmax ′′ km/s deg % mag mag mag/dex ′′ ′′ (8) (9) (10) (11) (12) (13) (14) (15) 474 29 150 0.13 15 -0.14 0.200 -0.086 0.008 -0.108 0.001 0.045 0.016 3.0 67.6 524 51 235 0.04 38 -0.16 0.278 -0.090 0.003 -0.099 0.000 0.024 0.009 3.0 116.8 821 39 189 0.35 32 1.43 0.258 -0.089 0.005 -0.122 0.000 0.075 0.011 3.0 105.4 1023 48 182 0.36 82 0.54 0.385 -0.096 0.003 -0.113 0.000 0.039 0.007 5.0 182.7 2549 20 145 0.49 0 2.86 0.539 -0.097 0.001 -0.132 0.001 0.064 0.010 3.0 117.5 2685 20 96 0.59 36 2.93 0.716 -0.042 0.004 -0.067 0.001 0.021 0.009 3.0 51.8 2695 21 188 0.21 170 0.36 0.561 -0.086 0.004 -0.125 0.001 0.037 0.015 3.0 60.1 2699 14 124 0.19 50 1.04 0.450 -0.097 0.003 -0.120 0.001 0.081 0.020 3.0 43.9 2768 71 216 0.46 94 0.12 0.268 -0.073 0.009 -0.090 0.000 0.027 0.011 6.0 190.2 2974 24 233 0.37 42 0.64 0.602 -0.089 0.003 -0.057 0.001 0.032 0.017 7.0 117.8 3032 17 90 0.17 95 0.44 0.416 -0.020 0.007 -0.045 0.001 -0.007 0.071 14.9 32.3 3156 25 65 0.47 48 -0.04 0.713 -0.045 0.006 -0.054 0.001 0.013 0.013 3.0 42.0 3377 38 138 0.50 42 0.94 0.475 -0.057 0.005 -0.098 0.001 0.059 0.010 3.0 134.7 3379 42 201 0.11 71 0.16 0.145 -0.101 0.002 -0.124 0.000 0.026 0.008 3.0 178.4 3384 27 145 0.20 50 1.13 0.414 -0.081 0.002 -0.071 0.000 -0.006 0.014 13.5 114.1 3414 33 205 0.23 2 1.80 0.062 -0.090 0.005 -0.136 0.001 0.078 0.013 3.0 86.4 3489 19 98 0.29 68 -0.61 0.602 -0.064 0.002 -0.094 0.001 0.038 0.008 3.0 95.4 3608 41 178 0.20 80 -0.21 0.038 -0.084 0.006 -0.091 0.000 0.031 0.018 6.0 96.1 4150 15 77 0.28 145 -0.32 0.584 -0.040 0.003 -0.034 0.001 0.038 0.028 9.0 63.0 4262 10 172 0.11 153 1.28 0.245 -0.103 0.001 -0.131 0.000 0.086 0.014 3.0 50.6 4270 18 122 0.44 106 -0.64 0.446 -0.073 0.004 -0.085 0.001 -0.000 0.009 3.0 40.0 4278 32 231 0.13 34 -0.15 0.149 -0.088 0.002 -0.109 0.000 0.039 0.010 3.0 107.8 4374 71 278 0.13 126 -0.40 0.023 -0.098 0.004 -0.116 0.000 0.023 0.008 3.0 191.4 4382 67 196 0.22 19 0.59 0.155 -0.090 0.007 -0.099 0.001 0.011 0.006 3.0 158.0 4387 17 98 0.32 143 -0.76 0.408 -0.083 0.003 -0.093 0.001 0.034 0.013 3.0 48.6 4458 27 85 0.14 4 0.41 0.046 -0.060 0.007 -0.086 0.001 0.055 0.018 3.0 49.7 4459 38 168 0.17 106 0.22 0.436 -0.089 0.004 -0.096 0.000 0.004 0.008 3.0 70.0 4473 27 192 0.43 92 1.03 0.195 -0.099 0.002 -0.120 0.000 0.036 0.009 3.0 137.5 4477 47 162 0.23 77 2.04 0.215 -0.080 0.006 -0.099 0.001 0.036 0.009 3.0 101.1 4486 105 298 0.07 159 -0.07 0.019 -0.106 0.006 -0.090 0.001 0.020 0.009 7.3 157.0 4526 40 222 0.41 112 -1.92 0.476 -0.081 0.002 -0.052 0.000 0.014 0.015 14.3 214.4 4546 22 194 0.36 79 0.69 0.604 -0.096 0.002 -0.131 0.000 0.068 0.008 3.0 111.2 4550 14 110 0.62 179 2.36 0.091 -0.067 0.002 -0.076 0.001 0.039 0.010 3.0 67.0 4552 32 252 0.06 125 0.00 0.049 -0.107 0.002 -0.137 0.000 0.062 0.010 3.0 173.8 4564 21 155 0.43 48 1.33 0.586 -0.110 0.002 -0.151 0.000 0.057 0.009 3.0 82.0 4570 14 173 0.44 158 1.90 0.561 -0.115 0.001 -0.138 0.001 0.060 0.008 3.0 118.9 4621 46 211 0.35 163 1.66 0.268 -0.093 0.004 -0.129 0.000 0.059 0.009 3.0 177.1 4660 11 185 0.41 100 0.66 0.472 -0.101 0.001 -0.127 0.000 0.065 0.011 3.0 60.2 5198 25 179 0.14 26 -0.17 0.060 -0.084 0.004 -0.106 0.001 0.044 0.023 5.6 58.2 5308 10 208 0.53 59 4.74 0.483 -0.097 0.001 -0.142 0.000 0.030 0.008 3.0 85.8 5813 52 230 0.17 136 -0.03 0.063 -0.091 0.009 -0.106 0.000 0.013 0.011 3.0 144.2 5831 35 151 0.20 141 0.46 0.049 -0.080 0.006 -0.120 0.001 0.063 0.015 3.0 74.7 5838 23 240 0.28 41 0.34 0.518 -0.098 0.002 -0.109 0.000 0.020 0.013 5.4 120.0 5845 4 239 0.31 140 0.63 0.357 -0.115 0.000 -0.102 0.000 0.076 0.017 3.0 30.0 5846 81 238 0.07 58 -0.38 0.024 -0.103 0.010 -0.123 0.001 0.034 0.010 3.0 190.4 5982 27 229 0.28 106 -0.92 0.093 -0.090 0.004 -0.118 0.000 0.048 0.013 3.0 103.6 7332 11 125 0.39 155 1.35 0.390 -0.086 0.001 -0.135 0.000 0.044 0.007 3.0 80.0 7457 65 78 0.43 125 0.20 0.570 -0.051 0.008 -0.061 0.001 0.008 0.010 3.0 107.1
Column (1): object ID (NGC number); (2): Effective radius (from Paper XIX). ; (3): Integrated velocity dispersion inside the effective radius (), from Paper XIX; (4): Mean ellipticity within re, from Paper IX; (5): Major axis position angle from N through E; (6): Mean isophote shape parameter a4/a (in percent, from Paper IX); (7): within re , from Paper IX; (8): Integrated colour in circular apertures of r=re; (9): Error in this quantity due to sky background errors alone; (10): Integrated colour in circular apertures of r=re/8; (11): Error in this quantity due to sky background errors alone. The units in columns (8)-(11) are Vega magnitudes calculated using zero magnitude flux densities provided by Reach et al. (2005); (12): colour gradient per dex in radius; (13) error in (2); (14) and (15): minimum and maximum of the radial major axis range in which the colour gradient has been determined.
Galaxy rmaj [3.6] – [4.5] arcsec mag arcsec-2 NGC 474 1.01 -0.116 0.001 NGC 474 1.34 -0.114 0.001 NGC 474 1.77 -0.112 0.001 NGC 474 2.35 -0.111 0.001
Column (1): Galaxy ID; (2): major axis radius in arcsec; (3): colour; (4): Error in this colour. The whole table is available in electronic form.
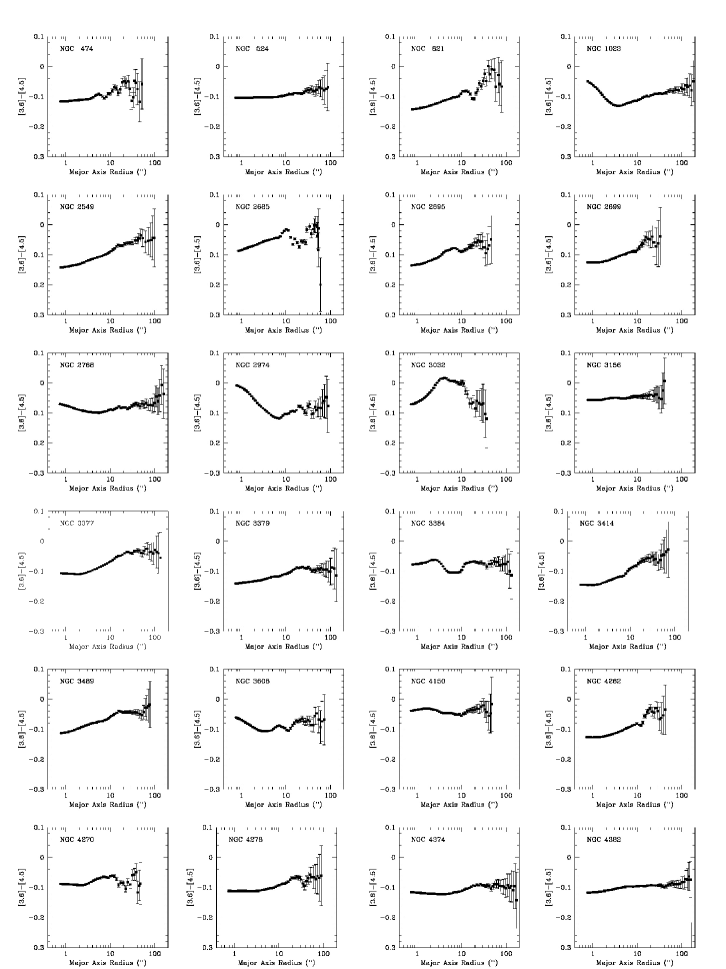
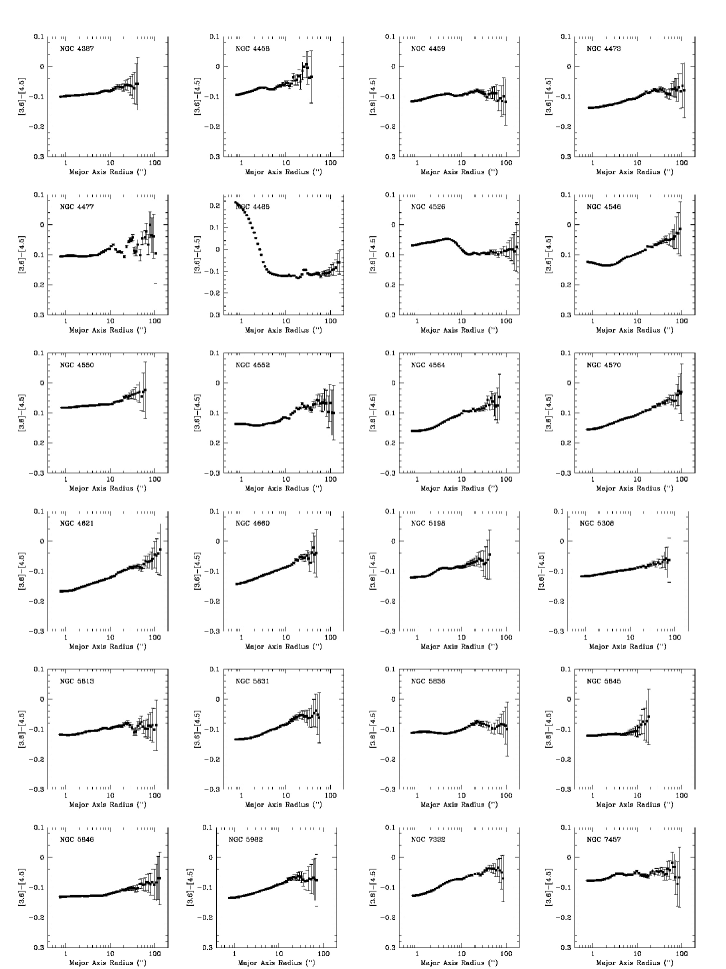
We proceeded by obtaining the [3.6] and [4.5] surface brightness profile of each galaxy using GALPHOT (Jørgensen et al. 1992), implemented in IRAF. To do this, we masked the foreground stars and instrumental features in the mosaics, such as high or low columns and rows. In this process the galaxy center was chosen to be at the 3.6 m intensity peak, which was always the same, within the errors, as the intensity peak at 4.5 m. We first fitted concentric ellipses on the 3.6 m images, allowing ellipticity and major axis position angle to vary at every radius, for each galaxy, to find the best fit, while keeping the center fixed. We then determined a unique representative ellipticity and position angle, which we fixed (see Table 1), and then determined surface brightness profiles in [3.6] and [4.5] on these isophotes. In Fig. 4a and 4b, we give the colour profiles. One can see that there is no colour information in the inner 1′′, since the PSFs of the two filters were homogenised. Generally we see that the galaxy colours are becoming redder when going outwards, opposite to e.g. colours in the optical and near-infrared. On top of that we sometimes see features near the center, producing colours that are slightly redder than expected from extrapolating the outer regions inwards. The colour profiles are tabulated in Table 2.
3.3 Colour gradients
Early-type galaxies, because of their classification as red objects, mainly consist of relatively old stellar populations, with limited areas that also contain younger stars. The younger stars in our sample are generally found in central rings or disks (Paper XVII). Further out, the colours of early-type galaxies are rather uniform, indicating that the stellar populations there are generally old, and probably only varying because of differences in metallicity (see e.g. Peletier et al. 1990). In this subsection we try to quantify the stellar population gradients in the old stellar populations. To do this, we select the regions dominated by the old stellar populations using the H maps of Kuntschner et al. (2006), and use them to define the radial regions in the radial colour profiles that we use to fit the radial colour gradients of the old stellar populations. In this way we do not include features like the central disk in NGC 4526 (Fig. 9). Near the center of the galaxies we don’t use the data inside 3′′, since there is very little colour information there as a result of the coarse sampling of IRAC. All data points are used for which the errors in the colour due to sky background uncertainties are less than 0.1 mag. The ranges are given in Table 1. In the radial regions that we use the [3.6] - [4.5] colour generally shows a linear behaviour as a function of logarithmic radius. Because of this, we fit the logarithmic slope , where the radii are major axis radii, weighting the points with their sky background errors. We find that most profiles show a positive gradient: they are redder in the outer parts, contrary to all optical and optical-near infrared filters, in which galaxies are bluer in the outer regions. As explained in Section 3.2, this corresponds to decreasing metallicities and increasing ages when going outwards radially.
3.4 Stellar population models
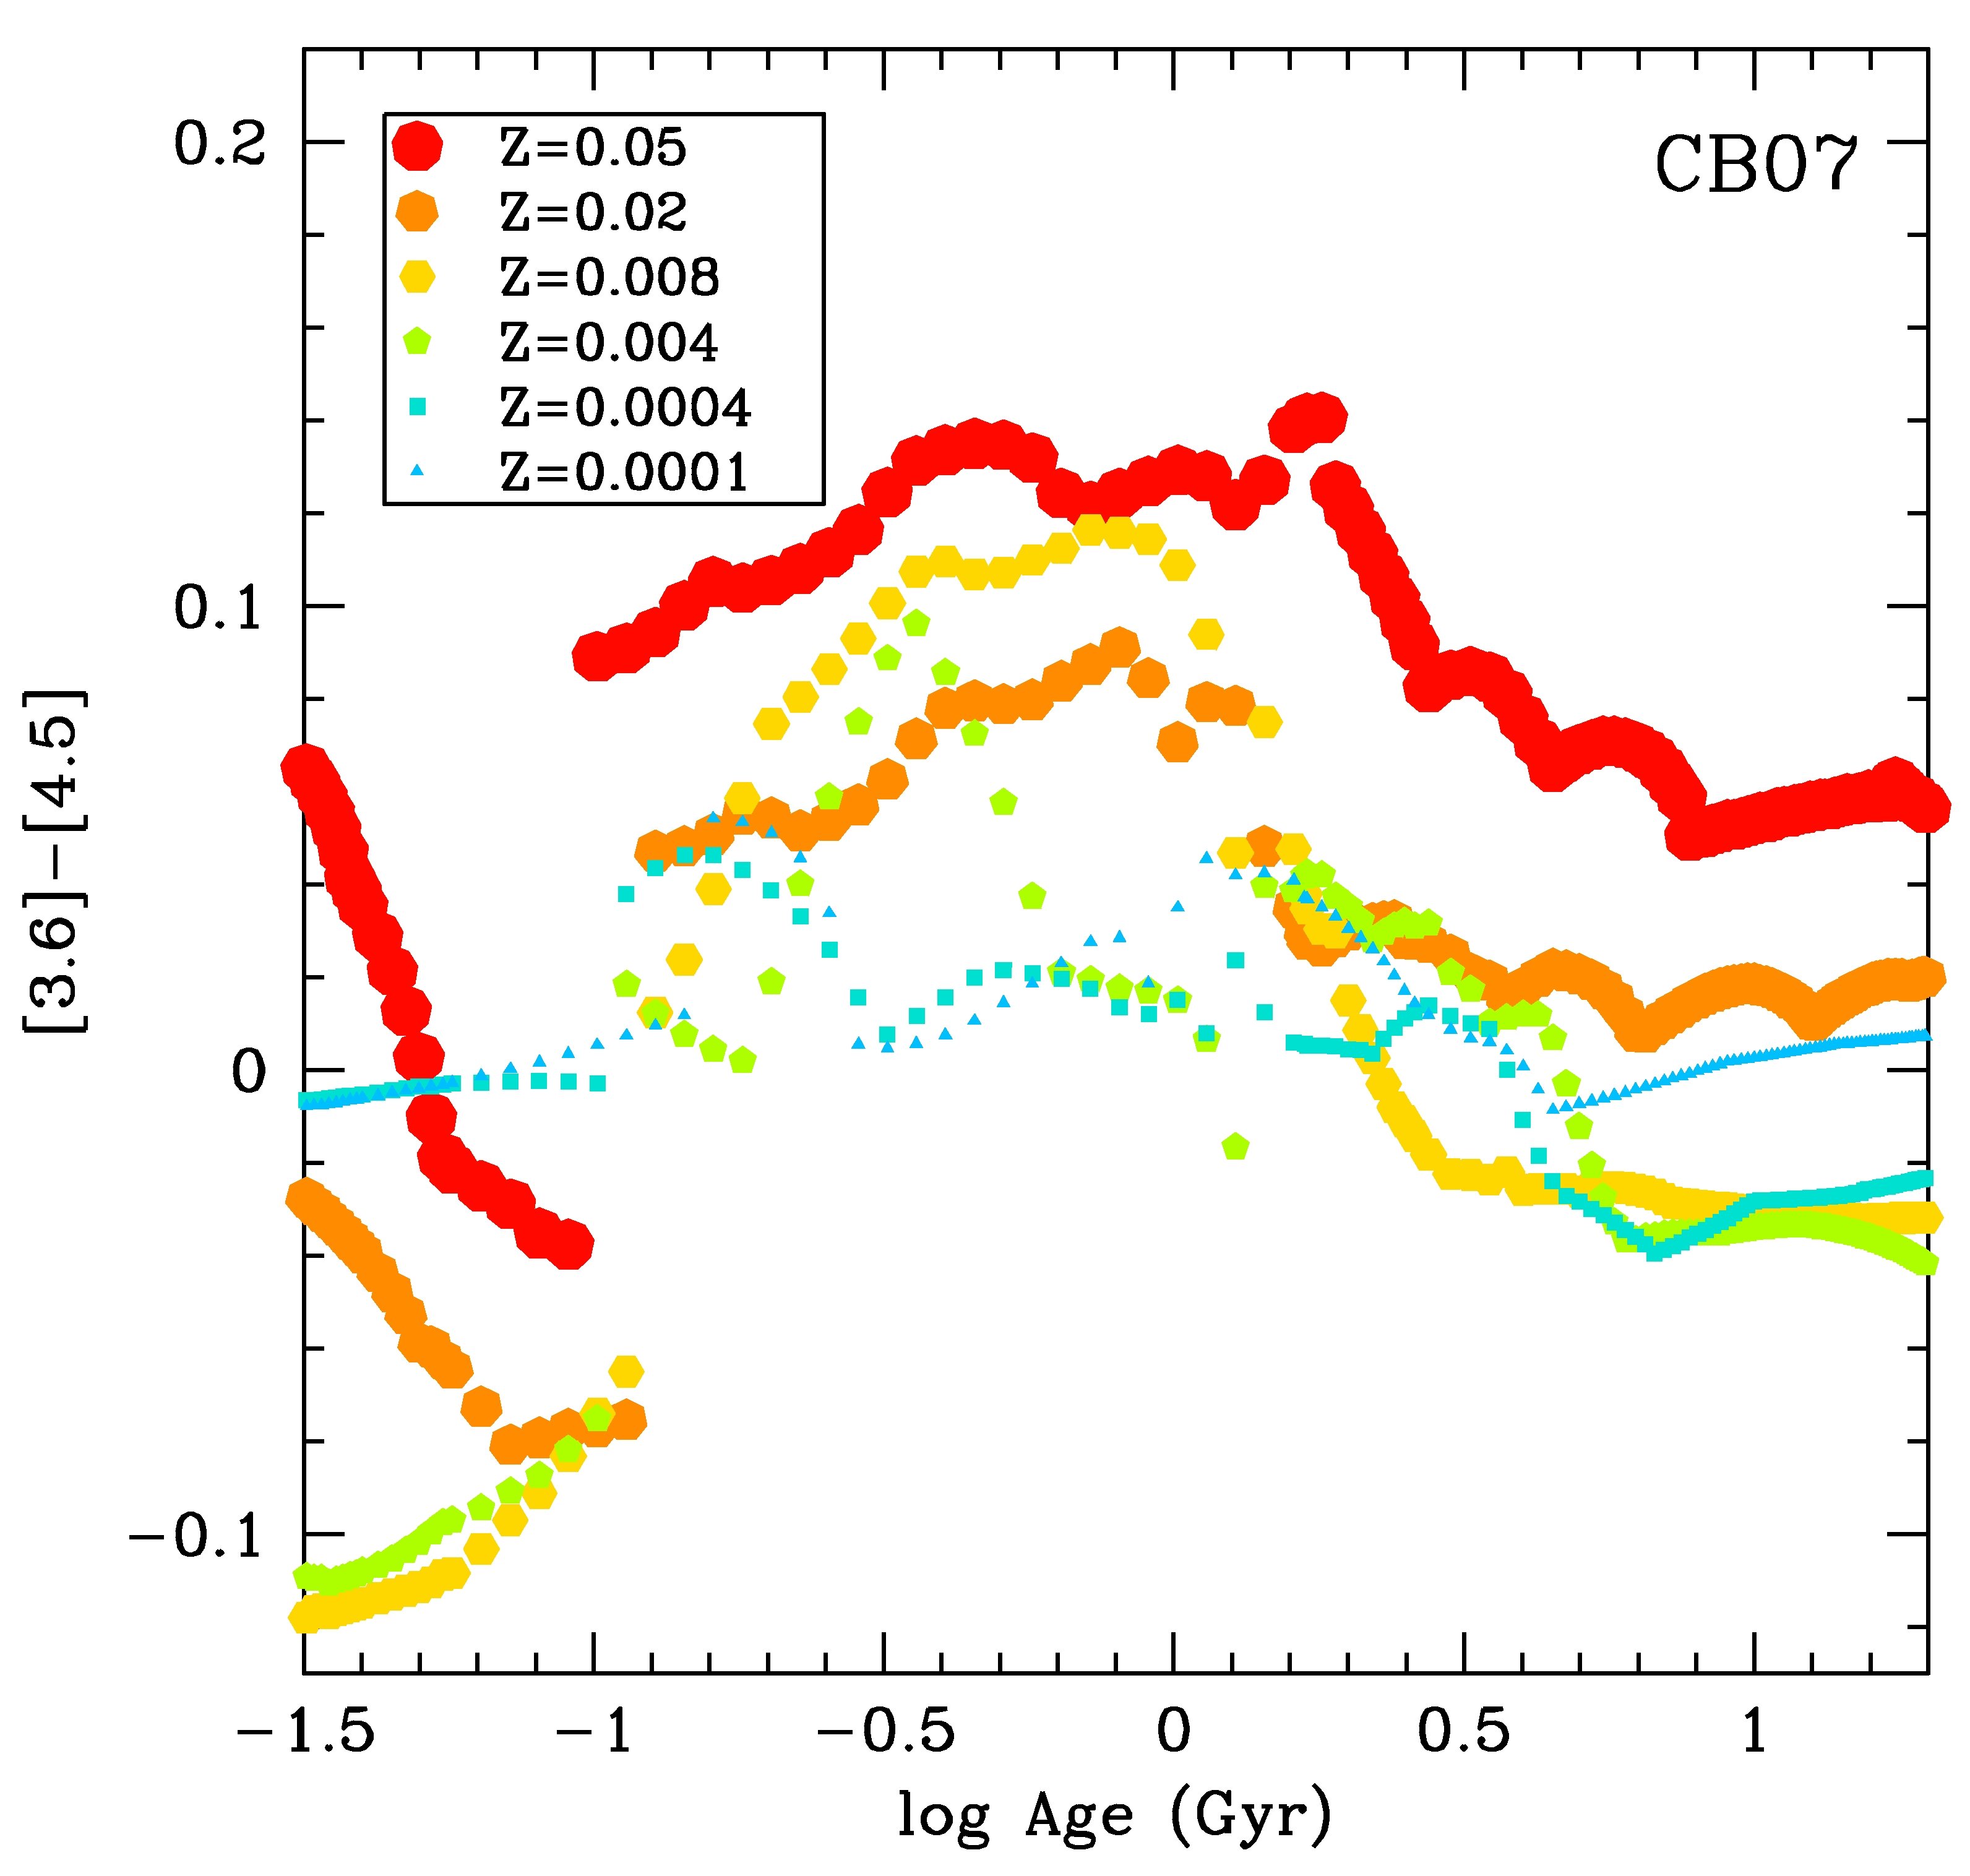
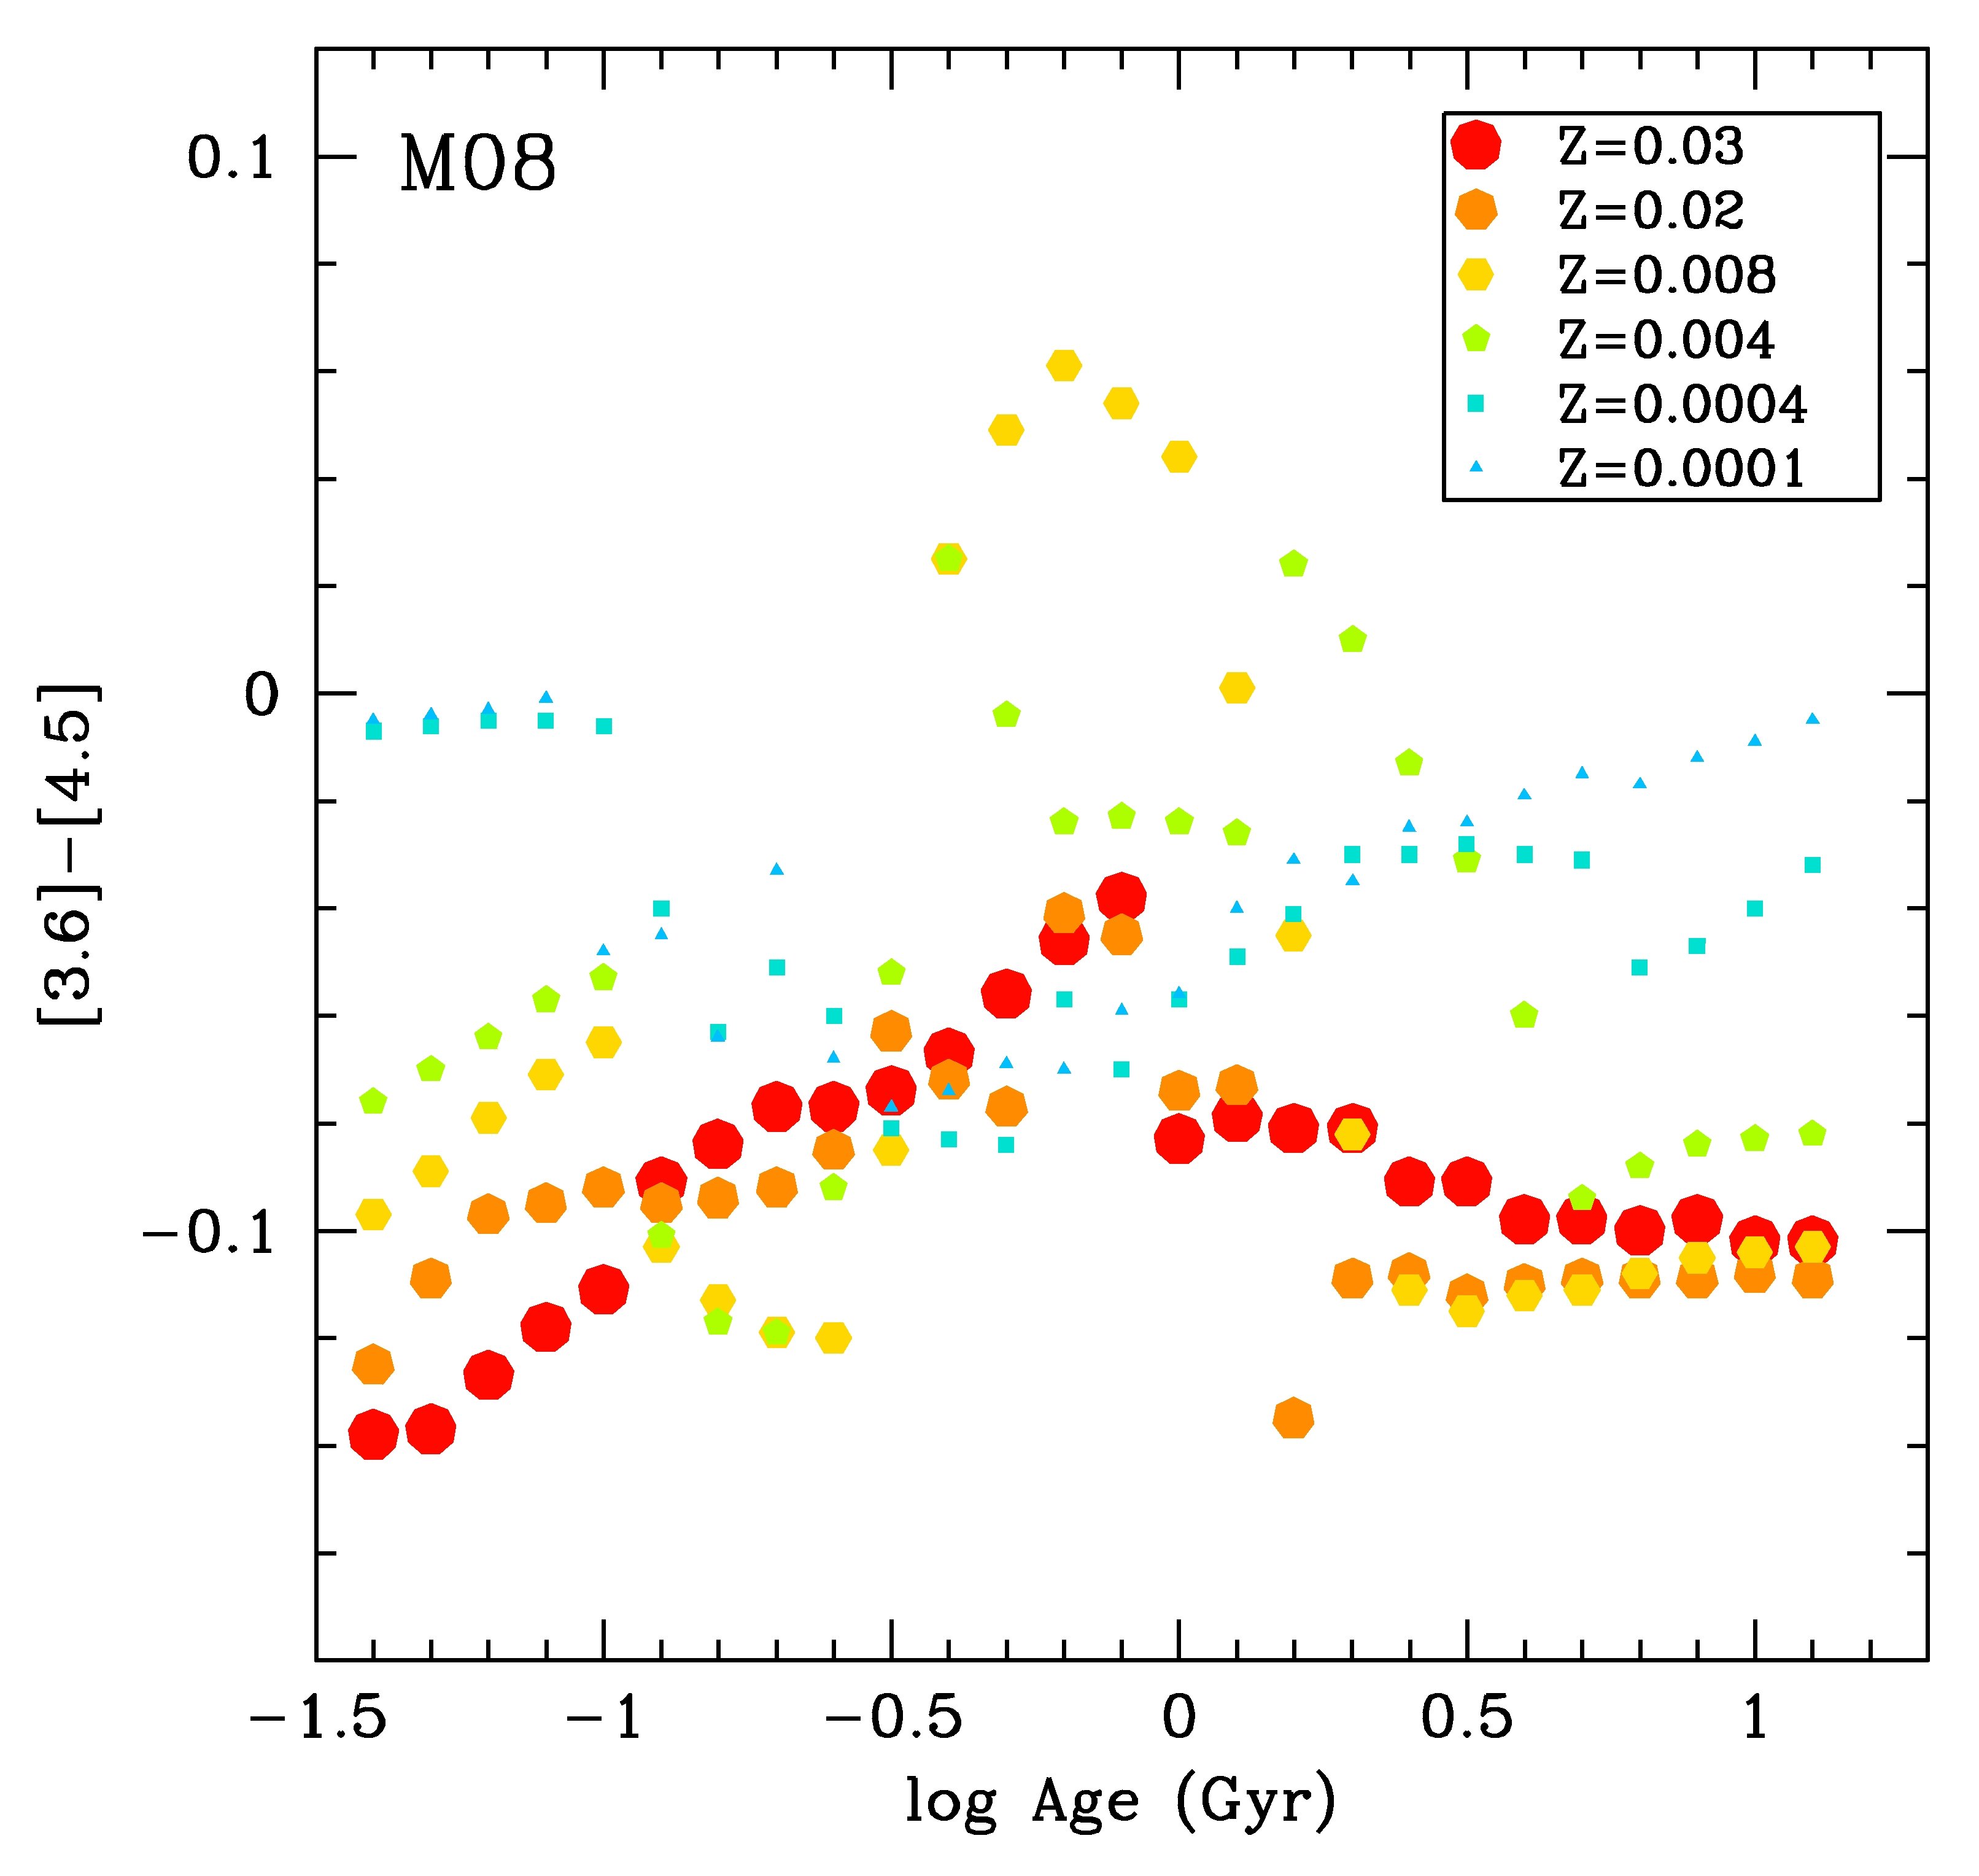
Very few stellar population models are available that try to reproduce the behaviour of galaxies in the Spitzer-IRAC filters. This is due partly to the lack of observational spectra that can be used to test these models, and partly because of the difficulty to model the late stages of stellar evolution, which are the dominant stars at 3.6 and 4.5 m. Here we take a look at the models of Charlot & Bruzual (2007, unpublished) and Marigo et al. (2008). Both models are not independent, since Charlot & Bruzual follow the TP-AGB prescription of Marigo et al. In Fig. 5 we plot the colours of the single age, single metallicity stellar population models of Charlot & Bruzual (2007) and Marigo et al. (2008). The symbols in both figures are the same, except for the highest metallicity (Z=0.05 for Bruzual & Charlot (2003) and Z=0.03 for Marigo et al. (2008)).
In the models of Charlot & Bruzual (2007) the colour becomes redder with increasing metallicity. In Marigo et al. (2008), this behaviour is not seen, and here a much bluer colour is predicted for the highest 3 metallicities, probably because of the inclusion of the CO-band in the 4.5 m filter in their models. For model ages above about 2 Gyr there is almost no metallicity-dependence at Z=0.008 or higher (the regime of our observations, Paper XVII). For younger ages, the colour starts to fluctuate considerably as a function of age and metallicity, in both models, since this is the regime in which AGB stars are prominent. A galaxy population can become bluer by increasing its metallicity, or by adding young ( – year old) AGB stars. The population at 1-2 Gyr is particularly red.
4 Global colour relations
In this section we explore relations between the [3.6] – [4.5] colour and various mass indicators of galaxies in the SAURON sample. We try to find out what the effect of young stellar populations on the [3.6] – [4.5] colour is and how it is affected by metalllicity. In earlier SAURON papers a subset of the sample was identified in which young stellar populations must exist in the presence of on-going star formation, from [OIII]/H emission line ratios, [3.6] – [8.0] Spitzer maps, GALEX UV colours, molecular CO observations and optical line strength indices. It was found that these star-forming galaxies in the SAURON sample are the minority of the population, with the exact fraction depending on the tracer used (5/48: from [OIII]/H emission line ratios, Paper V; 9/34: from UV emission, Paper XIII). Of the 48 SAURON galaxies, roughly half have 8.0m non-stellar maps with significant power. In 8 of the 48 SAURON galaxies, there is strong evidence that the 8.0m non-stellar flux reflects PAH transitions excited by young stars. For these the 8.0m maps are consistent with those of H absorption line strength and the blue GALEX colors. Mostly the star formation is centrally concentrated.
In Falcón-Barroso et al. (2011) the V-[3.6] – magnitude and V-[3.6] – relations are studied. Here it was found that the SAURON sample shows a tight colour – relation, with an even smaller scatter for the slow rotators. Spirals also lie on these relations, albeit with more scattter. The colour – relation is relatively hard to analyze, since the V-[3.6] colour is affected by both young stellar populations and dust extinction. Since dust and young stellar populations are often found together, objects in the SAURON sample with wide spread star formation (e.g., NGC 3032, NGC3156, NGC4150, NGC3489) do not display the bluest colour for a given velocity dispersion. Here we analyze the [3.6]-[4.5] colour, which is little affected by extinction, and which for that reason might be easier to interpret.
4.1 The [3.6]-[4.5] – relation
In the past, the colour-magnitude relation, and later also the colour- relation have played an important role to investigate the nature of early-type galaxies. Here the central velocity dispersion and total magnitude are used as proxies of galaxy mass, and the colour as a stellar population indicator. We also use the total stellar mass, from Jeans modelling (Scott et al., Paper XIV). In rough terms, it is believed that along the relation, on the red sequence, the mass of galaxies increases, possibly with slight changes in average age, while deviations from the relation are caused by the presence of young stellar populations, extinction by dust, and possibly objects that are dynamically young, e.g. merger remnants.
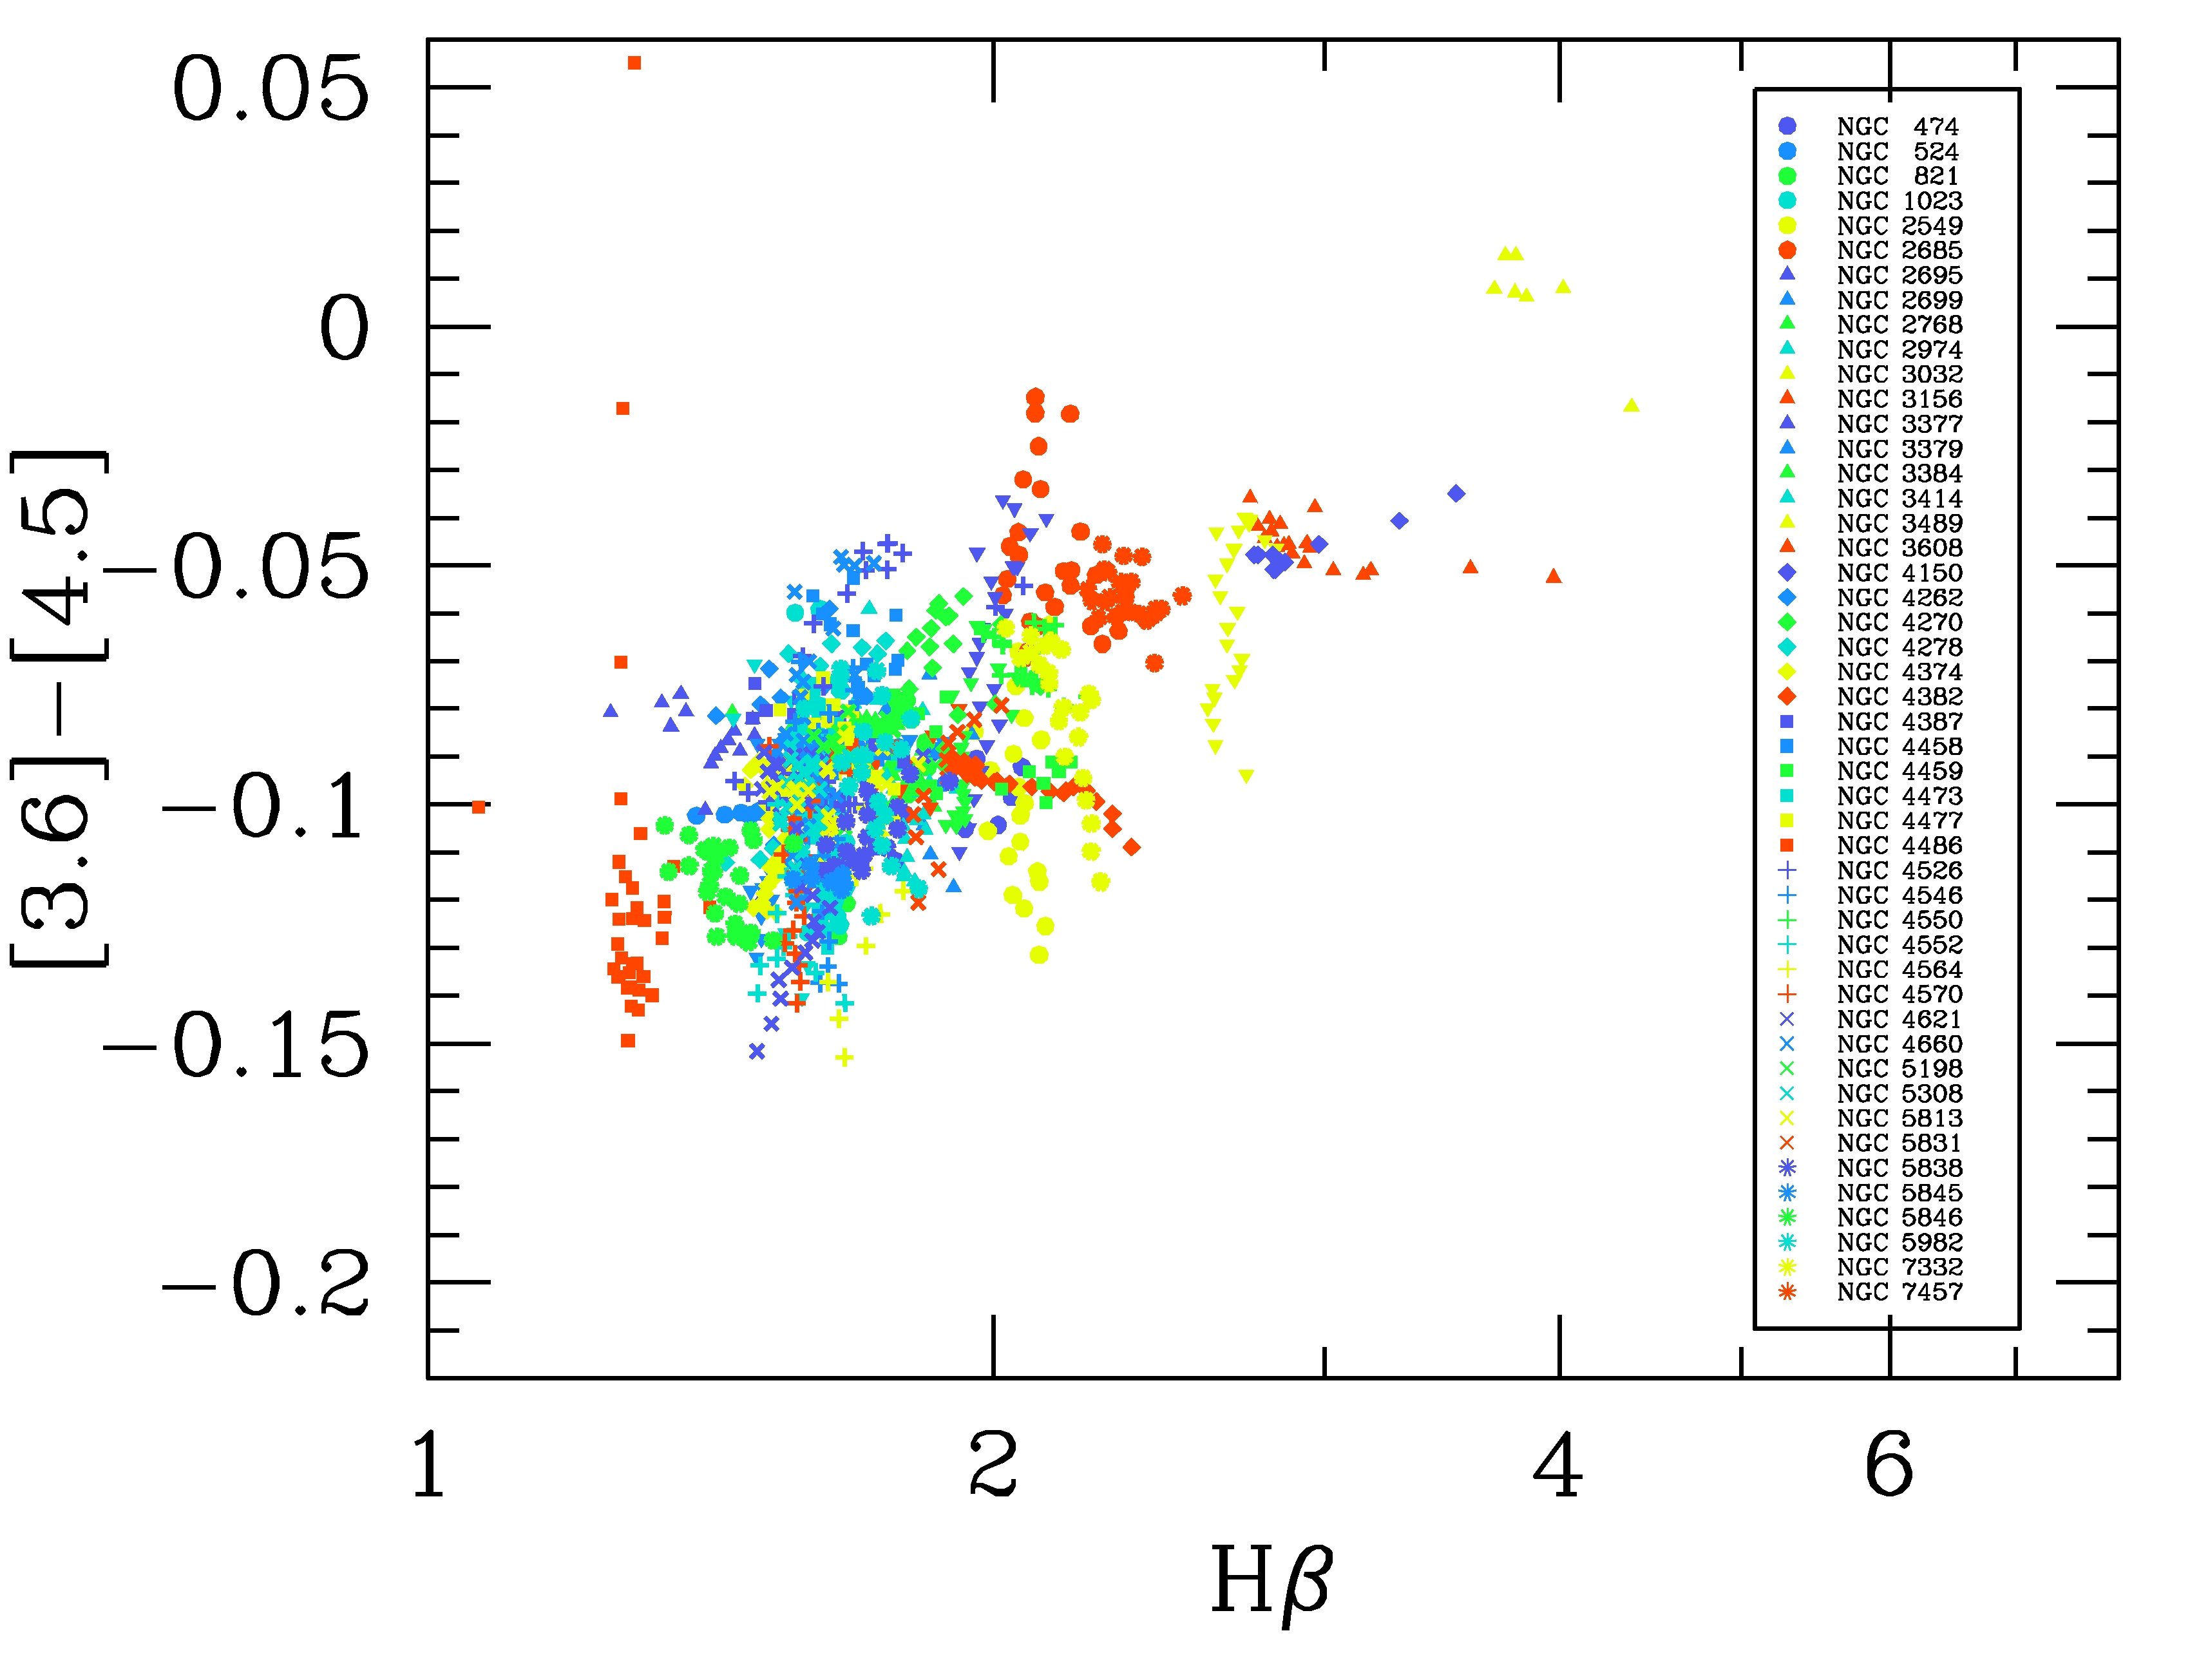
Since in other papers of the SAURON series many quantities have been calculated in circular apertures of radius and , we have used these apertures throughout the paper. In Fig.6 and 7 we show the vs. relation for these two apertures. In Fig. 6 the colour inside is given, while in Fig. 7 the aperture is used. For the velocity dispersion, we always use the value within in this paper, since this gives the least scatter. The points have been coloured with the SSP-age within (from Paper XVII). Had we used ages within , the figures would have been similar, but with a smaller range in colours. This is because in these early-type galaxies many more young features are seen in the inner parts than further out (Paper XVII, Paper V, Paper VI, Paper XIII). In Fig. 6 and Fig. 7 we have plotted the error bars in the colours that are due to uncertainties in the sky background. In Fig. 7 these errors are much smaller than the dispersion in the points. The figures also show linear fits obtained using the least squares method. All linear fits in this paper have been obtained using the program FITEXY from the IDL Astro-library (Landsman 1993) has been used, with errors in both variables. The errors in have been taken to be 5% (Paper XIX), and the colours a photometric uncertainty of 0.005 mag has been added quadratically to the sky background errors described above. The fit shows that there is a strong dependence of the m colour on the velocity dispersion in both apertures, with an additional RMS scatter, not explained by observational uncertainties, of 0.013 mag for the aperture and 0.023 mag for r=.
The colour- relation shows that more massive galaxies are bluer. The colour coding shows that these galaxies are at the same time older, if one considers the luminosity-weighted SSP-ages. We see that[3.6]-[4.5] within is on the average 0.02 mag bluer than within , something that is due to colour gradients within the galaxies. We find that the scatter within is somewhat larger than within . At first view the interpretation seems to be rather straightforward. There is a strong correlation between colour and the mass indicator (), analogous to the , and relations of Bower, Lucey & Ellis (1992), and the –[3.6] vs. relation of Paper XIX. The main difference is that the colour becomes bluer for increasing galaxy mass/luminosity. Before we can interpret this fact, we first need to look at the behavior of the [3.6] - [4.5] colour in some more detail.
4.2 Clues on interpreting the [3.6]–[4.5] colour.
A rough comparison with the stellar population models shows that none of these sets of models is very suitable to explain our observations. For stellar populations above 2 Gyr, the models of Charlot & Bruzual (2007) are probabaly not accurate enough, since they do not reproduce the sign of the observed colour-metallicity relation. The models of Marigo et al. (2008) are also not very adequate, since they also do not show much blueing as a function of metallicity at high metallicities. At least, their predicted colours are more or less in agreement with the observations: [3.6] - [4.5] –0.1 for old stellar populations. The models below 2 Gyr are obviously much more complicated, making it hard to believe any precise predictions here. What we can say, probably, is that the colour fluctuates considerably with age and metallicity, that very blue colours can in principle be explained by adding young AGB stars.
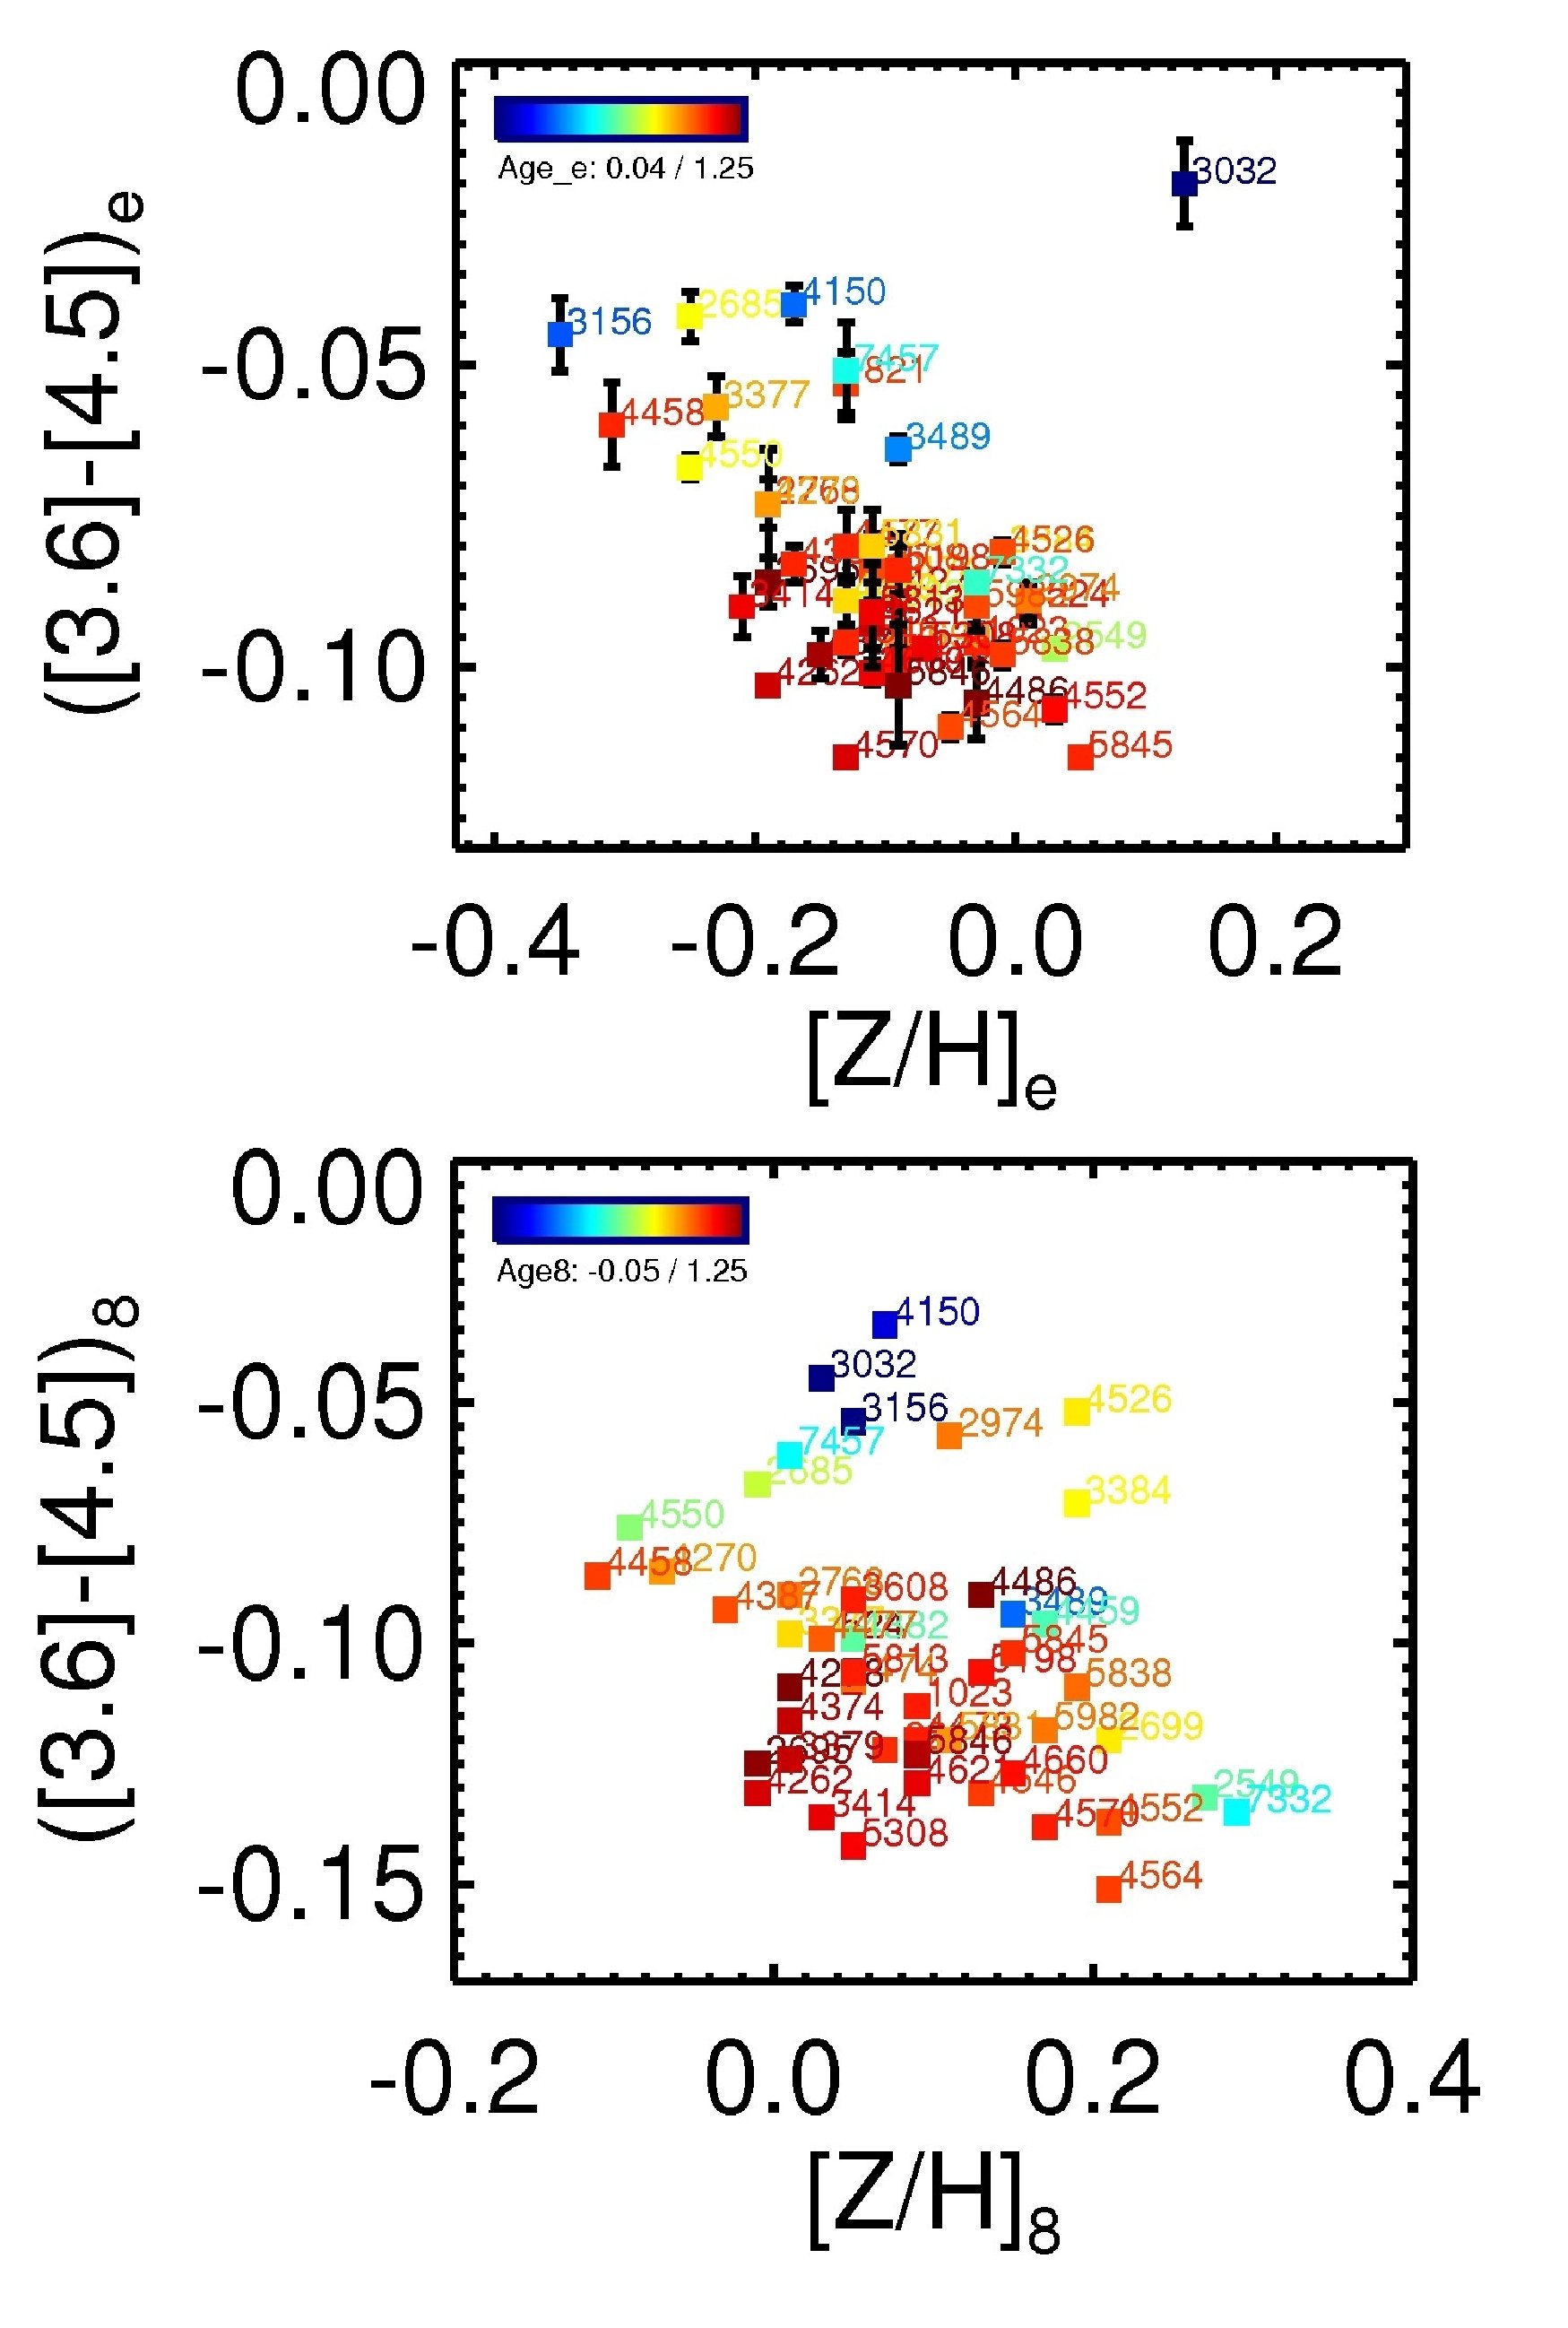
Next, we make an empirical comparison between the [3.6] - [4.5] colour and the metallicity, from Paper XVII, obtained using SSP fitting to the SAURON spectra (Fig. 8). It is clear that the scatter for the colours inside re/8 is larger than inside re. The reason for this is that in the center one often sees a combination of old and young stellar populations at the same place. When one then analyzes the combined stellar populations as stellar population with a single age and metallicity, one can obtain metallicities that are too large (e.g. Allard et al. 2006). An extreme example here is NGC 3032. Concentrating on Fig. 8a, one sees that there is a good correlation between metallicity [Z/H] and the [3.6] - [4.5] colour, indicating that for this sample the [3.6] - [4.5] colour is a good metallicity-indicator. Younger galaxies, are generally found above the mean relation, indicating that younger stellar populations cause the [3.6] - [4.5] colour to redden.
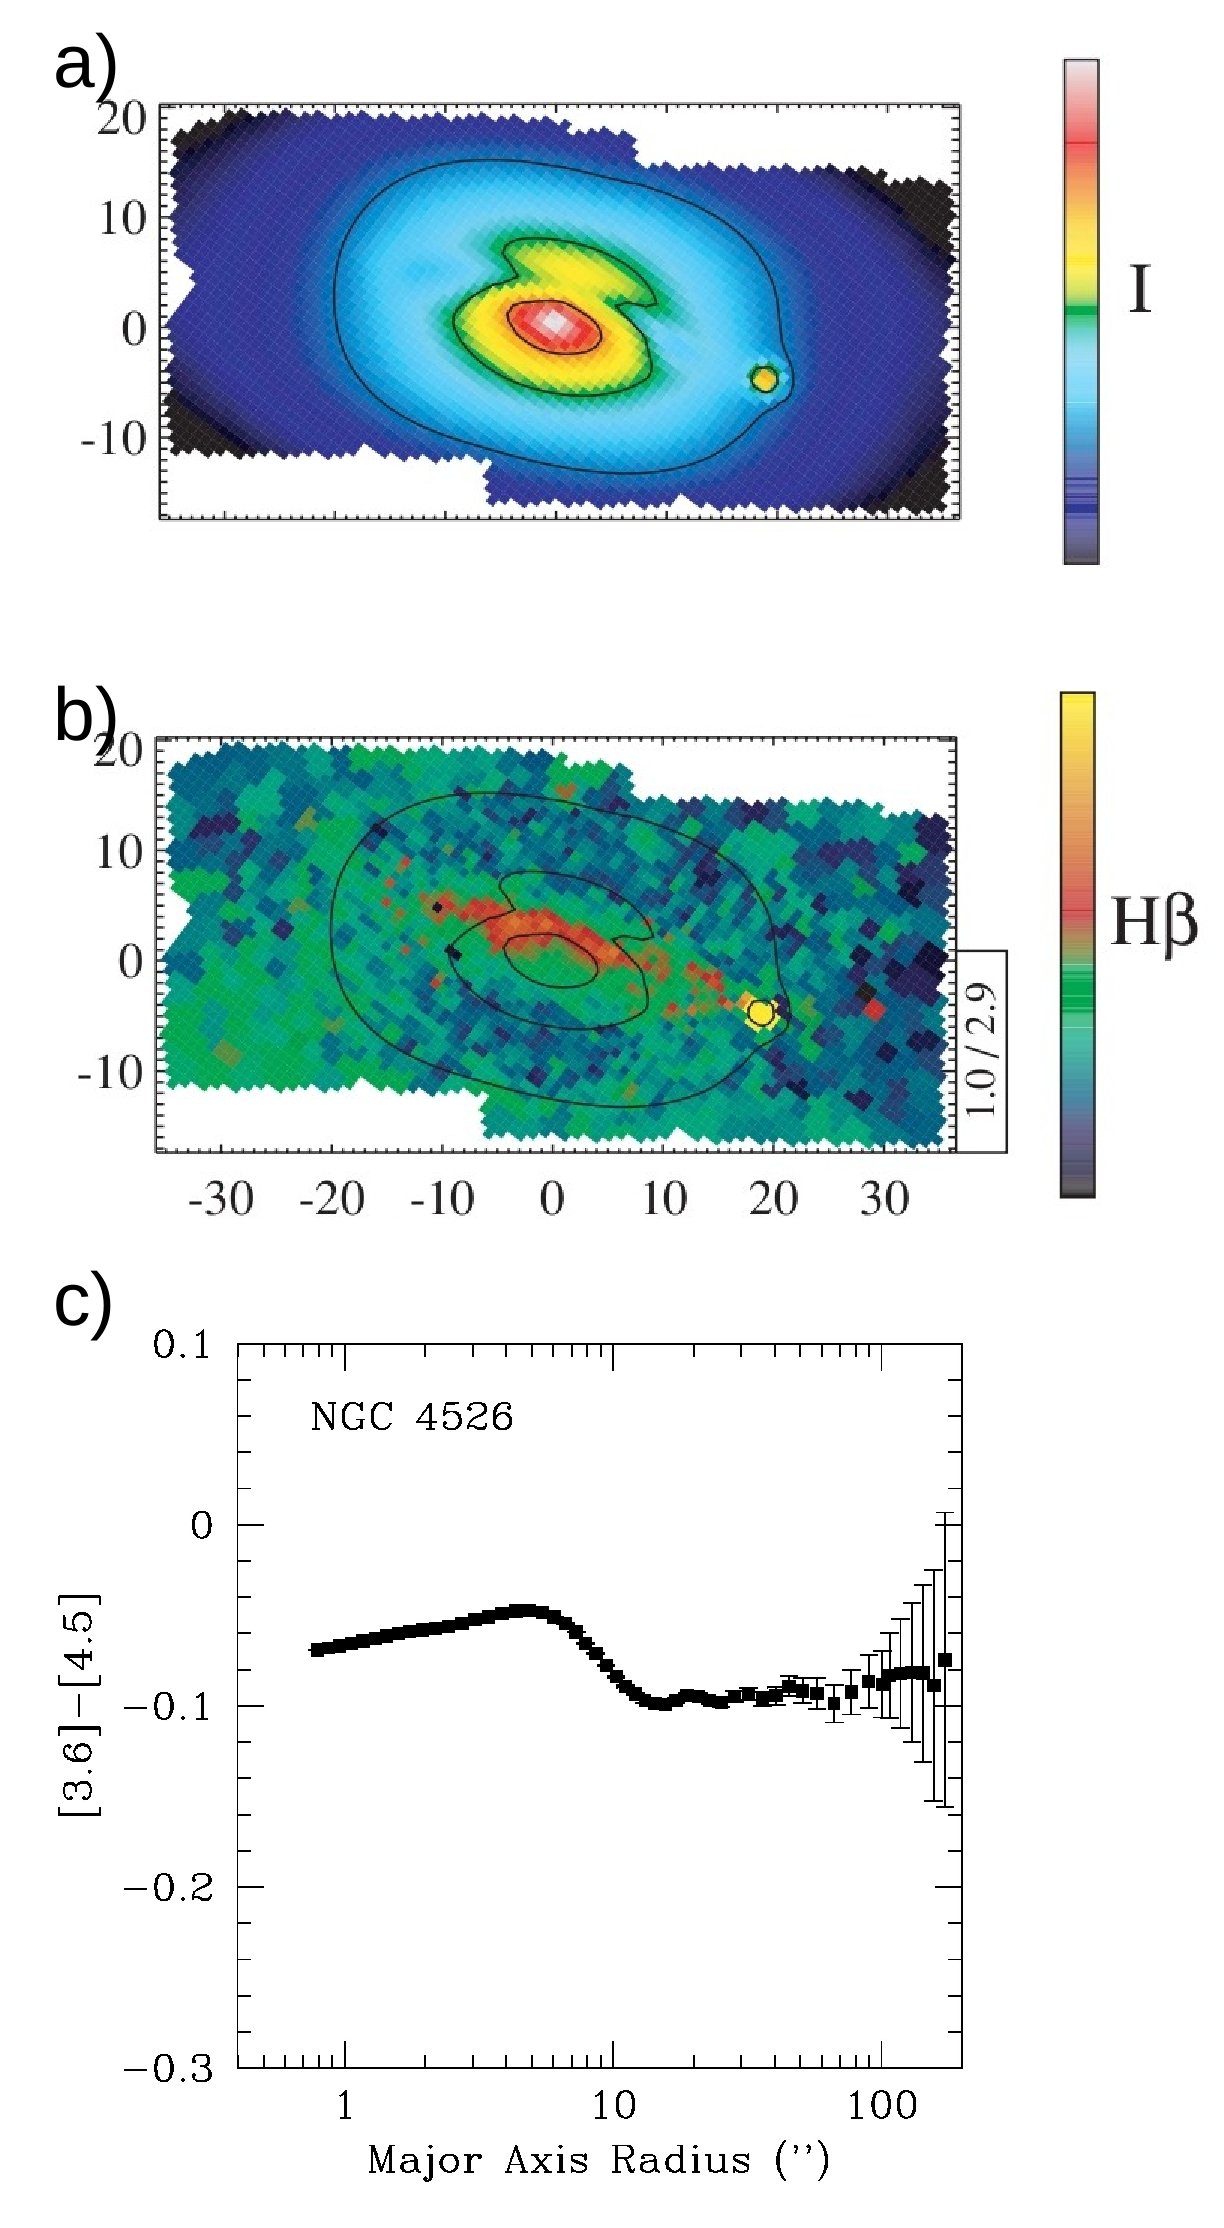
An outlier in Fig. 7 is NGC 4526. It is instructive to study its colour profile, to understand why this galaxy is an outlier. In Fig. 9c one can see that the galaxy has a regular colour profile, the colour becoming redder slowly going outward, starting at about 12′′. Inside this radius the colour is significantly redder. In the upper 2 panels of the same figure one can see why this is the case. The galaxy has a disk in the inner 12′′, which can be seen in extinction in the continuum image. The disk also contains younger stellar populations, which can be seen from its high values in the H absorption image. Note that this image has been corrected for emission: the inner disk also contains strong emission lines (see Paper VI). As a result of the young stars, the CO-absorption band in the 4.5 m filter becomes less deep, causing the [3.6] - [4.5] colour to redden. The same effect is seen in many other galaxies, where the presence of young stars in the line strength images of paper VI, or the presence of H in emission in Paper V, is often accompanied by a redder [3.6] - [4.5] colour. Examples are NGC 3032, NGC 3384, NGC 4459 and NGC 5838. Since the young populations generally are concentrated only in the central areas, they affect the colours within much more than the one within .
4.3 Central point sources
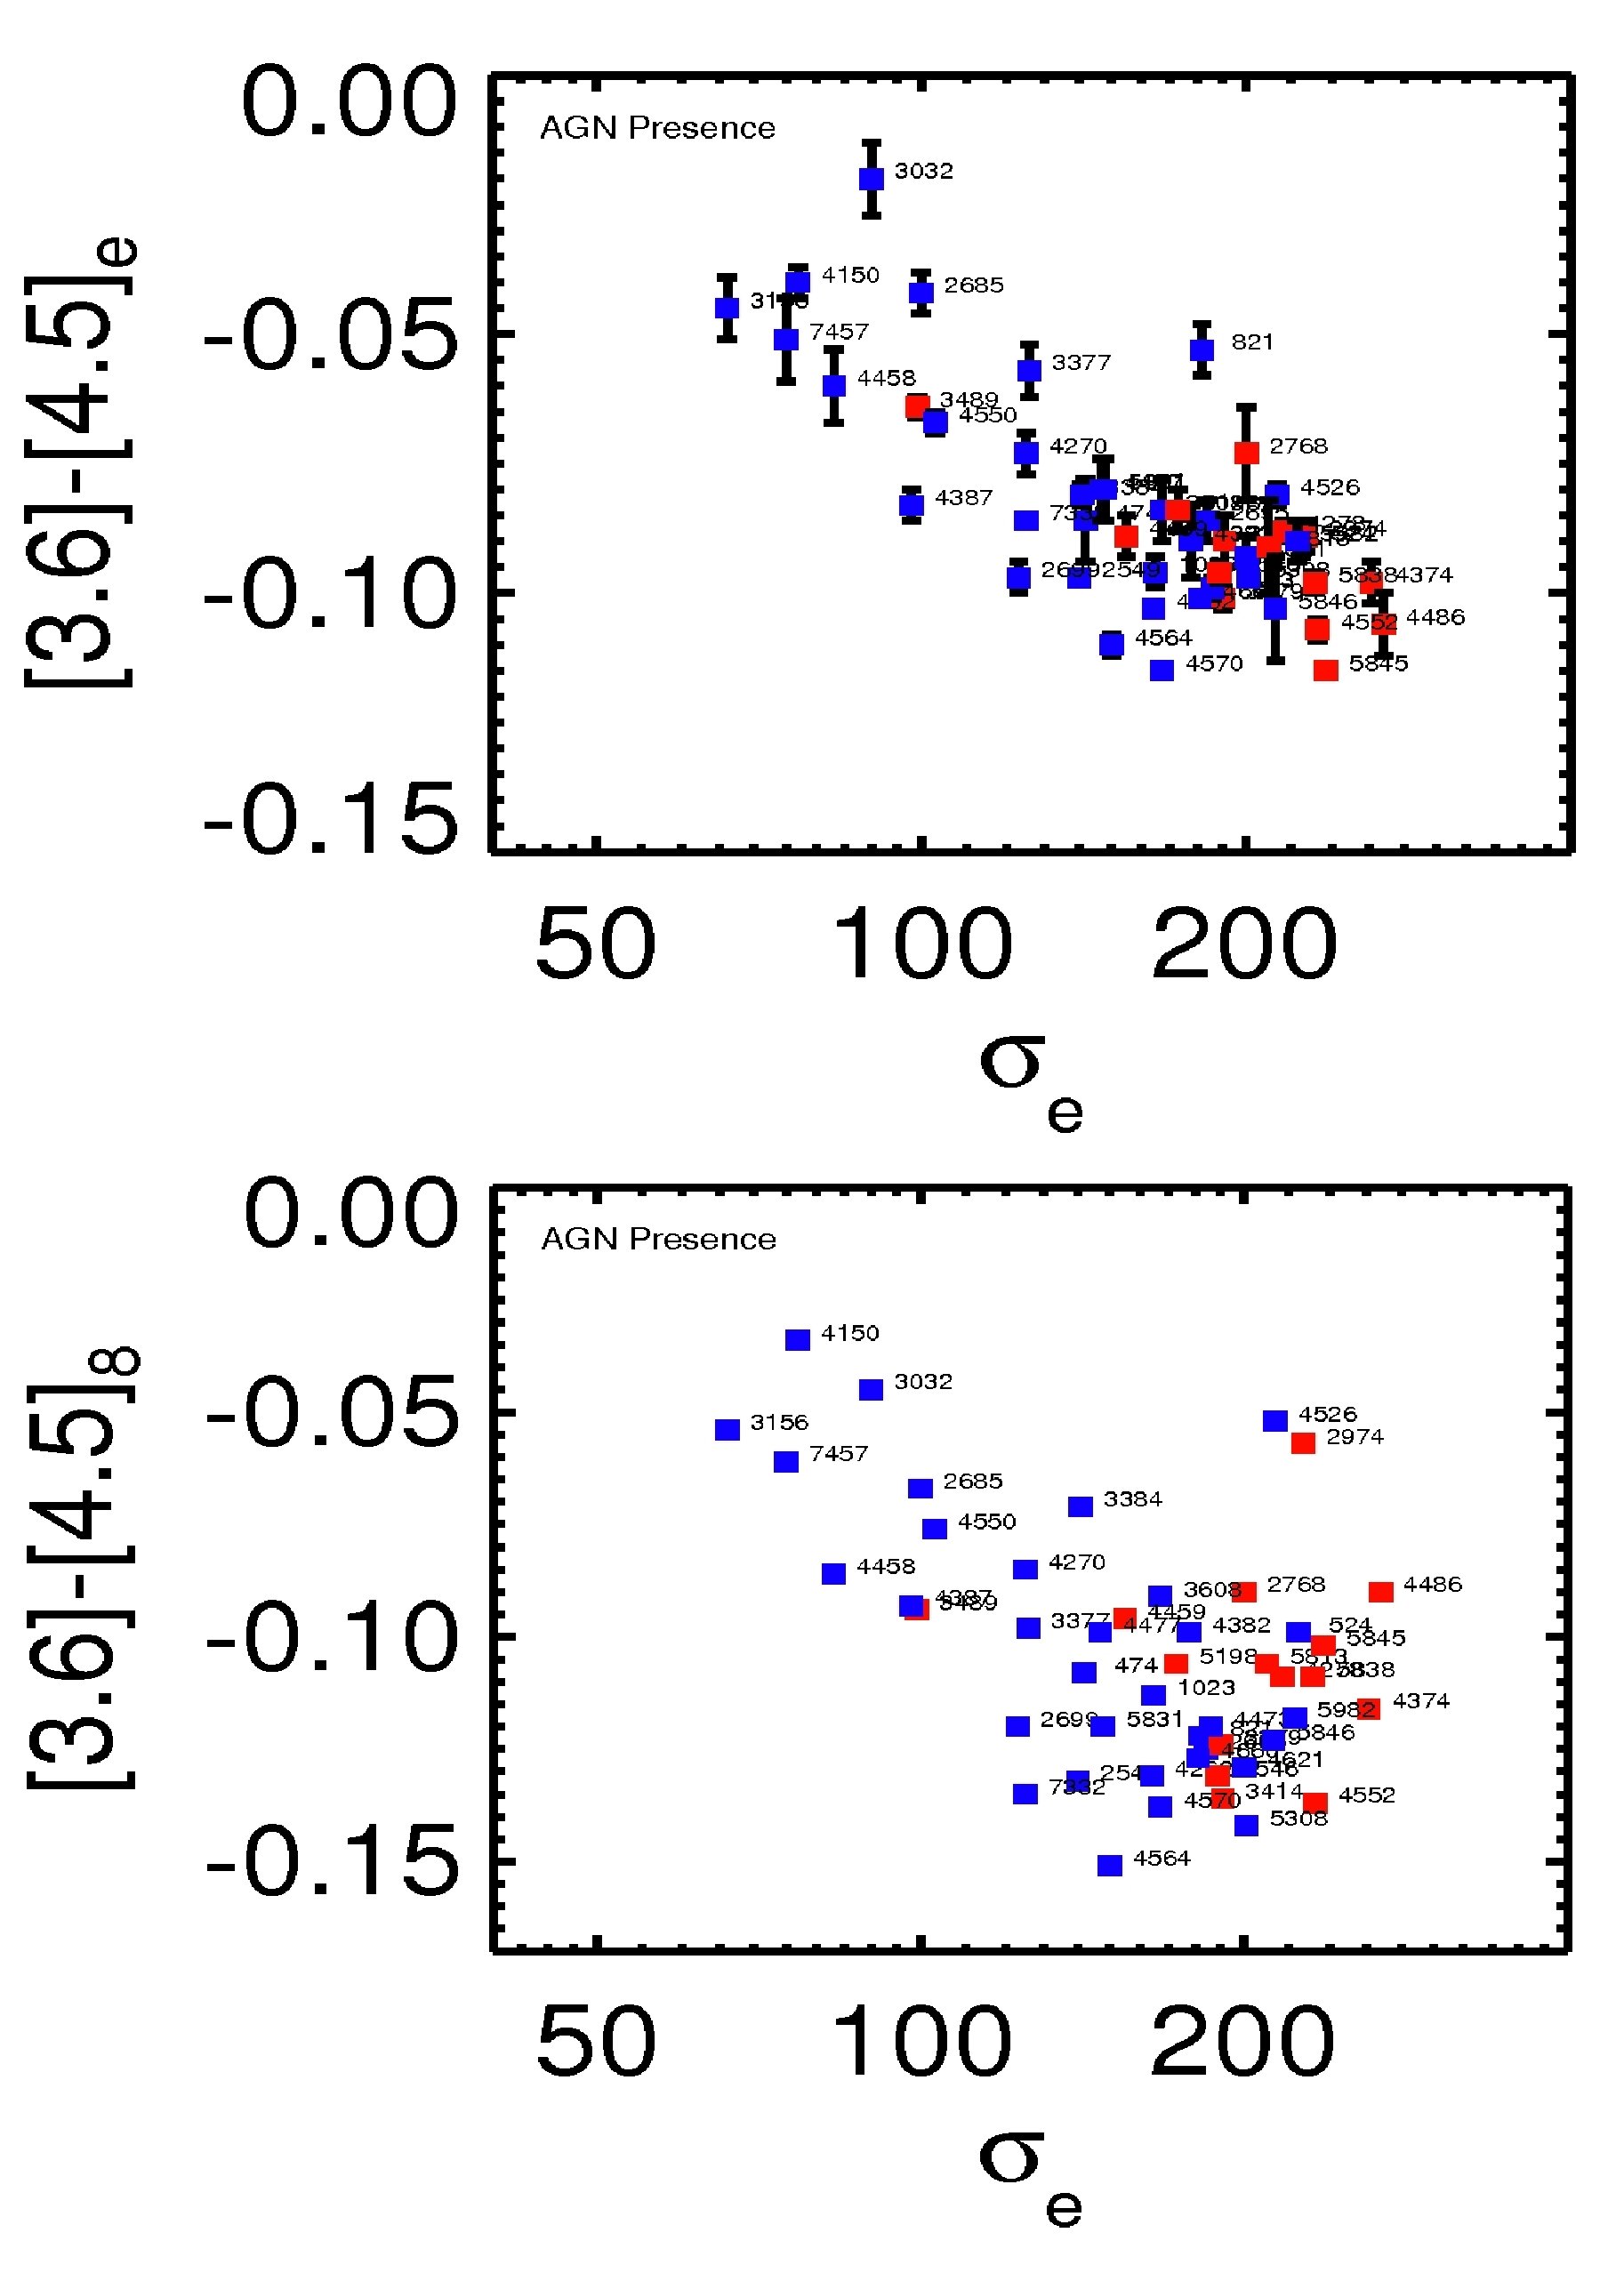
Inspecting Fig.7 we see a number of outliers above the colour- relation, that have [3.6] - [4.5] colours redder than expected for their . Although this could be due to contributions from young stellar populations, it could also be that non-thermal light from AGNs is causing this effect. The prime example here in M87 (NGC 4486), for which there is no independent evidence for young stellar populations. Other options are NGC 2768 and 2974. NGC 4486 especially is remarkable. In Fig. 4 one sees that this galaxy has a very red central pointsource, while for the rest of the profile the colour is almost constant. Its colour profile has been made while masking out the jet, but not the center. In the optical this galaxy shows a blue central point source (e.g. Biretta et al. 1991). AGNs generally show a synchrotron spectrum, appearing bluer than the stellar light in the optical and redder in the infrared (Polletta et al. 2006). Tang et al. (2009) studied Spitzer IRAC colours of a sample of 36 local elliptical galaxies. They detect non-stellar infrared emission in 9 of them. All of these show AGN-like optical spectra, and are classified as 8 Liners and 1 transition object using the classification of Ho et al. (1997). Not all AGNs observed, however, show this infrared excess. Tang et al. conclude that this infrared excess appears only and universally in galaxies with a relatively luminous central AGN.
Here we try to reproduce their result. We have selected the AGNs in our sample by selecting all 15 galaxies that have a compact radio source, as detected by the VLA FIRST survey (Becker, White & Helfand 1995, Paper XVI). These galaxies have been represented in red in Fig. 10. One sees that the galaxies that contain an AGN preferentially lie above the colour - relation. This effect is stronger in Fig. 10b, where the colour inside re/8 is given, which is obviously more affected by the AGN than the colour inside re. We are seeing that the integrated colour is redder than for galaxies without AGNs. This could be due to the non-thermal light of the AGN (e.g. in NGC 4486) or the hot dust around it, but also due to younger stars near the center, which dilute the 4.5 m feature. The red light clearly is centrally concentrated, which agrees with the fact that Sarzi et al. (2010, Paper XVI) conclude that a central AGN source could be responsible for the ionization of the gas in the very central regions (2-3′′). The galaxies with an AGN are mostly the largest galaxies - they tend to be dominated by old stellar populations. The fact that in optical line indices the effects of the AGN are generally not seen might indicate that we are seeing here the hot dust (or non-thermal emission) around the AGN.
In a paper studying all Spitzer-IRAC colours of the SAURON-Sa sample Van der Wolk et al. (in preparation) discuss the behaviour of AGN in this complementary sample in more detail, using all four IRAC colours.
4.4 Scatter in the [3.6] – [4.5] – relation
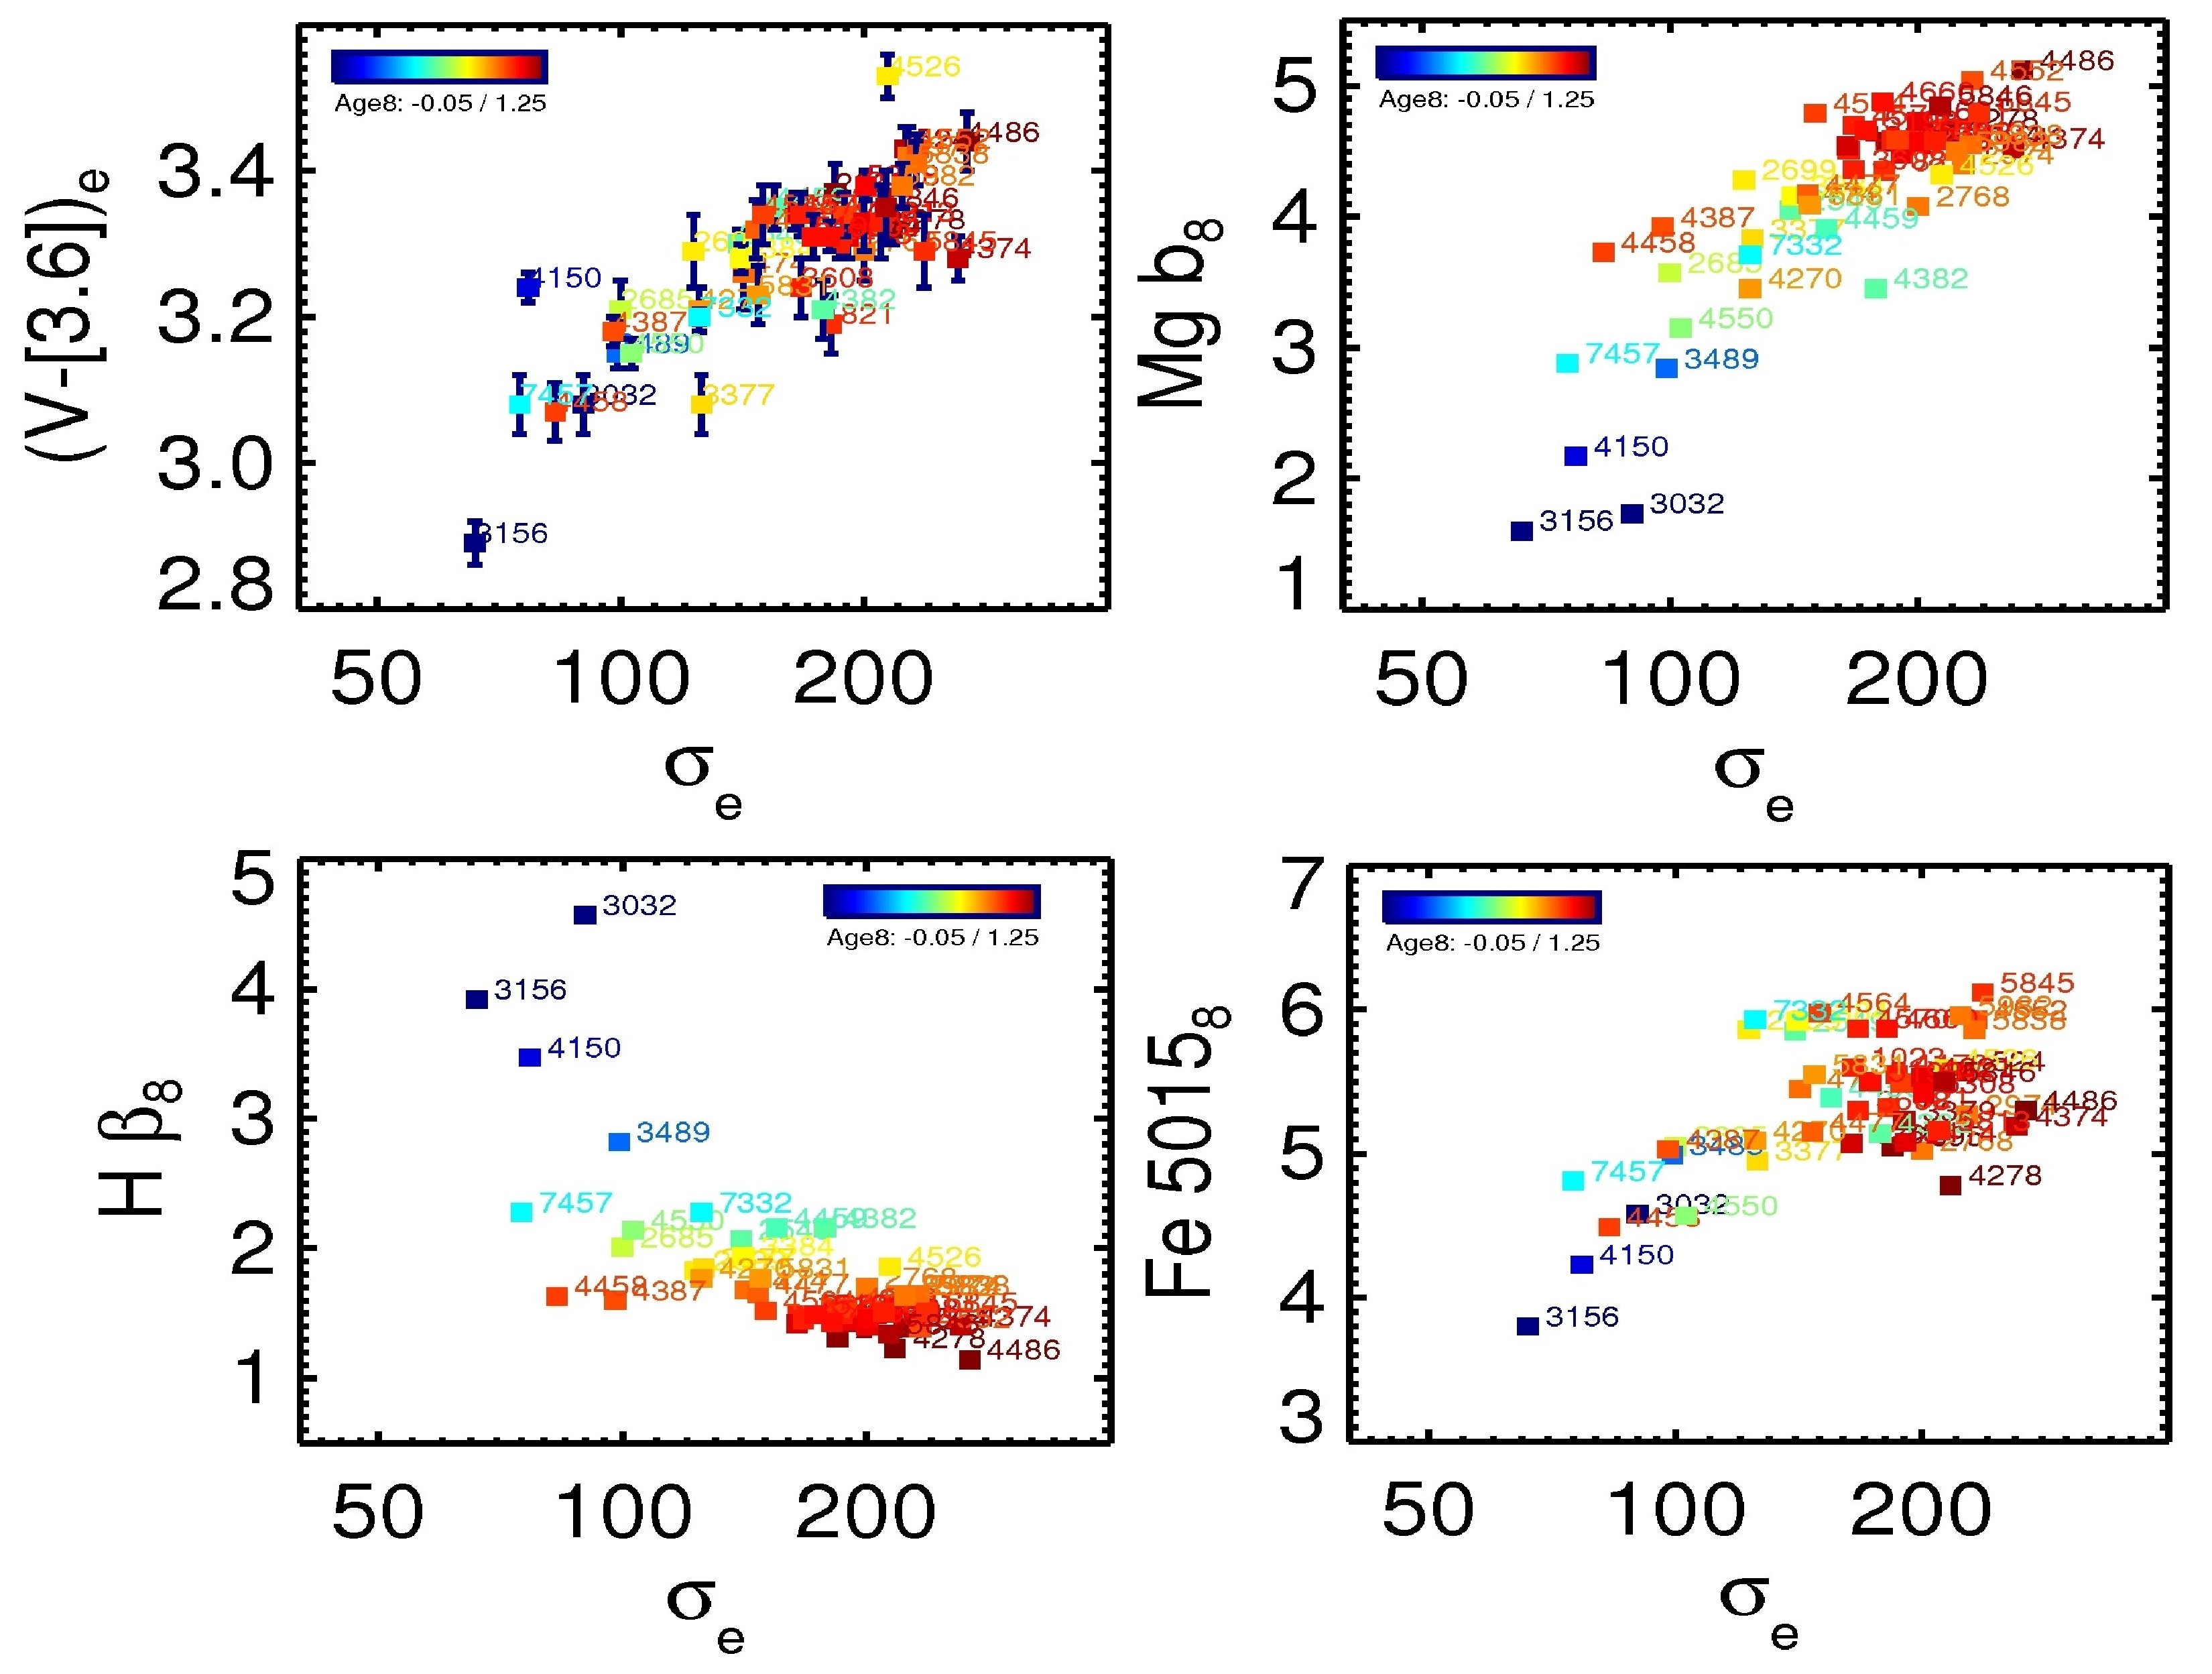
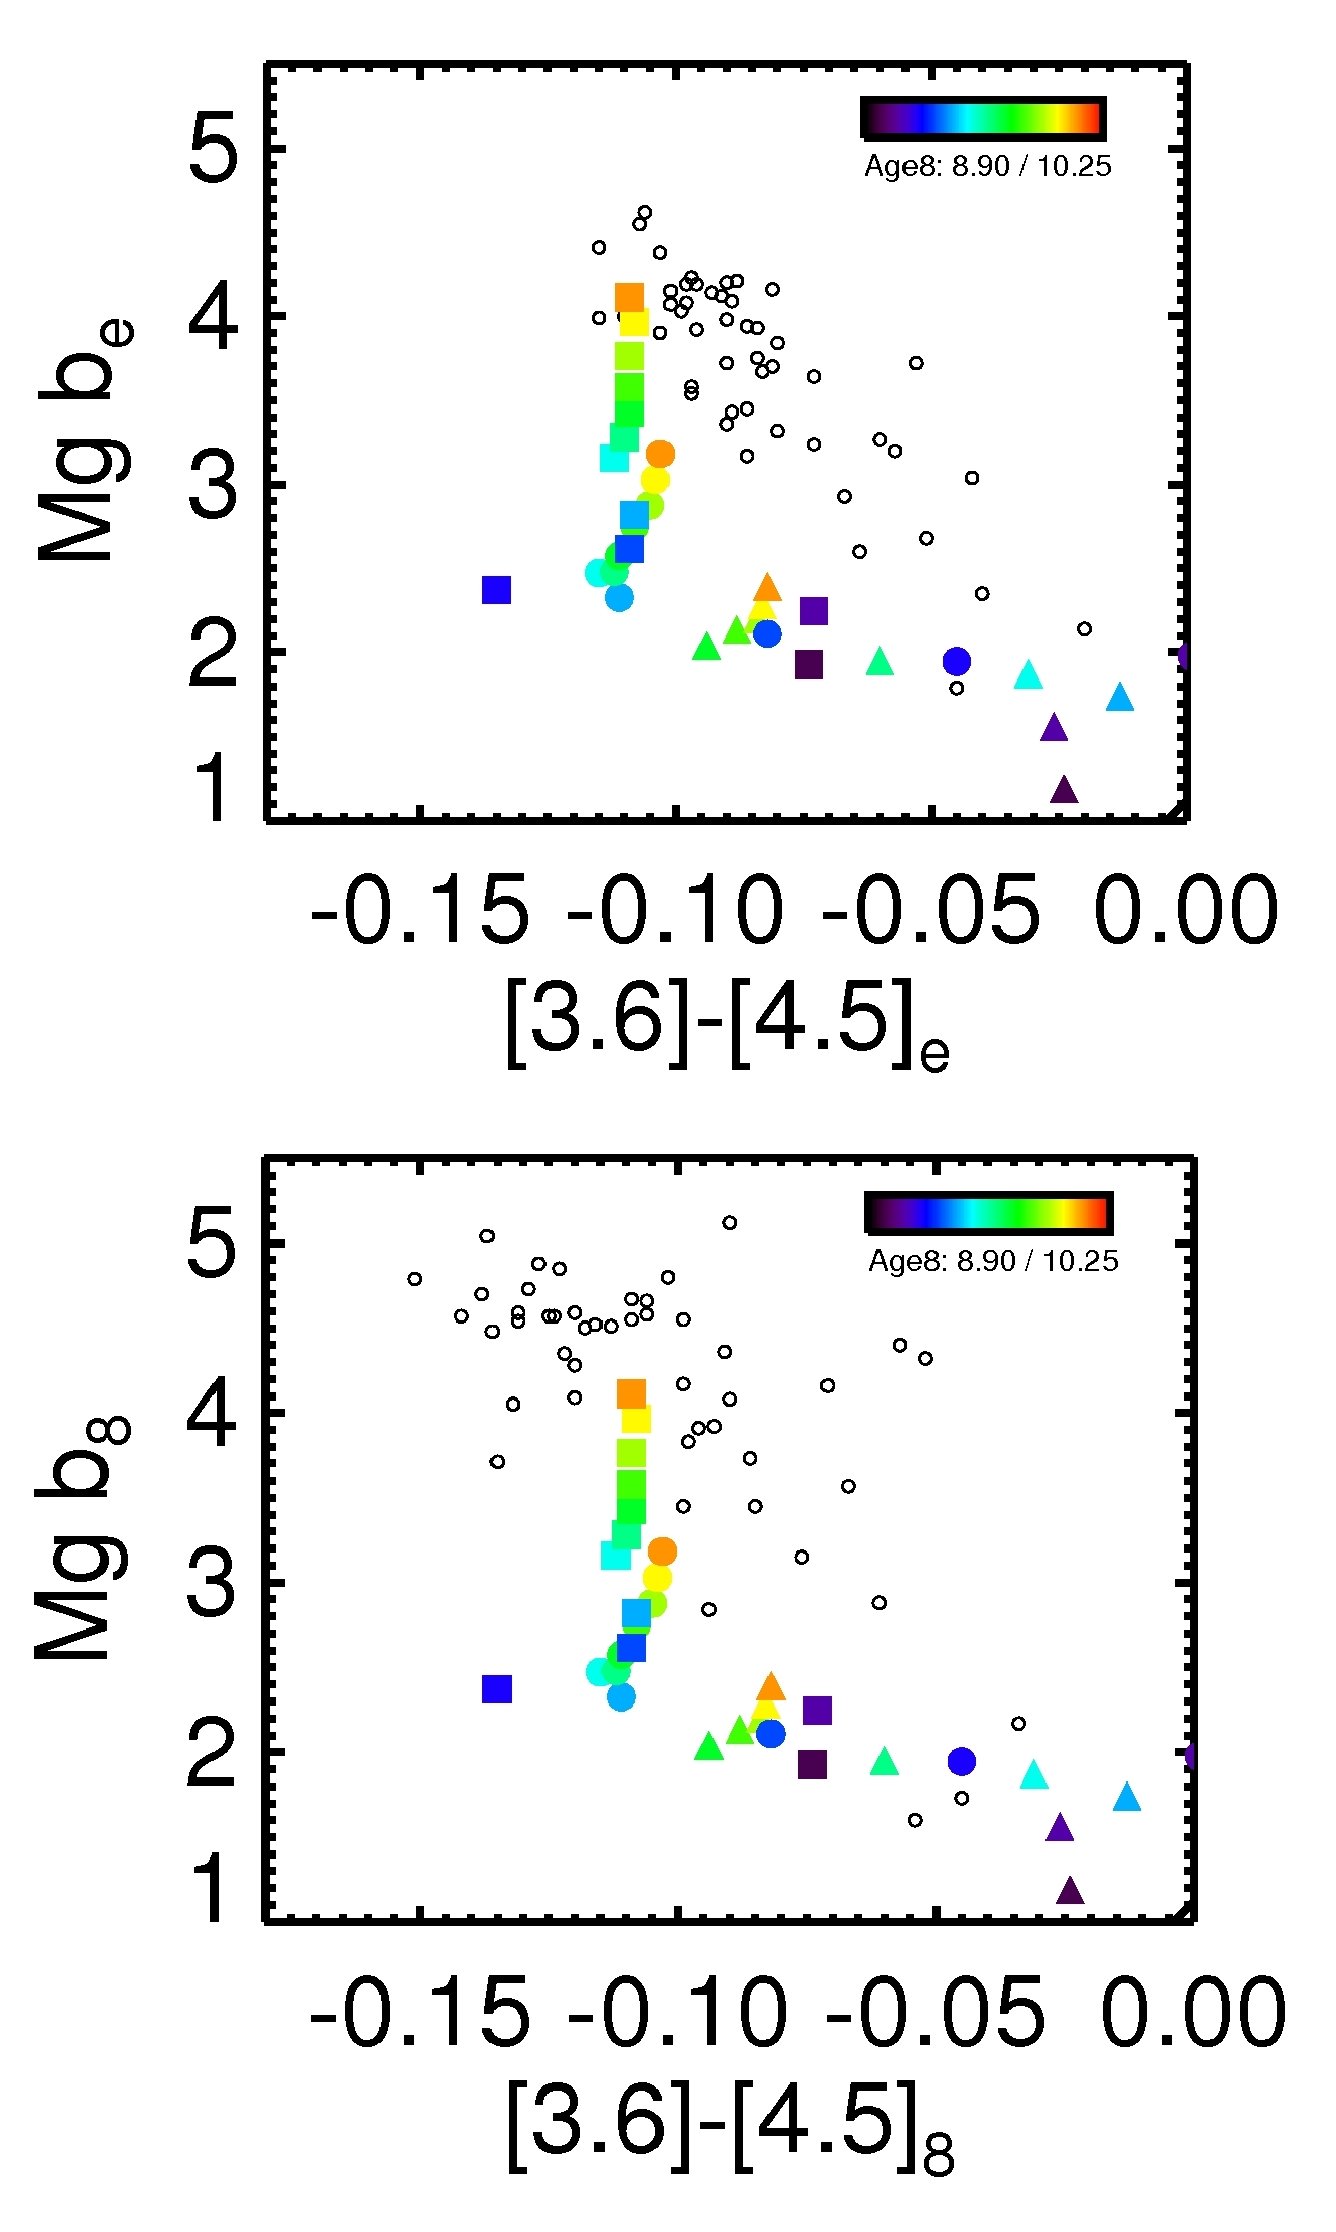
If the scatter in the colour- relation can be explained by young stellar populations on top of a much older underlying stellar population, we would expect the outliers of the optical line strength - relations of Paper VI to be the same as the outliers of the colour - relation here. In Paper VI a tight Mg b - relation is shown for the galaxies in the SAURON sample. The scatter is somewhat larger than e.g. in the Coma cluster (Smith et al. 2009) due to the fact that there are several galaxies in the SAURON sample with young central stellar populations. In Fig. 11 three of the relations of Paper VI are shown, together with the -[3.6] – relation (Fig. 7 of Paper XIX, but expanded). One sees that the galaxies show a tight Mg b – relation, with some galaxies falling below the average relation. For example, the Mg b values of NGC 4150 and NGC 3032 are lower than those of NGC 7457, a galaxy with a similar velocity dispersion. The reason is that a considerable young stellar population is present in both NGC 4150 and NGC 3032 (Paper VI, Paper XVII). The galaxies that lie below the Mg b – relation generally lie above the H – relation. For Fe 5015 the situation is much less clear. The scatter in the -[3.6] vs. relation is due to extinction (making the colour redder) and young stellar populations (making it bluer). The outliers in this diagram are not necessarily the outliers of the others.
In general, the [3.6] - [4.5] vs. diagram agrees with the other line strength – diagrams. Young stellar populations make the [3.6] - [4.5] color redder, H stronger, and Mg b and Fe 5015 weaker. There is no direct correlation between the residuals, since every relation has a different curvature. Some galaxies, such as NGC 4486, only deviate from the colour - relation. As mentioned before, this is probably due to the presence of non-thermal emission from AGNs. The agreement is quite remarkable. For example, galaxies that lie below the H – relation also lie below the [3.6] - [4.5] – diagram. All this causes the colour – line strength relations (Fig. 12) to be rather straight. It looks as if just metallicity and age are fully responsible for the positions of the galaxies in these colour/line strength – relations (with the exception of NGC 4486, and dust extinction in V - [3.6] vs. ). Although one would a priori expect AGB light to be of considerable influence to the [3.6] - [4.5] colour, and not to the optical line indices, its effects are not found in this study.
We proceeded to try to find out whether the scatter in the vs. relation could be due to other parameters. To do this, we performed a principle component analysis on many galaxy parameters. Although this analysis shows that many parameters correlate with , namely , Age and /Fe within re (from Paper XVII), the Spitzer [3.6] luminosity M3.6 and (both from paper XIX), dynamical mass and M/L (both from Paper XIV), there is not much power in the second, third and higher eigenvectors (46% in EV1, 15% in EV2, 11% in EV3, 7% in EV4 etc.). Furthermore, these eigenvectors are hard to relate to the physical parameters. From EV2 there is a hint that the residuals of the vs. relation might correlate with re (from paper XIX), boxy/diskiness (from Paper IX) and MHII, the amount of ionized gas present in the galaxy (from Paper V). This is understandable if this effect is caused by the presence of central young disks: galaxies with such disks show larger , have more ionized gas, and are generally smaller than other galaxies. +0.1543= No correlations are found with either morphological type, ellipticity, , a parameter measuring the angular momentum in a galaxy, (both from Paper IX), metallicity within re (from paper XVII), the FUV luminosity (Bureau et al., Paper XVIII), and the galaxy environment (cluster or field, following the definition of Paper II).
4.5 Colour - mass and colour - magnitude relations
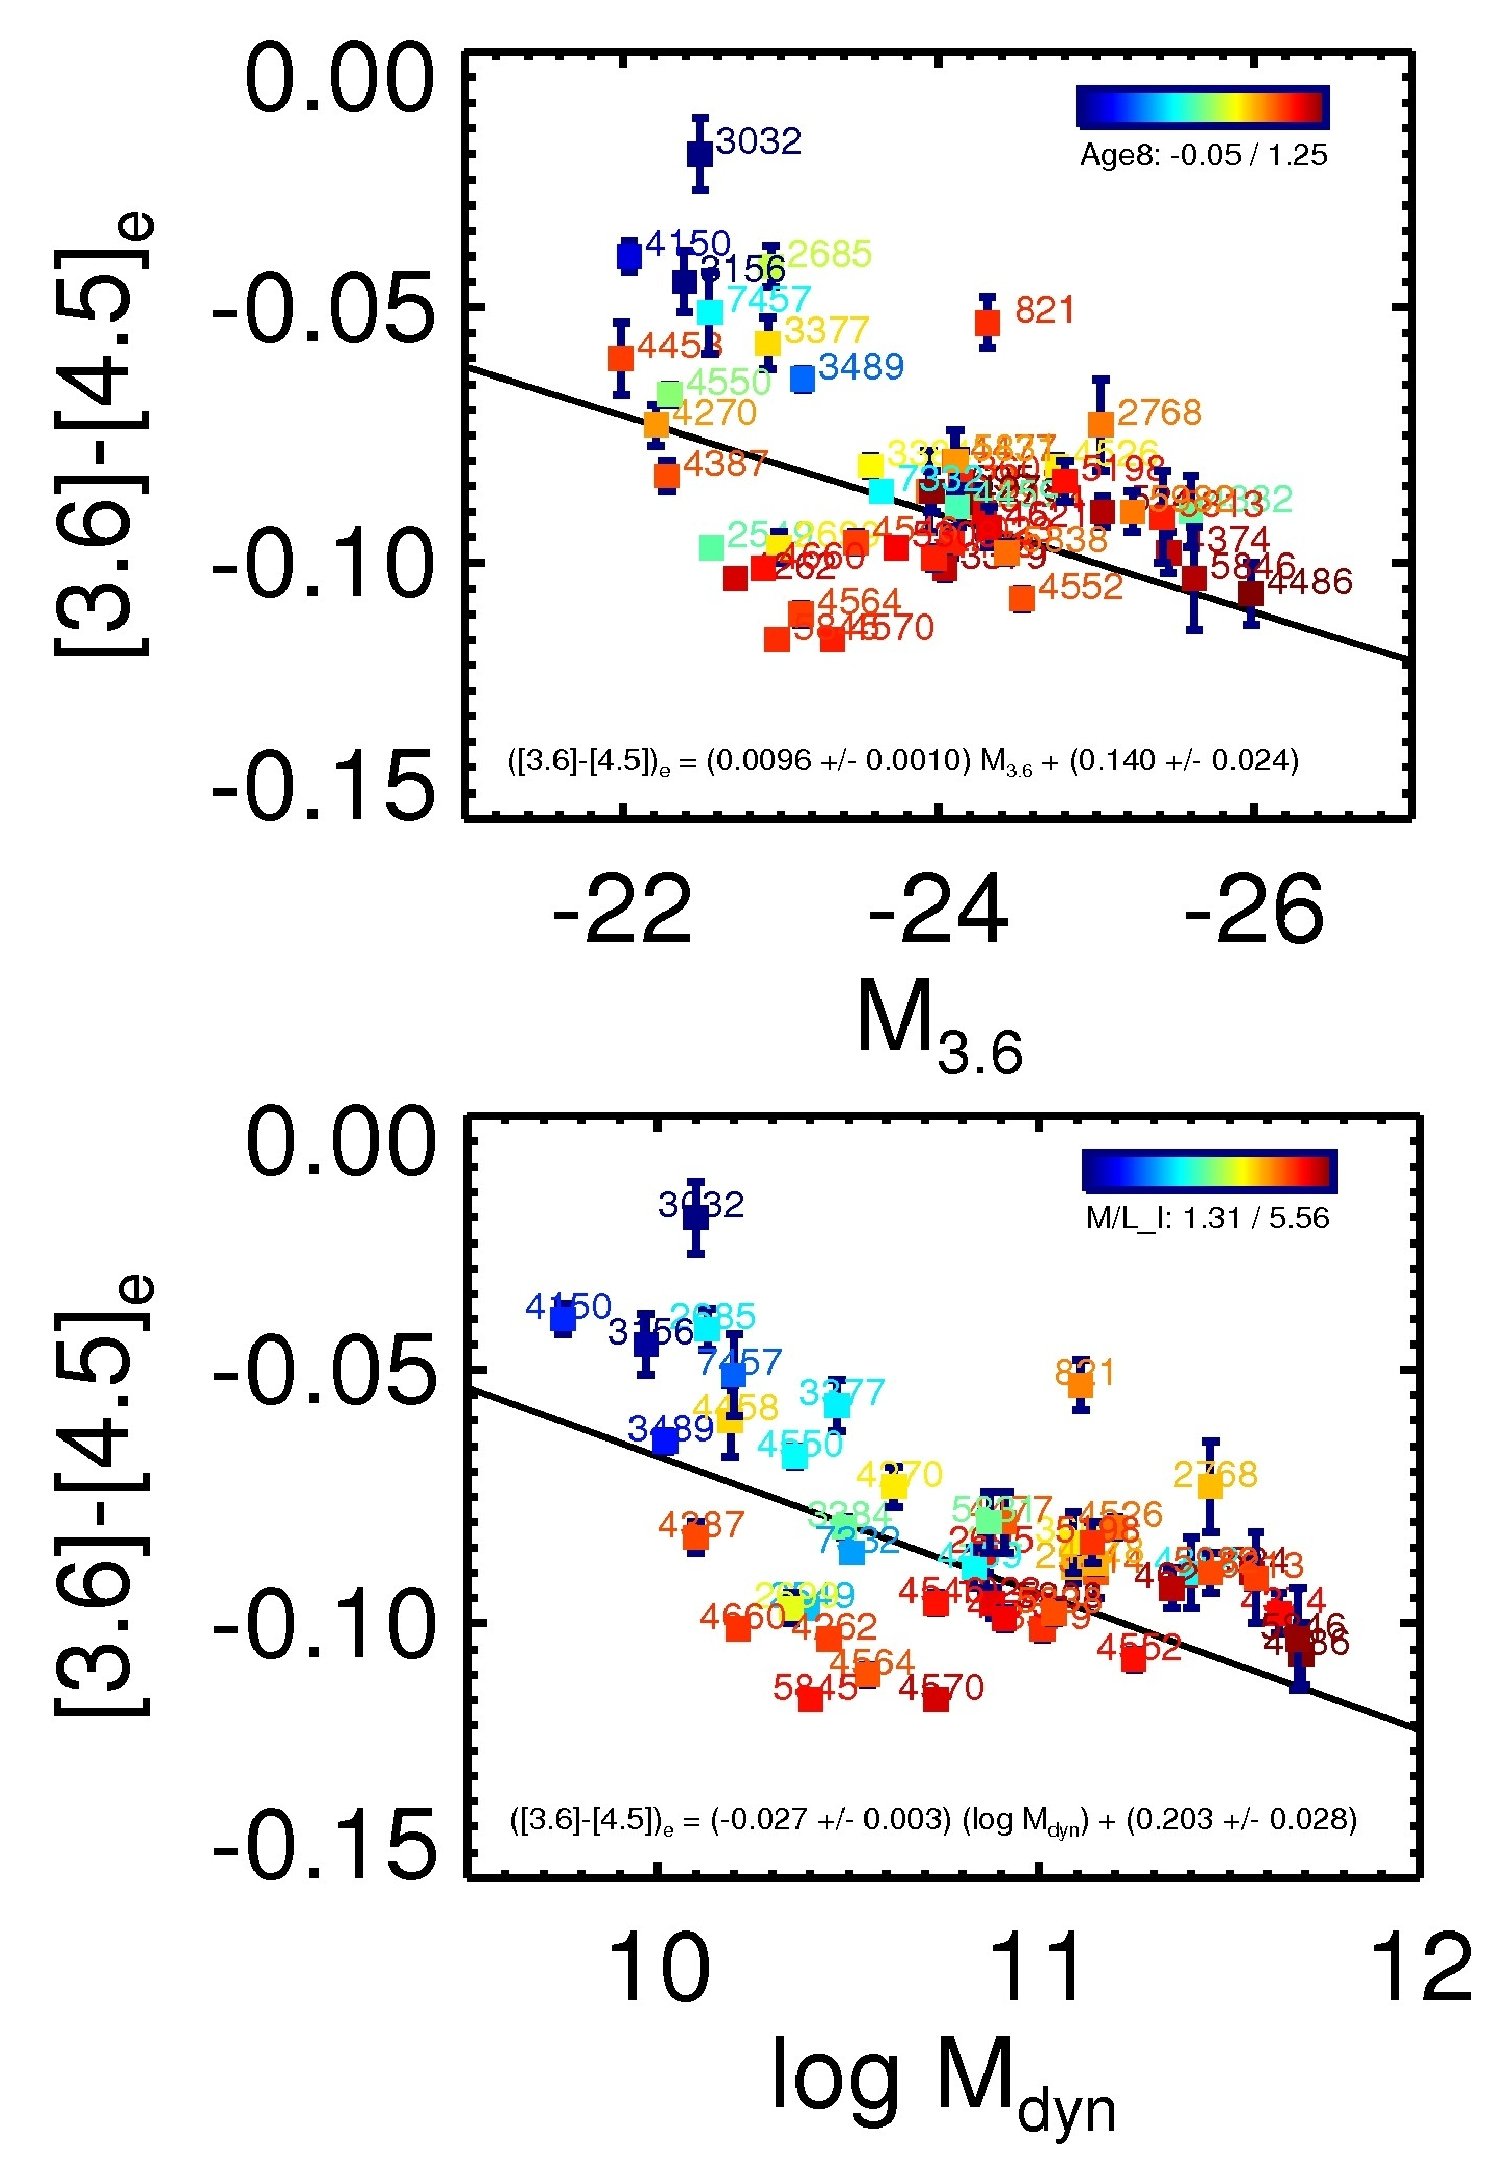
Since we have calculated the total mass of the galaxies (in Paper XIV) we also show the relations colour and mass and with 3.6 m luminosity in Fig. 13. Although these quantities are dependent on distance, the colour-mass relation might have a more physical meaning. The fact that these relations show considerably more curvature than the colour - relation, might give some clues about their origin. The curvature is the same as seen in the colour - metallicity relation Fig. 8). The difference is due to a curvature in the relation between log(mass) and log(), together with the fact that some galaxies, such as NGC 4564, NGC 4570 and NGC 5845, have a high for their mass or luminosity. These objects remain old, and have [3.6] - [4.5] colour, but are considerably displaced along the mass-axis. The reason for the curvature at the low mass end is the curvature in the mass vs. relation, or the Faber-Jackson relation (see e.g. Paper XIX). At the same compact galaxies such as NGC 5845 are much less massive than others.
4.6 Colour-colour and colour-line strength relations
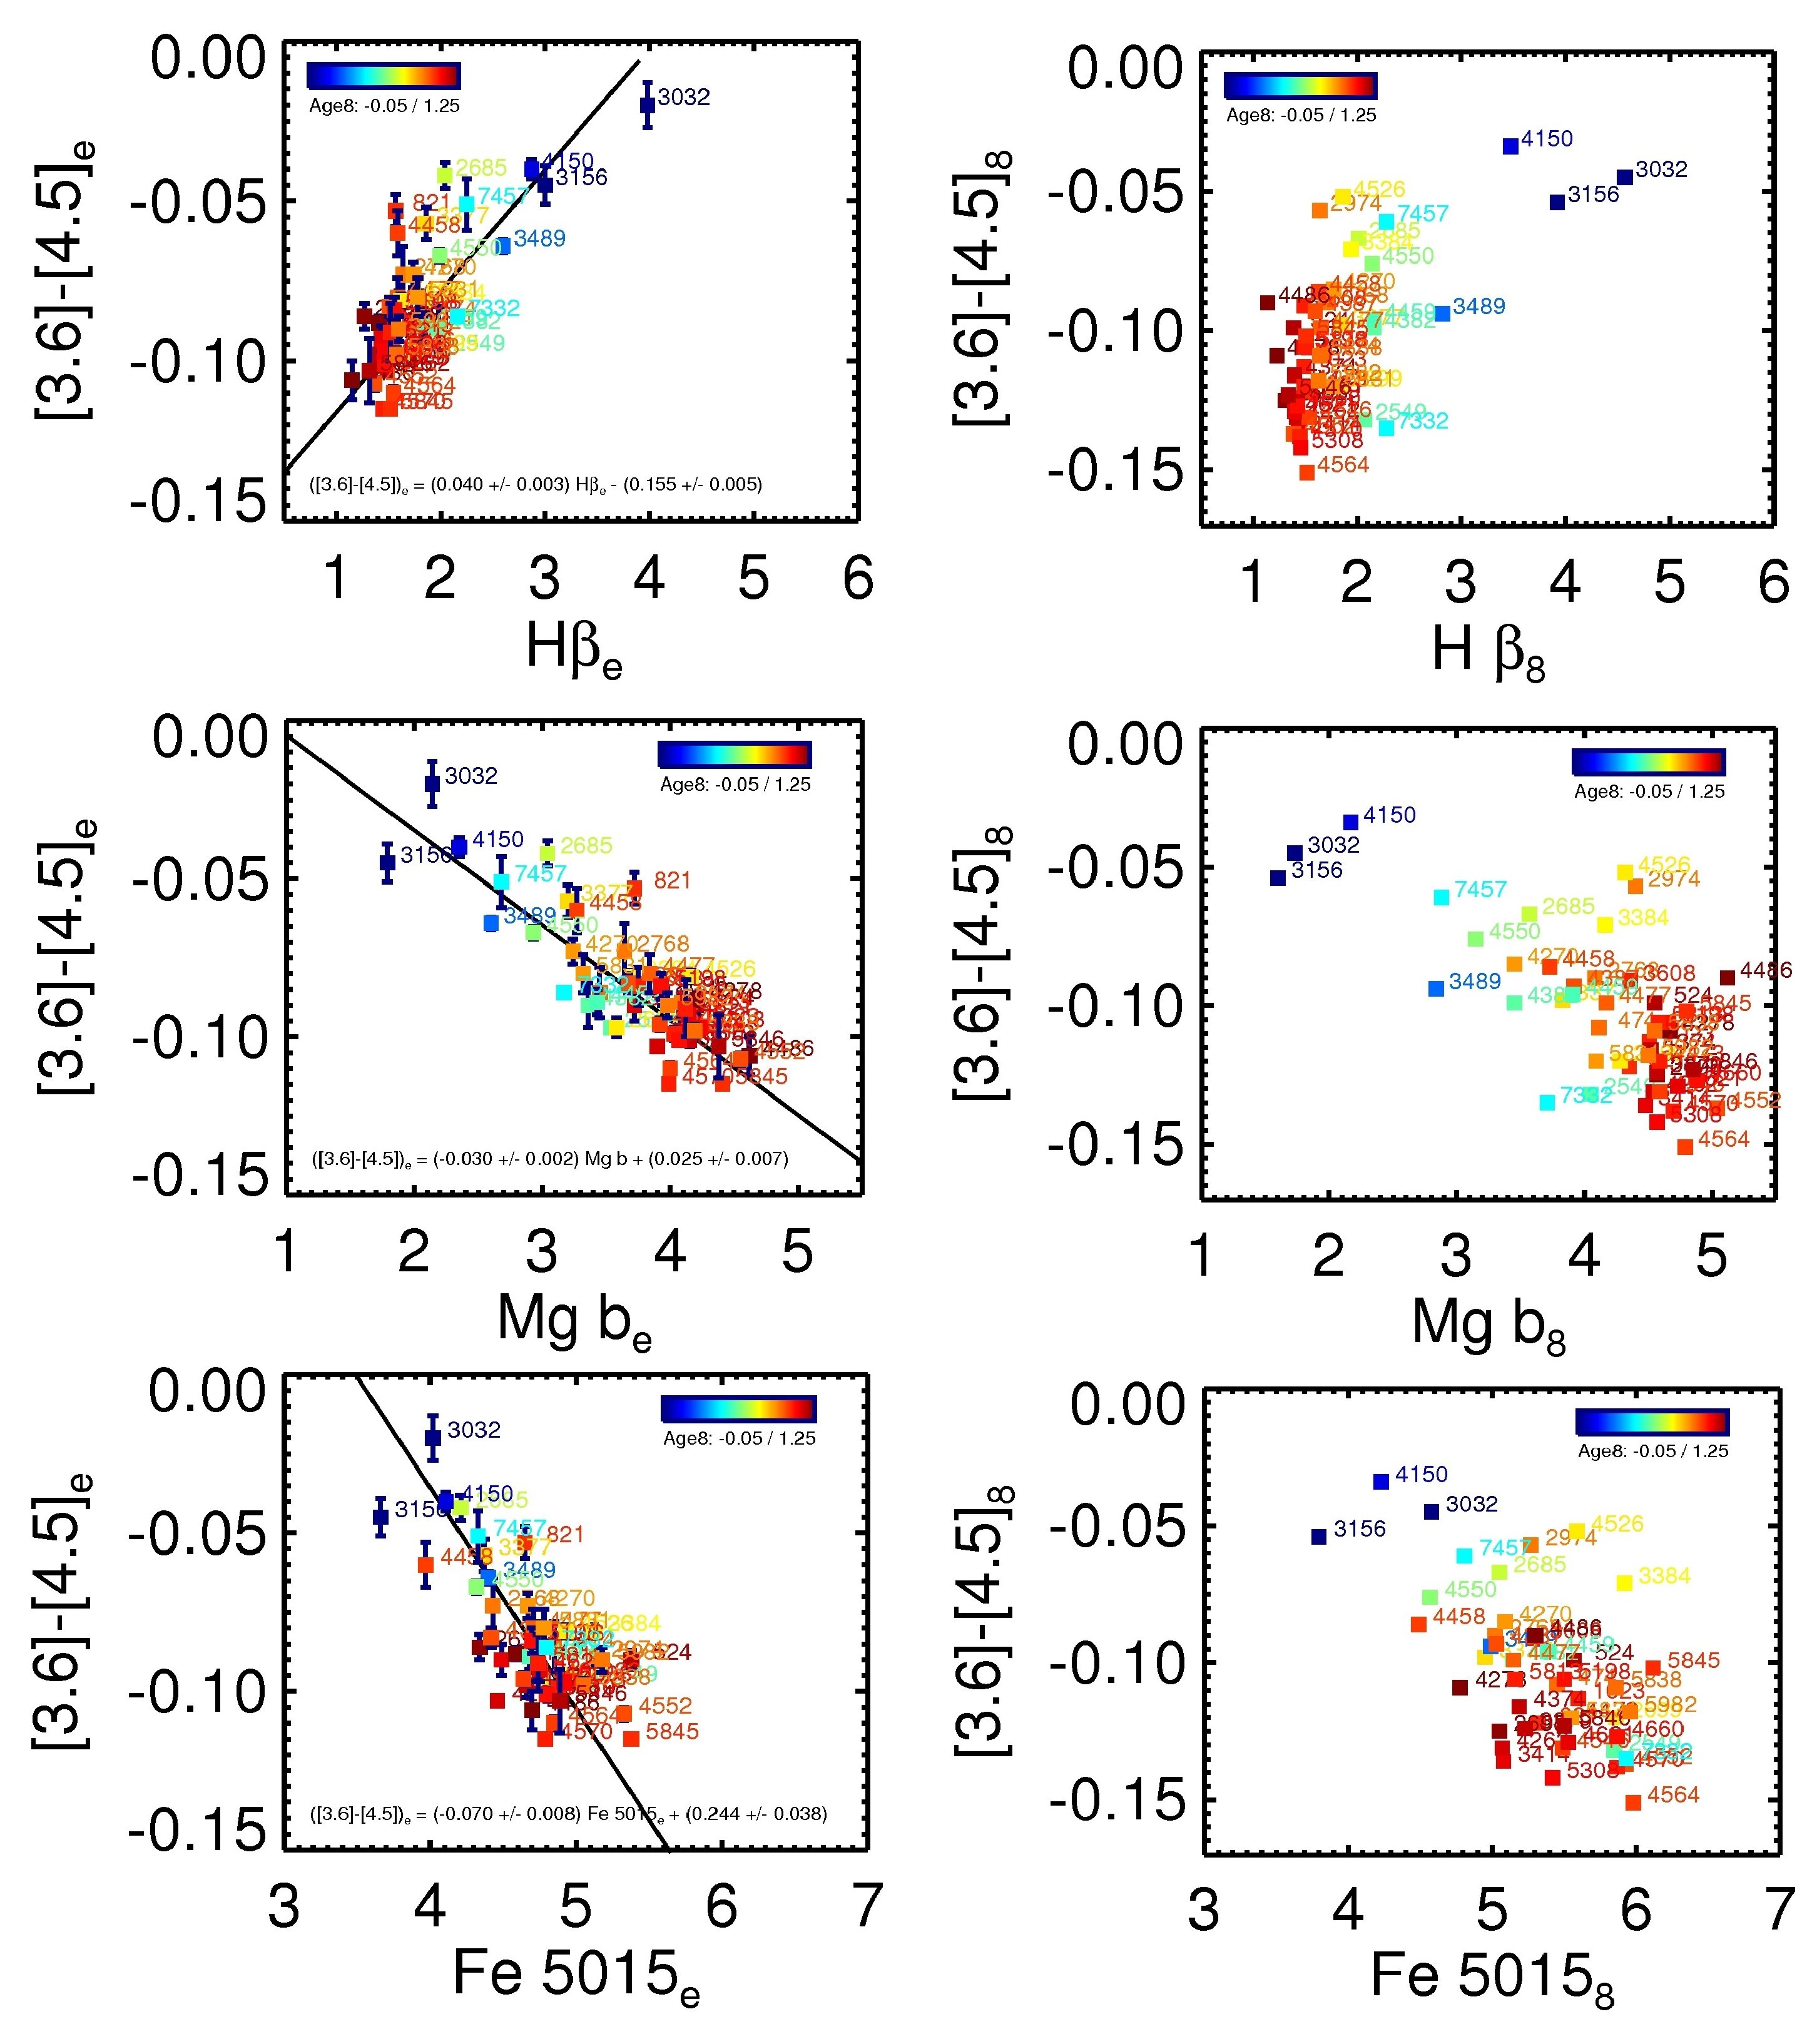
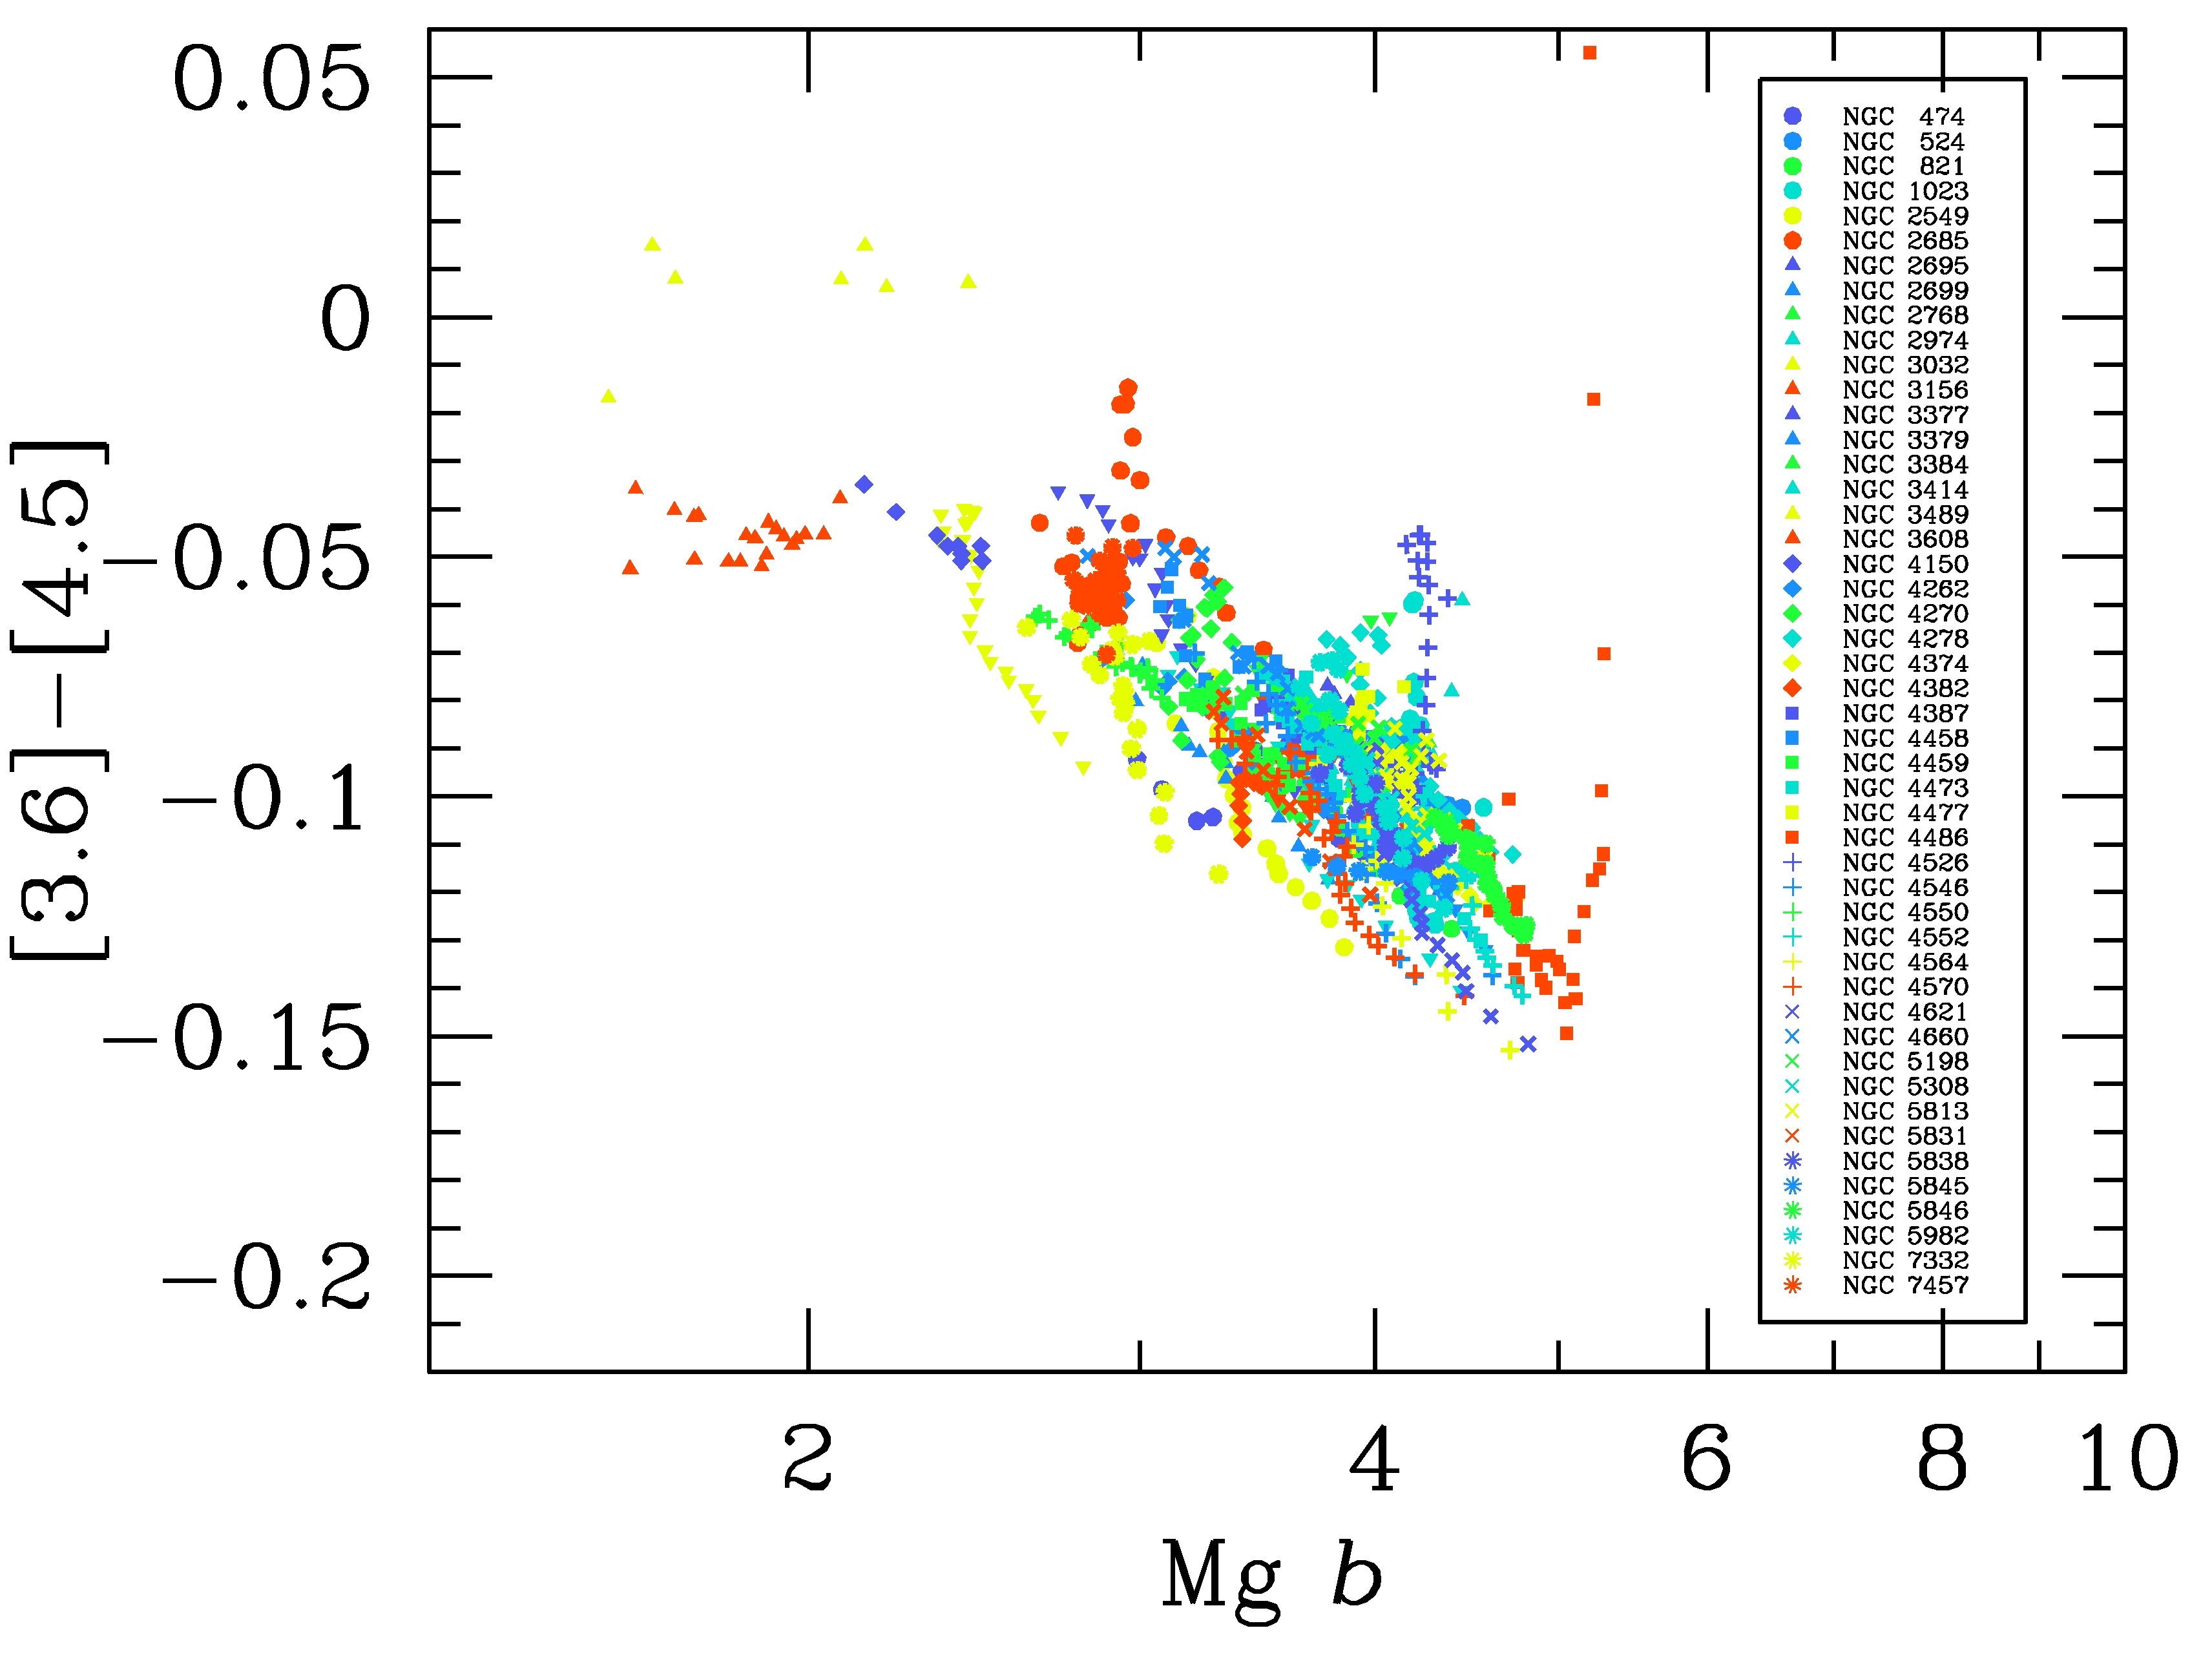
We now present the m colour as a function of the three line strength indices published in Paper VI (Fig. 12). Values inside are presented on the left. Strong correlations are found for all indices, especially inside . This is expected, since the indices themselves also correlate well with (Paper VI). Galaxies deviating from the trends are those with AGNs, and those with a considerable amount of younger stellar populations: adding young stellar populations to a galaxy with old stellar populations does not always make it move along the average colour - index relation.
Here we try to interpret the data in a very rough way using the models of Marigo et al. (2008). In Fig. 14 we have plotted these models on top of our data. Models are plotted for metallicities Z=0.008, 0.02 and 0.03 (triangles, circles and filled squares). The age of the models is indicated by the colours of the points. The first thing to note is that for old stellar populations the model colours become bluer and Mg b stronger with increasing metallicity. This is in agreement with the data. However, for constant metallicity, and models above about 2 Gyr, stellar populations have the same colour, while Mg b is decreasing when age decreases. This does not seem to be in agreement with the observations. In e.g. the central regions of NGC 4526, where we find clear evidence for younger stellar populations, the [3.6] - [4.5] colour becomes considerably redder.
We find that galaxies within both have a bluer colour and a stronger Mg b index than within . This can be explained easily by a gradient in metallicity. It remains, however, to be seen to what extent this diagram can be used to separate age and metallicity. To do this, a prerequisite is that much more accurate stellar population models are available for the [3.6] - [4.5] colour.
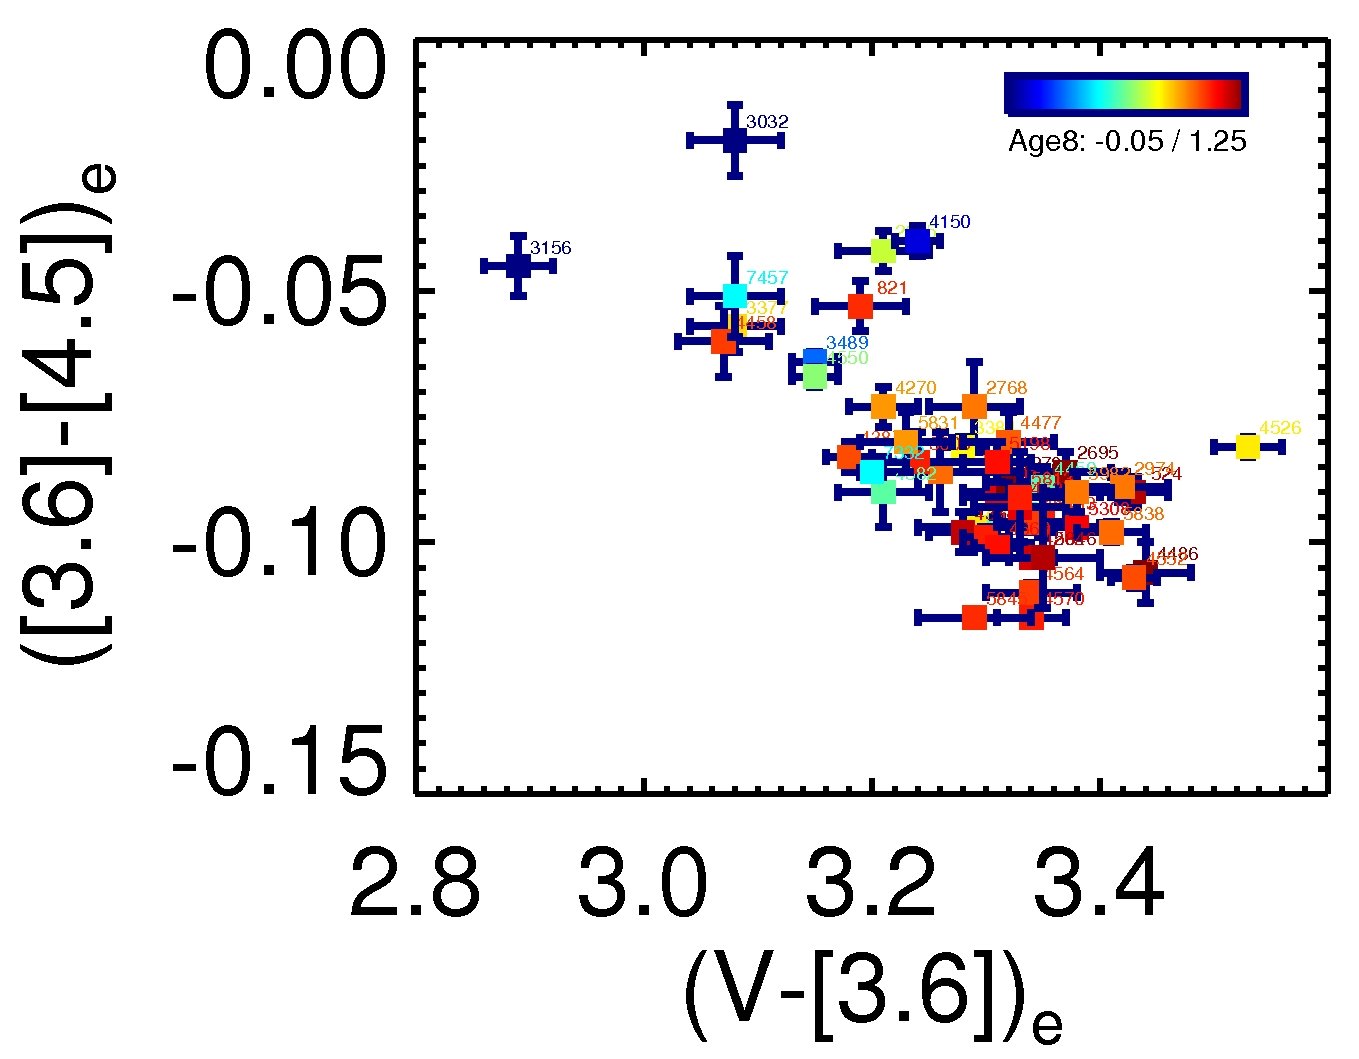
Plotting [3.6] - [4.5] against - [3.6] in Fig. 15 we see that there is a reasonably tight correlation between both colours. As mentioned in Subsection 4.4 the scatter is caused by dust extinction in the V-band, and multiple stellar populations.
5 Local colour relations
5.1 What are we measuring?
Early-type galaxies generally show small radial colour gradients in the optical and near-infrared (e.g. Peletier et al. 1990). These gradients reflect stellar population gradients, but can also be caused by dust extinction. In general, stellar population gradients can be caused by gradients in metallicity, and by radial age differences. In giant ellipticals, it is generally thought that galaxies have a weak metallicity gradient ( -0.4), with average metallicity decreasing slowly going outward. On top of that, often indications of younger stellar populations are found in the inner regions (see e.g. Fig. 9 and Paper XVII). These younger stellar populations are then generally accompanied by dust extinction, spiral arms, and/or star forming regions, although in the MIR dust extinction does not play a role (Martin & Whittet 1990). The presence and amount of young stellar populations depends on the environment. Sánchez-Blázquez et al. (2006) find age gradients for their sample of galaxies in low density environments, but their results for galaxies in a high density environment (Coma) point at age gradients consistent with zero. However, Rawle et al. (2010) warn that, even though they find on average a zero age gradient, 40% of their sample is inconsistent with the absence of an age gradient. This agrees well with the SAURON sample, in which several galaxies have central regions that are much younger than the outer parts (Paper XVII). With these results in mind, we define for each galaxy a region in which we find evidence for younger stellar populations. Outside this region, we fit a linear relation between [3.6] - [4.5] colour and logarithmic radius (see Section 3.3). The slope of this relation is the colour gradient, which is (by design) likely to be caused by a change in metallicity. Note that all colour gradients are positive.
We now look at the relation between the colour gradients and gradients in the three indices that can be measured by SAURON: Mg b, H and Fe 5015 (Paper VI). Here we use a simple, robust definition for gradients, both for colours and indices: we compare differences between the colours/indices in the smaller aperture of and the one of We find that the colour difference correlates reasonably well with the Mg b difference, that the scatter increases for Fe 5015, and that there is no correlation with H. All this is consistent with the integrated colour - index relations (Section 4.7).
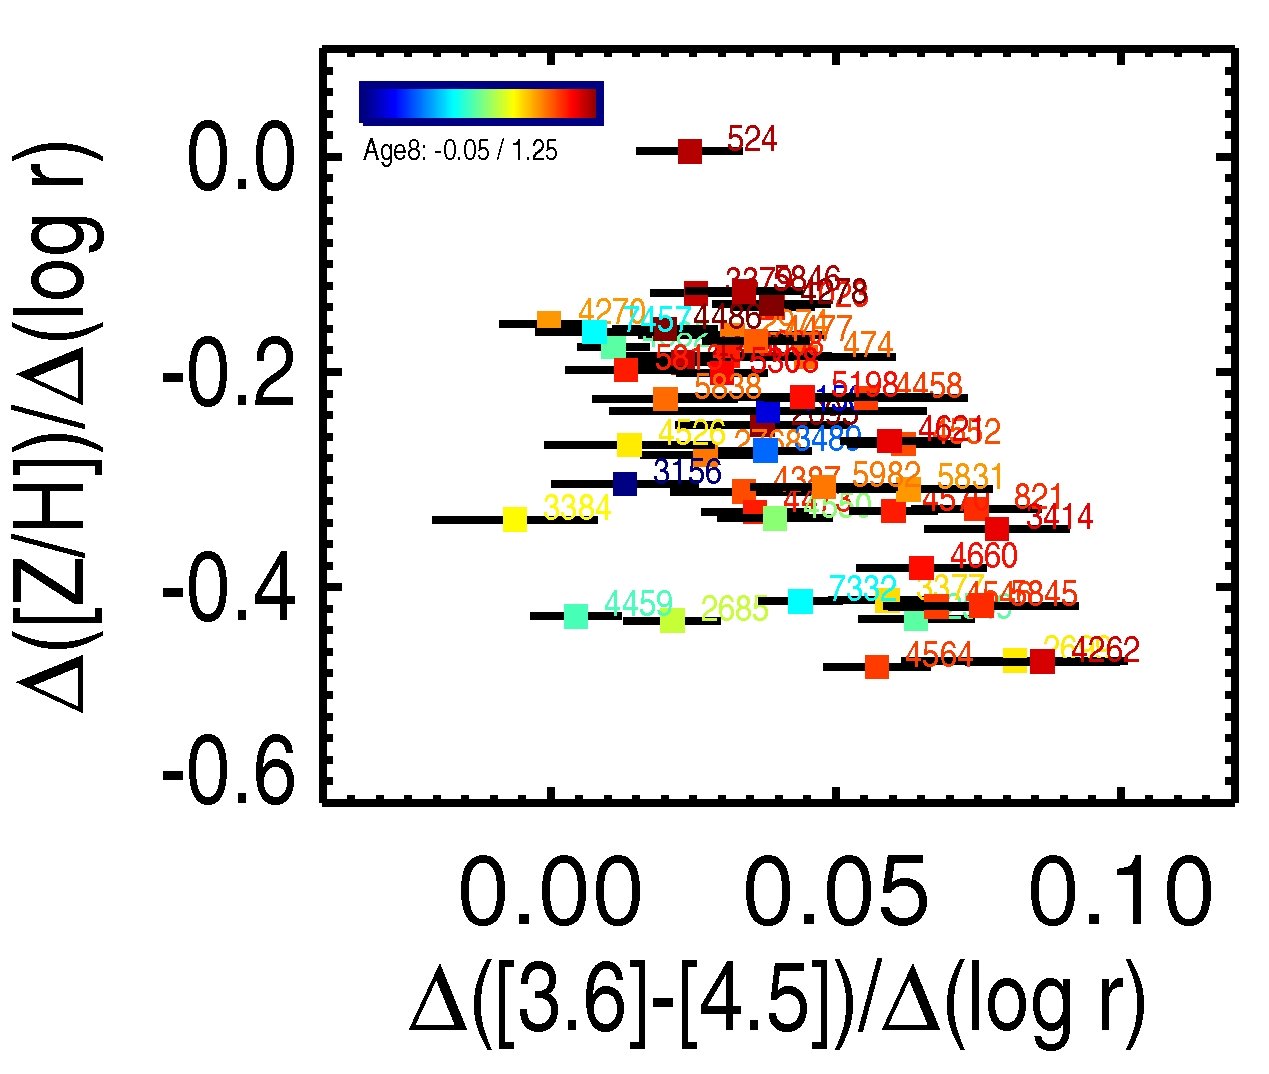
Since the colour gradients have been constructed to measure metallicity gradients, we now compare them with linear fits to the radial metallicity profiles [Z/H] from Paper XVII. These SSP-metallicities have been obtained by fitting SSP-models to the azimuthally averaged line indices of the SAURON galaxies. In Figure 16 we find a good correlation. The points, coloured by the age inside re/8, show that galaxies with large colour gradients also have large metallicity gradients. On the other hand, there are some objects with large metallicity gradients for which the colour gradient is much smaller than expected from the other galaxies. The colouring of the points shows that this mostly happens for galaxies with younger central ages, so this might indicate that the colour gradients in the galaxies with younger centers are still affected by those younger stellar populations, even though care has been taken to reject the regions affected. Circumstantial evidence for this comes from the 8 m maps (Shapiro et al. 2010, Paper XV), where stellar-corrected 8 micron emission is detected up to large radii in all outliers in Fig. 16 . The presence of this 8 m flux comes from warm dust, which could well be accompanied by nearby star formation. In this case the metallicity gradients is probably diluted by the presence of intermediate-age stellar populations ( - year), which dominate the mid-infrared region around 4 micron. Very detailed statements about this cannot be made yet, since the range in [3.6] - [4.5] colour covered by the galaxies is very limited, so e.g. a morphological decomposition of galaxies into an old and an intermediate age component is not possible with the current data.
5.2 Dependence of colour gradients on galaxy mass
In a recent paper (den Brok et al. 2011) we discuss stellar population gradients in early-type galaxies covering a large range in mass in the Coma cluster. We find that colour gradients in general correlate with galaxy luminosity or mass, in the sense that high-mass galaxies have stronger gradients than dwarfs. A new result in that paper is that optical colour gradients in the main body of the galaxies do not become positive for very faint galaxies, as has been claimed in the literature (e.g. Vader et al. 1988). The reason why generally positive gradients are measured when using the whole available range in radius, is due to the central component, which is very important for the faintest galaxies. This central component, which in dwarfs is called a nuclear cluster, is often bluer than the main galaxy, making the colour gradients change sign. In den Brok et al. a detailed comparison is also given with the literature on stellar population gradients. In the current paper we only discuss bright galaxies, a subset of the range in mass covered in den Brok et al. Our sample, however, has been studied in much more detail, and for that reason knowing their metallicity gradients might more easily lead to a better understanding of the formation processes of early-type galaxies.
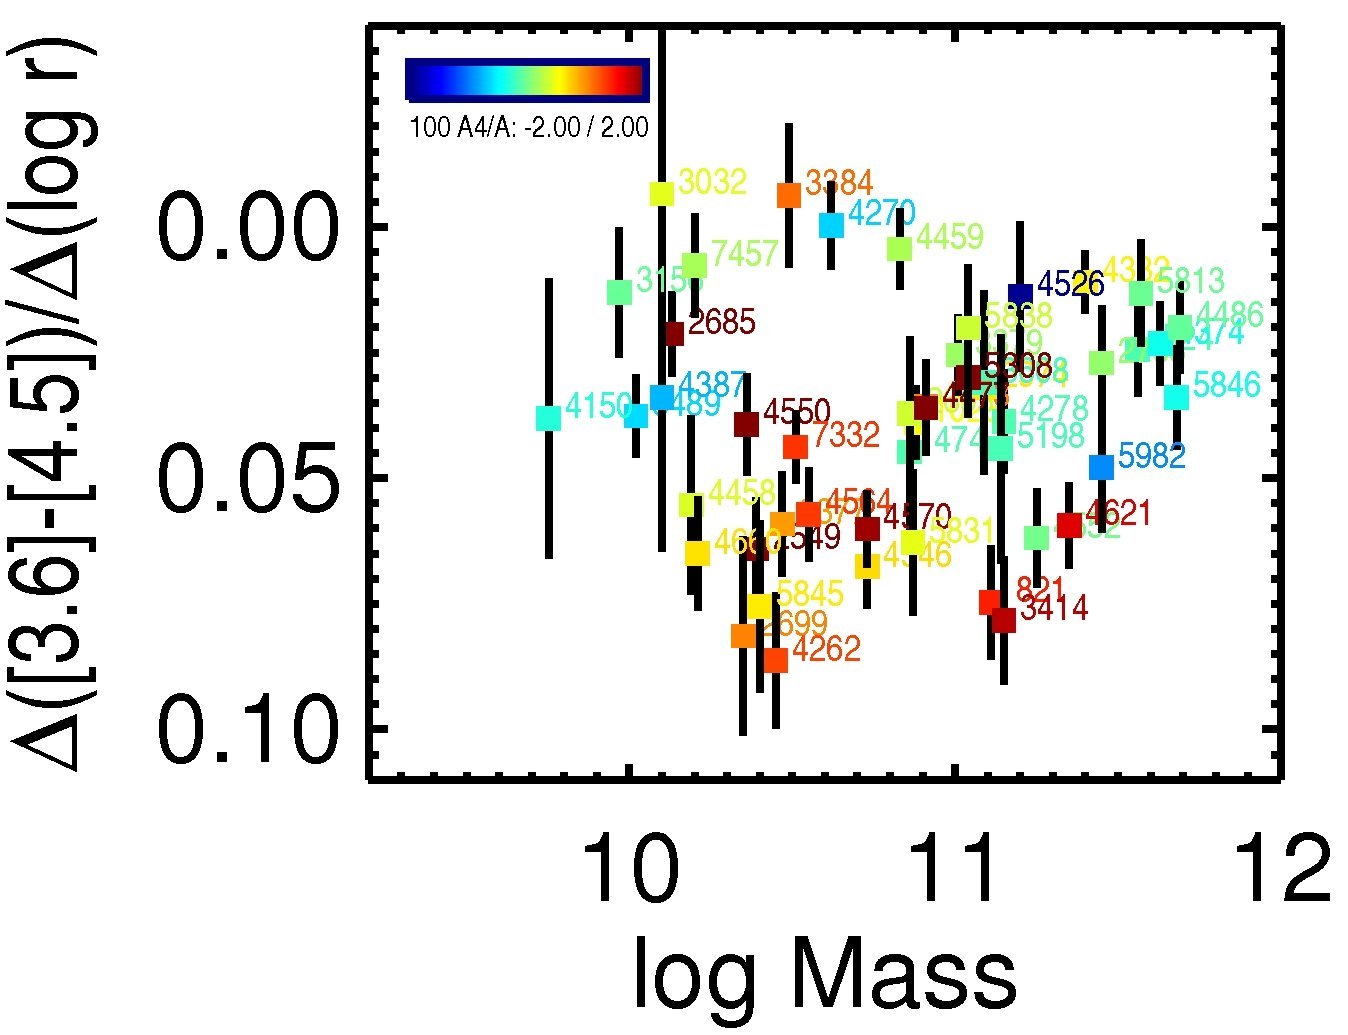
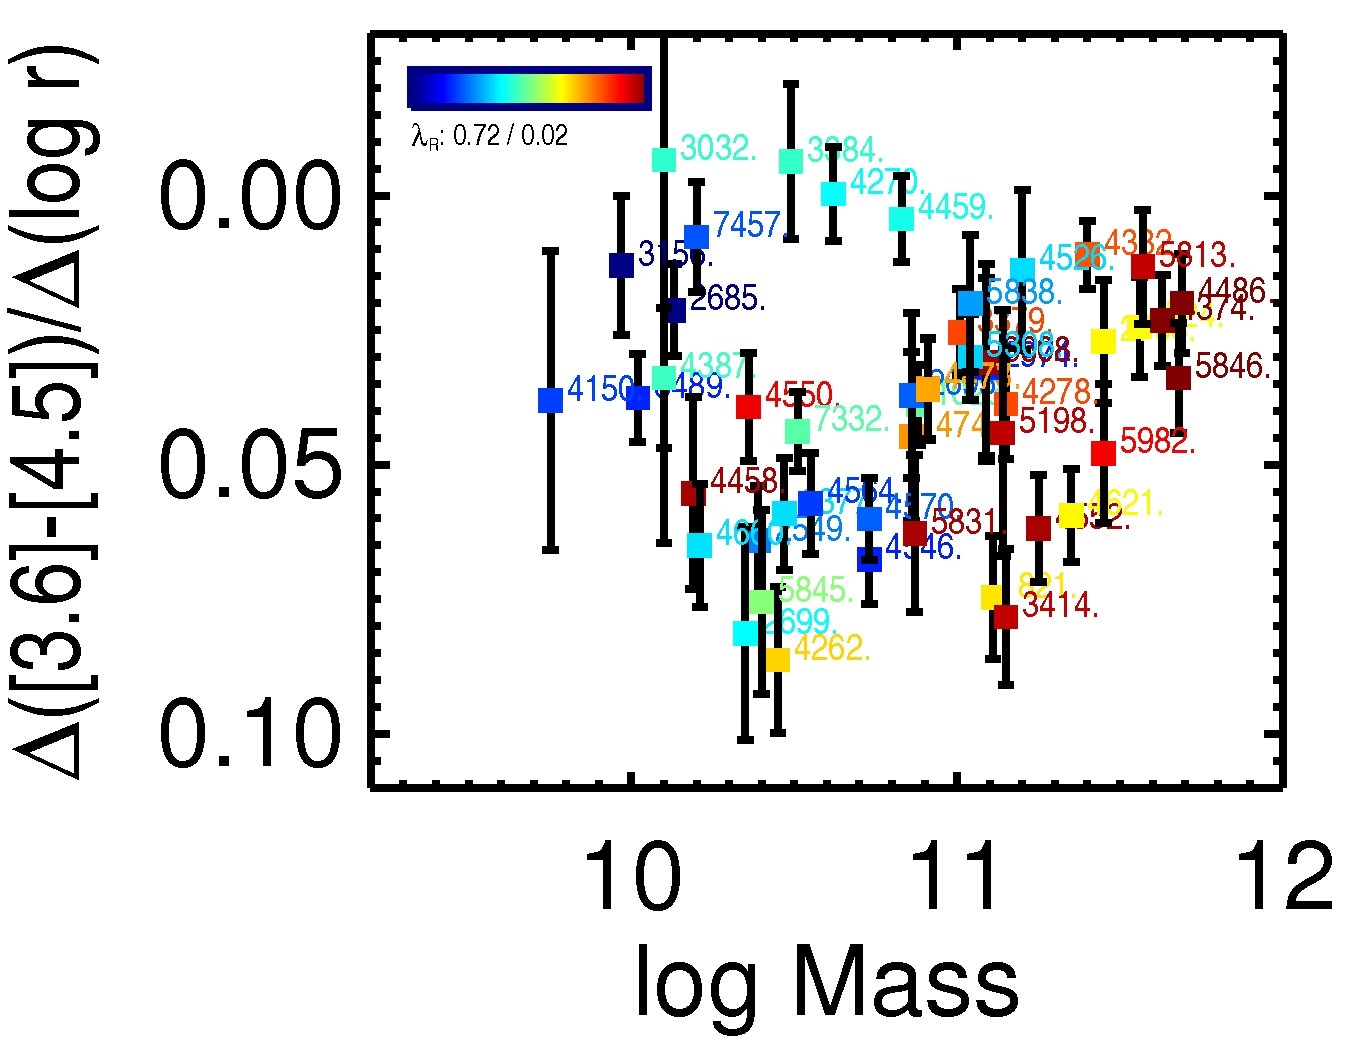
In Fig. 17(a) b) we plot the [3.6] - [4.5] colour gradient as a function of central mass. We find that all gradients are positive within the errors (indicating that metallicity decreases going outwards), and that there is a small tendency for gradients to be smaller for less massive galaxies, although the scatter at any is large. The scatter is clearly real, not due to measurement errors. The good correlation with the metallicity gradients of Paper XVII shows that the range in colour gradients is consistent with other papers in the literature. Up to now we don’t understand very well what determines the metallicity gradient in a galaxy. For an in-depth discussion see den Brok et al. (2011). It is a fact that metallicity gradients do not correlate with many parameters, although several correlations are predicted. Classical monolithic collapse scenarios (e.g. Carlberg 1984) predict large gradients, correlating with galaxy mass. Such gradients can be diluted by mergers, although residual star formation will again increase them in size (Hopkins et al. 2009). Simulations are not very succesful in reproducing the observations, especially since the observational results are not very clear. Another prediction is that metallicity gradients ought to correlate with the orbital structure in the galaxy. A cold disk has less mixing than a pressure supported elliptical galaxy. For our sample, we have tried to test this by colouring the points using the photometric boxy/diskiness parameter a4/a (e.g. Carter 1978), and the parameter (Paper IX) measuring the rotational support of a galaxy. Note that both parameters depend on the inclination of the galaxies, which is not easy to determine. In Fig. 17(a) we find that boxy galaxies possibly have smaller gradients than disky ones. If a galaxy is boxy, orbit smearing will dilute the observed metallicity gradient. Using this line of argument, however, metallicity gradients should also depend on . A galaxy with a large has a higher angular momentum, and should have a larger gradient than a slow rotator. This, however, is not observed (Fig. 17(b)). It might be that the sample of slow rotators is too small. One should also realise that galaxies could have different gradients in the radial and in the vertical directions, implying that any range in inclination will smear out the gradients as well.
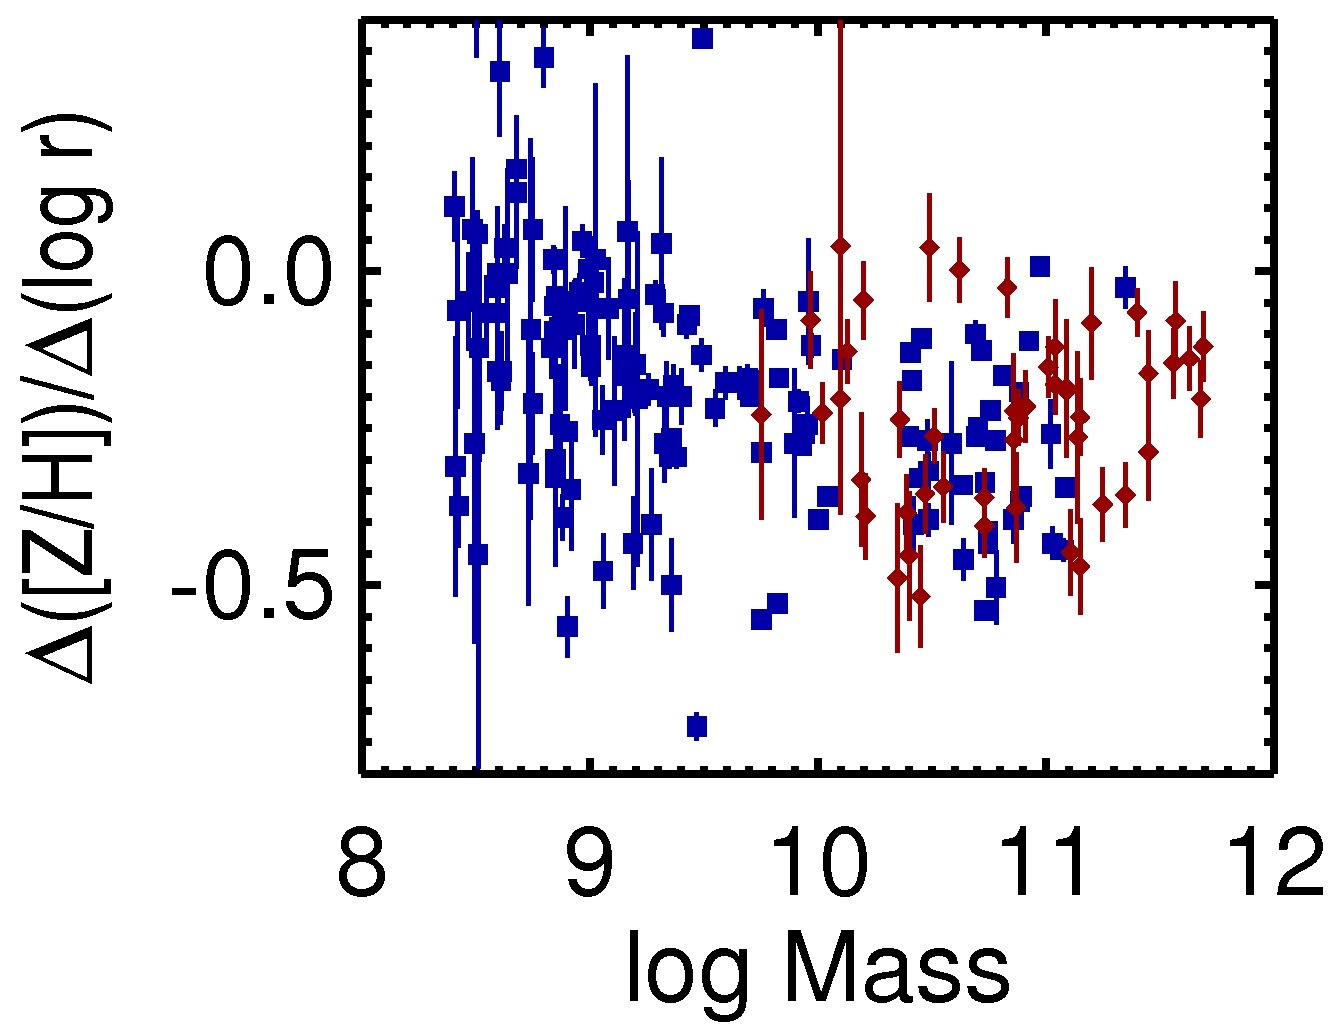
In Fig. 17(c) we expand the mass-range for the metallicity gradient vs. mass relation by adding the Coma sample of den Brok et al. (2011). The gradients there have been calculated in the same way, i.e. by excluding central components, if those were visible in the colour profiles. We have converted the data of den Brok et al. to metallicity gradients using , from that paper. We convert our gradients to metallicity multiplying them by a factor 5 (from Fig. 16). The figure shows that in the range of the bright galaxies (our sample) the range in gradients in Coma galaxies is similar to the range in the SAURON sample. Going then to fainter galaxies, the gradients slowly become smaller. Note several dwarf galaxies with Mass with very large negative gradients. These are compact ellipticals (den Brok et al. 2011). The qualitative behaviour of the galaxies in this diagram agrees with other studies, e.g. Sánchez-Blázquez et al. (2006).
We have investigated whether these color gradients can be compared with predictions from cold accretion models (e.g. Kereš et al. 2005, Brooks et al. 2009, Oser et al. 2010). Although these models are becoming more and more accurate, they are not able to make predictions for metallicity gradients in galaxies. They do however predict that smaller galaxies contain a larger fraction of younger stars in their inner regions. This is indeed qualitatively what is observed, both in the global ages inside and in the very inner parts, where many of the smallest galaxies show young stars and ongoing star formation. We cannot use our observed relation between gradient and mass (Fig. 17), since here we have tried to give the gradients in the oldest stars, which are probably a measure of the metallicity gradients in our sample.
5.3 Local colour and line strength vs. escape velocity
In Scott et al. (2009, Paper XIV) we investigated the relation between the three available line strengths and the local escape velocity for the SAURON sample, prompted by the good correlation found by Franx & Illingworth (1990) between local colour and escape velocity. This dependence on a local parameter, which is valid at all galaxy environments, and at different places inside a galaxy, might suggest that the gravitational potential, for which Vesc is a proxy, is the key parameter in determining the stellar populations in an early-type galaxy. Paper XIV found a tight relation between Vesc and the line strengths, especially Mg b. For that index the relation from galaxy to galaxy is the same as the relation within galaxies. For the other indices this is not the case. Although Mg b was found to be a very good proxy for Vesc, there are several galaxies that do not fall on the Mg b – Vesc relation, as a result of the sensitivity of Mg b to young stellar populations, which contribute relatively little to the mass. The fact that for most galaxies the Fe 5015 – Vesc relation from galaxy to galaxy is different than the relation within galaxies shows that, apart from the escape velocity, the detailed metal enrichment history of a galaxy also plays a role in determining the final stellar populations. It is therefore not surprising that the Mg b – Vesc relation has a measurable scatter.
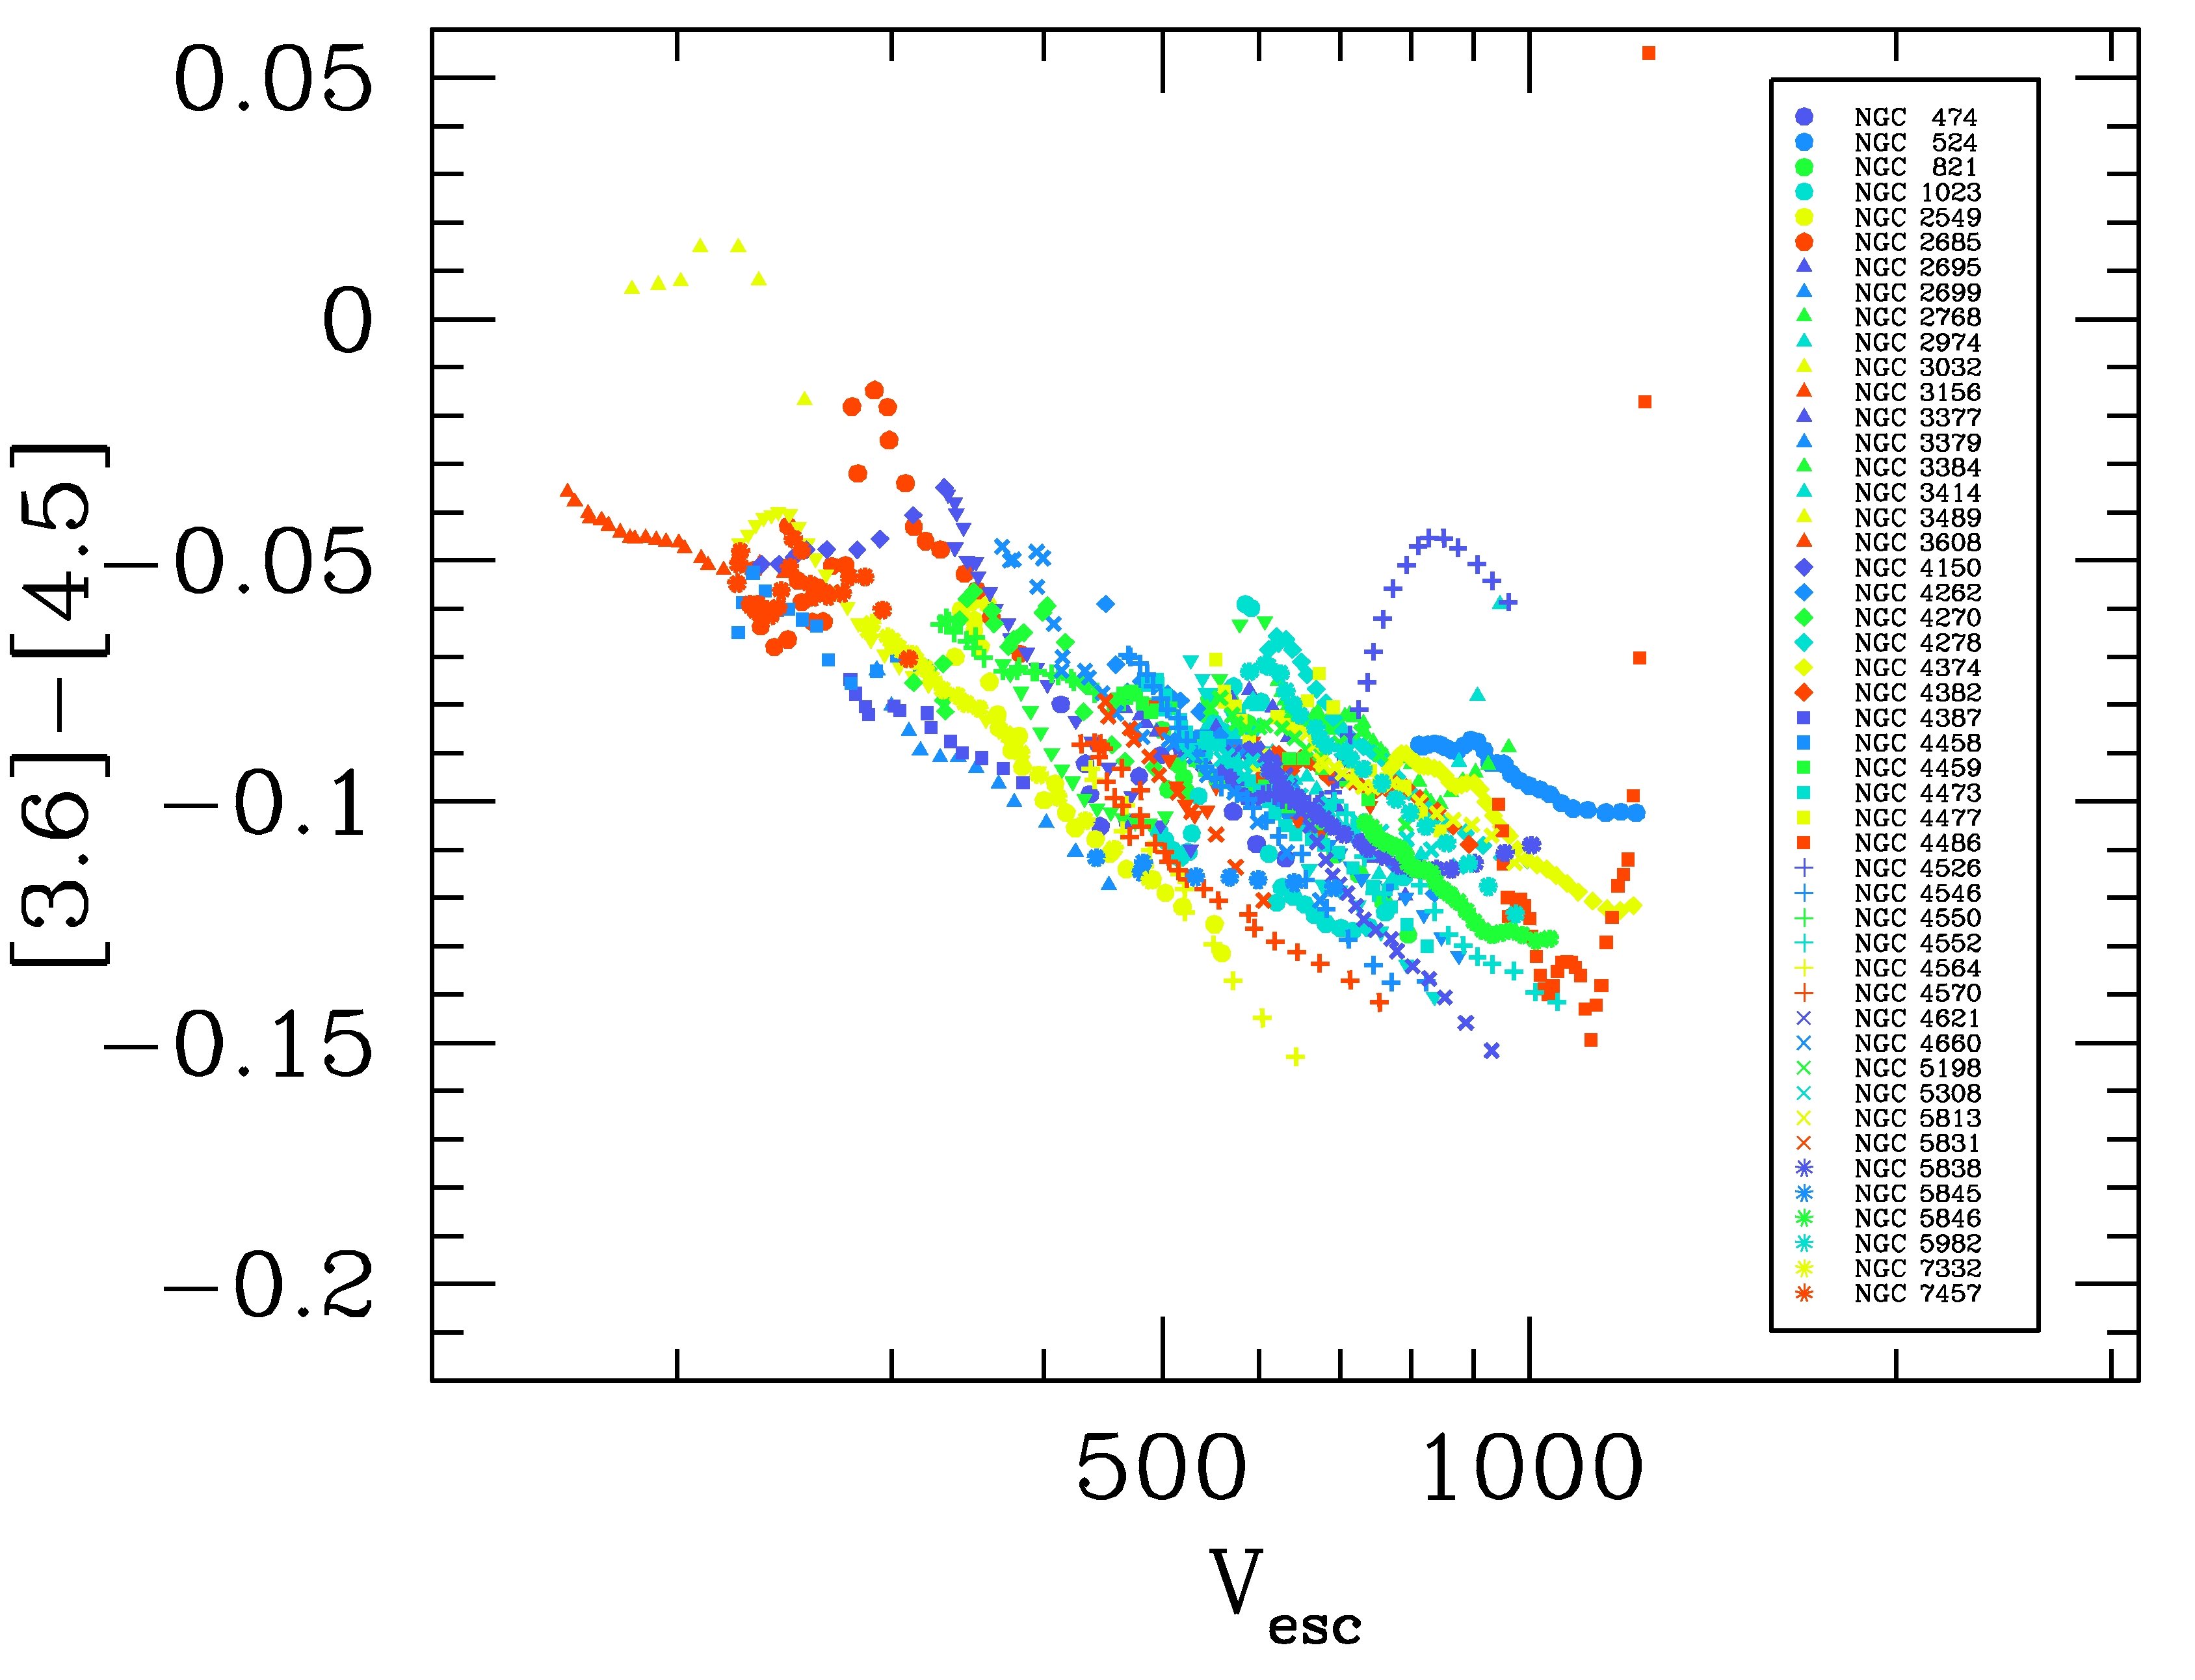
Here we investigate whether the [3.6] - [4.5] colour, which is less dependent on young stellar populations, and correlates well with Mg b, might show an even tighter relation with escape velocity. In Fig. 18 we show the [3.6] - [4.5] colours presented in Fig. 4 as a function of escape velocity, measured at each radius (from Paper XIV).
There are a few qualitative differences visible between the [3.6] - [4.5] – Vesc and the Mg b – Vesc relation. First, the young galaxies now all are much closer to the mean [3.6] - [4.5] – Vesc relation. From the 4 galaxies singled out in Paper XIV (NGC 3032, 3156, 4150 and 4382) only NGC 3032 still lies above the relation. This galaxy has a considerable young stellar population (Paper VI, Paper XVII). Second, some central points of the galaxies with AGN fall above the [3.6] - [4.5] – Vesc relation. This can be seen clearly for NGC 4486, and to a lesser extent for NGC 2768 and NGC 2974. Another galaxy for which many points fall above the relation is NGC 4526. This galaxy (see Fig. 9), which has a central dustlane, with young stars visible from the H absorption line, interestingly enough does not fall above the mean Mg b – Vesc relation. It does, however, fall above the [3.6] - [4.5] – Vesc relation in the inner 10′′, the region of the dust lane, the region in which the [3.6] - [4.5] is redder than the extrapolated outer gradient. This is the effect of young stellar populations (see Fig. 9). A third remark about Fig. 18 is the fact that many galaxies that lie below the [3.6] - [4.5] – Vesc relation also lie below the Mg b – Vesc relation. This means that the scatter in both colours is not purely caused by measurement errors (in agreement with the fact that the instrumental errors in Mg b are much smaller than the scatter in the Mg b – Vesc relation (Paper XIV). For example, NGC 4458 and NGC 4387 lie below both relations, while NGC 5845 and 2549 are completely above them. Detailed stellar population analysis using more abosorption lines will be necessary to show what is causing this effect. On top of this, one should realize that the escape velocity depends on the assumed amount of dark matter in the galaxies, as shown by e.g. Weijmans et al. (2009). Also the slope of the galaxies in the colour – diagram changes. Since we don’t know how much dark matter these galaxies contain, we can only say that the small scatter from galaxy to galaxy shows that the amount and distribution of the dark matter relative to the visible light cannot be too different from galaxy to galaxy.
In Fig. 19 we show two local index-colour diagrams where the above mentioned results can be seen again. Fig. 19b shows that most galaxies in the H vs. [3.6] - [4.5] diagram follow almost vertical tracks. Within galaxies H is generally constant, while [3.6] - [4.5] shows a small gradient. When considering integrated values, galaxies do, however, show a reasonably strong relation between H and [3.6] - [4.5] (see Fig. 12), consistent with Paper XIV.
6 Discussion
Recently, Temi et al. (2005) and Bregman et al. (2006) used spectra in the mid-IR from 9-12 m to establish that Spitzer Space Telescope observations of elliptical galaxies are consistent with pure populations of very old stars with no evidence of younger stars. Here we have used the IRAC [3.6] - [4.5] colour, and show that very accurate measurements can provide us with a good metallicity indicator for the stellar populations, unaffected by dust extinction, and that also young stellar populations can be detected. The fact that this colour can be obtained relatively easily with a high S/N ratio offers interesting possibilities for the future.
We find a tight vs. relation. More massive galaxies become bluer in this mid-infrared colour, contrary to other known optical and near-infrared colours. The reason is that if the average temperature of the stars decreases, due to e.g., an increasing metallicity or a larger age, a CO-band which dominates the 4.5m Spitzer filter becomes stronger, so that the flux in the 4.5 filter decreases, and the colour bluens, despite the decreasing average temperature. The scatter for the SAURON sample, a representative sample of 48 ellipticals and S0 galaxies, is 0.015 mag, if one takes the colour in apertures of , and 0.024 mag, if a small aperture with radius is used. Since the individual error in the data points is in general smaller than 0.005 mag, this scatter is real. We show that the scatter can be caused by hot dust near the center of a galaxy heated by its AGN, or by the presence of young stellar populations, that are also seen in the H absorption line. Very few effects of AGB-stars are observed.
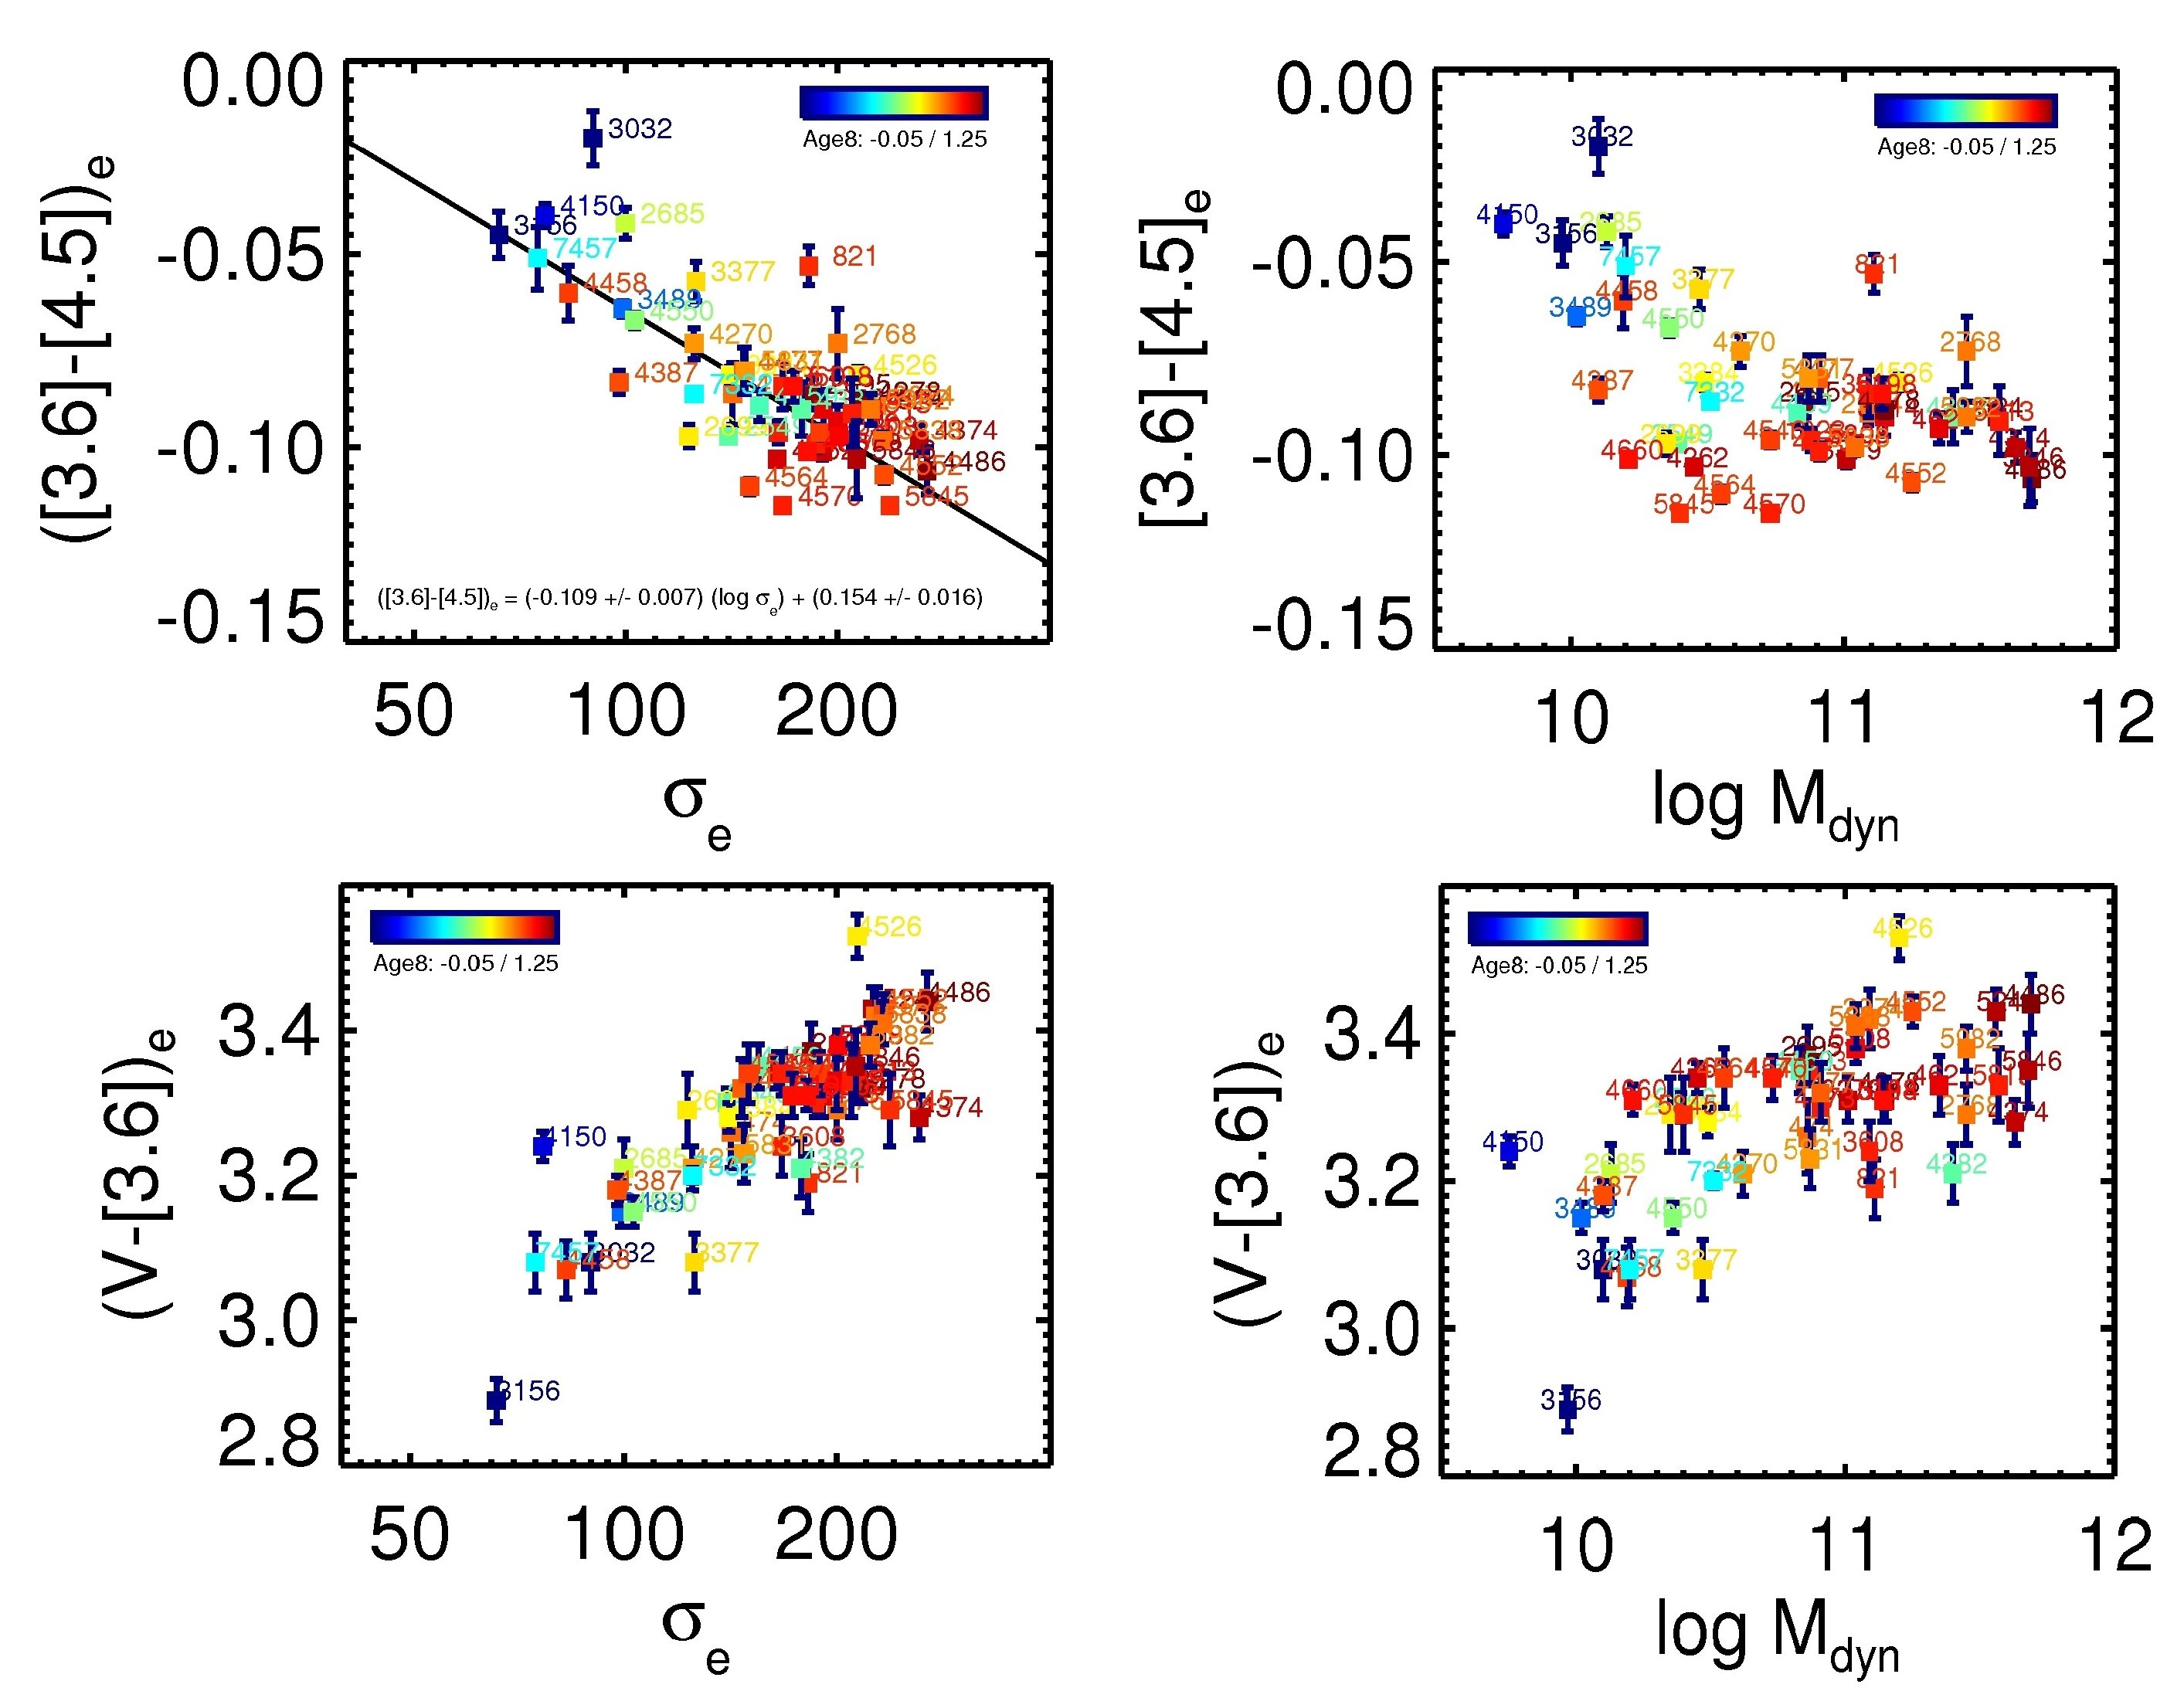
How to interpret the scaling relations? In Fig. 20 we have plotted [3.6] - [4.5] as a function of and mass (from Paper XIV). As mentioned before, the relation with mass is much more curved than the one with . For better understanding we also plot the same relations, but now having replaced [3.6] - [4.5] with V - [3.6], a colour we understand better. In the relations of colour vs. mass, we see a common pattern that the oldest galaxies show the reddest colours in V - [3.6] and the bluest in [3.6] - [4.5]. For a fixed mass or younger galaxies can be found at bluer colours in V - [3.6] and redder colours in [3.6] - [4.5]. When one compares the group of old galaxies that deviates from the straight [3.6] - [4.5] - mass relation (NGC 4570, 4564, 4262, 4660 and 5845) with other galaxies of the same mass, one sees that their stellar populations are older, their is larger, and their V - [3.6] is redder. It looks as if stellar populations depend more on then on total mass, something which might be expected from the fact that local stellar population indicators correlate so well with escape velocity. From this analysis we should conclude that the effects of metallicity on V - [3.6] for this sample are small, and the same probably also holds for [3.6] - [4.5] as a function of mass. What we are seeing is that the trends of V - [3.6] and [3.6] - [4.5] with mass and sigma are mostly due to age. Here one has to realize that this is SSP - age; a change in age means that the luminosity-weighted age is changing, by e.g. addition of a young component.
We find that the scatter in the vs. relation is considerably larger when using the small aperture of than when using . We think that this is because at larger radii the stellar populations are more uniform than in the central regions. Features are found in the colour that correspond to central disks, rings, and bars, that are often accompanied by young stellar populations. They are well visible in the line strength maps of Paper VI and in the ionized gas emission maps of Paper V. Although these young stellar populations, and also the red emission due to AGNs, are the most obvious causes respondible for the residuals in the vs. relation, there might be others, the most obvious one the contribution from evolved stars? Since most of the light in this infrared wavelength region comes from RGB and AGB stars, the contribution of AGB and RGB stars should vary as a function of age. AGB stars would have deep 4.5 m CO-bands, causing blue colours. The models of Marigo et al. (2008) confirm this. However, in younger galaxies we almost only see redder [3.6] - [4.5] colours. If a galaxy contains stars of 1-2 Gyr, which do not show much H absorption any more, it still could contain many AGB stars, making the [3.6] - [4.5] colour bluer for its H index. The fact that we don’t see obvious cases where this is happening shows that we know very little about the behavior of the AGB phase in the mid-infrared.
Some evidence for AGB populations might be found from absorption lines in the near-infrared. Mármol-Queraltó et al. (2009) measured near-infrared line indices in the K-filter in a number of ellipticals in the Fornax cluster and in the field. Although the Mg b - relation is the same for both the field and the Virgo sample, the CO index at 2.3 m is much stronger (at the same ) in the field sample. In this paper it is argued that this is due to an intermediate-age AGB population in the field. In the [3.6] - [4.5] vs. relation, we find no difference between cluster and field galaxies, as defined in Paper II. This is not impossible, since the fraction of star-forming galaxies in Fornax is much lower than in Virgo (e.g. Jordán et al. 2008), so that the likelihood for intermediate-age stars in Virgo galaxies is also higher than in Fornax.
The colour correlates well with a number of strong absorption lines in the optical: Mg b, Fe 5015 and H. This is expected, since both the colour and the indices strongly depend on age and metallicity of the stellar populations, each in a different way. These relations, however, do also have some scatter that is not caused by observational uncertainties. We have found that the [3.6] - [4.5] micron colours are redder for galaxies with a compact radio source (AGNs) than for other galaxies, indicating some hot dust, non-thermal emission, or simply young stars near the center. However, these younger stars are not detected in either Mg b, Fe 5015 or H. The effect in [3.6] - [4.5], however, is so small, that we cannot say whether the reddening is due to hot dust or to young stars. Some galaxies, showing completely old stellar populations, have bluer [3.6] - [4.5] colours than other galaxies with old stellar populations. Here we might be seeing intermediate-age AGB stars.
Due to the technical difficulties in observing in this wavelength region, and since stellar population studies are lacking here, the few theoretical stellar population models available have barely been tested and used. Since the models of Charlot & Bruzual (2007)) give redder colours for increasing metallicity, because they probably do not take into account the strong CO-band at 4.5 m, they cannot be used to interpret these observations. The models of Marigo et al. (2008) on the other hand do show the inverse behaviour observed in the data. However, these models also show that the colour is almost constant as a function of age, which is probably not in agreement with the data. At this moment we can conclude that larger, more massive, galaxies are more metal rich and bluer in . Young populations in the galaxies, primarily found in the inner regions, make this colour redder locally.
We find that there is no simple correlation between color gradient and mass, not even when the radial regions have been chosen in such a way that the color gradient measures a metallicity gradient (Fig. 17). We do, however, show that the [3.6] - [4.5] colour provides an excellent way to measure metallicity gradients in many galaxies. For the bright galaxies of the SAURON sample, we find that the colour gradients generally are positive, the [3.6]-[4.5] colour becoming redder outwards. This implies, consistent with studies in the optical and near-infrared -filter, that galaxies are less metal rich when going outwards. The comparison with the metallicity gradients (from the optical, Paper XVII) is excellent, apart from a few galaxies for which there is circumstantial evidence that the [3.6] – [4.5] gradients are also due to gradients in age. We find a hint that gradients for boxy galaxies are smaller on the average than those for disky ones. This can be expected if boxy galaxies have a larger fraction of low angular momentum orbits, which will dilute the three-dimensional gradients. On the other, if this were the case, one would also expect pressure-supported galaxies with low values to have smaller gradients than those with high values of . This effect is possibly too difficult to measure for our sample, given the dispersion caused by the range in inclination. A larger sample, e.g. the ATLAS3D sample (Cappellari et al. 2011), would be needed to establish the dependence of metallicity gradient on orbital structure.
7 Conclusions
In this paper, we have studied the Spitzer-IRAC colour, which for early-type galaxies is dominated by emission from stellar photospheres, is independent of dust extinction, and can be measured easily down to low surface brightness levels on the Spitzer data.
Here we summarize our main results.
-
•
The Spitzer-IRAC colour can be used very well to study the stellar populations in early-type galaxies.
-
•
Local early-type galaxies display a tight colour-velocity dispersion relation, with more massive galaxies showing bluer colours.
-
•
Although we also find tight relations of [3.6] - [4.5] with mass and 3.6 m luminosity, the latter are more curved than the one with . This has to do with the mass distribution within the galaxies and the change of slope in the Faber-Jackson relation. It looks as if stellar populations depend more on then on total mass.
-
•
Deviations from the colour - relations, larger than the observational uncertainties, are seen. Several of them are identified to be due to young stellar populations detected in the line strength maps of Kuntschner et al. (2006), in CO, in ionized gas, in UV and at 8 m, which cause the colour to redden.
-
•
In the galaxies that contain compact radio sources, as detected by the VLA FIRST survey, the [3.6] - [4.5] colour is slightly redder than in other galaxies of the same mass. This is due either to hot dust near the AGN, non-thermal emission, or young stars in the very center of these galaxies.
-
•
To be able to interpret the data well, stellar population models need to be improved. However, we can already say that the colour seems to be a good metallicity indicator, with this colour becoming bluer with increasing metallicity. Better modelling will have to show whether we can use the colour together with an optical line index to separate age and metallicity in galaxies.
-
•
We obtained radial colour profiles and measured colour gradients using the (outer) part of the radial colour profile that can be represented by a single linear fit, indicating a change in metallicity. Here we investigated the relation between colour gradients of old stellar populations (metallicity gradients) and galaxy mass, luminosity and . We find that colour gradients are generally positive, indicating that galaxies become redder going outwards, or slighty more metal poor.
-
•
The spread in gradients, especially for more massive galaxies, is real, and much larger than can be accounted for by observational uncertainties.
-
•
The local [3.6]-[4.5] colour shows a correlation with local escape velocity that is possibly even tighter than Mg b, since the dependence on age is smaller. The fact that this relation exists shows that the dark matter distribution, as compared to the luminous matter, is very similar from galaxy to galaxy.
The results presented in this paper show that the [3.6] - [4.5] colour is a useful stellar population measure, which is relatively easy to measure with high S/N in galaxies, when one has space-based data. In this paper we have shown that it is sensitive both to metallicity and Star Formation History. Since spectra in this region of the spectrum are extremely scarce, our understanding of the behaviour of this colour is limited. Moreover, available stellar population models are rather uncertain since evolved stages of stellar evolution are difficult to model. We will need to wait until the launch of the James Webb Space Telescope (JWST), for this situation to improve. At that time we get spectra in this wavelength region that will show what lies behind the scaling relations shown in this paper.
Acknowledgments
We thank Scott Trager for fruitful discussions, and Sandro Bressan for some very useful suggestions. This work is based on observations made with the Spitzer Space Telescope, which is operated by the Jet Propulsion Laboratory, California Institute of Technology under a contract with NASA. Support for this work was provided by NASA through an award issued by JPL/Caltech. The SAURON project was made possible through grants from NWO and financial contributions from the Institut National des Sciences de l’Univers, the Université Lyon I, the Universities of Durham, Groningen, Leiden and Oxford, the Programme National Galaxies, the British Council, PPARC grant Observational Astrophysics at Oxford 2002-2006 and support fromSpace Christ Church Oxford, and the Netherlands Research School for Astronomy NOVA. GvdV acknowledges support provided by NASA through Hubble Fellowship grant HST-HF-01202.01-A awarded by the Space Telescope Science Institute, which is operated by the Association of Universities for Research in Astronomy, Inc., for NASA, under contract NAS 5-26555. JFB acknowledges support from the Ramón y Cajal Program as well as grant AYA2010-21322-C03-02 by the Spanish Ministry of Science and Innovation. This paper is also based on observations obtained at the William Herschel Telescope, operated by the Isaac Newton Group in the Spanish Observatorio del Roque de los Muchachos of the Instituto de Astrofsica de Canarias. This project made use of the NED database. MC acknowledges support from a Royal Society University Research Fellowship.
References
- [\citeauthoryearAllard et al.2006] Allard E. L., Knapen J. H., Peletier R. F., Sarzi M., 2006, MNRAS, 371, 1087
- [\citeauthoryearArimoto & YoshiiArimoto & Yoshii1987] Arimoto N., Yoshii Y., 1987, AAP, 173, 23
- [\citeauthoryearBaldry et al.2004] Baldry I. K., Glazebrook K., Brinkmann J., Ivezić Ž., Lupton R. H., Nichol R. C., Szalay A. S., 2004, ApJ, 600, 681
- [\citeauthoryearBaum1959] Baum W. A., 1959, PASP, 71, 106
- [Becker et al.(1995)] Becker, R. H., White, R. L., & Helfand, D. J. 1995, ApJ, 450, 559
- [\citeauthoryearBender, Burstein, & Faber1992] Bender R., Burstein D., Faber S. M., 1992, ApJ, 399, 462
- [\citeauthoryearBender, Burstein, & Faber1993] Bender R., Burstein D., Faber S. M., 1993, ApJ, 411, 153
- [\citeauthoryearBernardi et al.2003] Bernardi M., et al., 2003, AJ, 125, 1882
- [\citeauthoryearBertelli et al.1994] Bertelli G., Bressan A., Chiosi C., Fagotto F., Nasi E., 1994, A&AS, 106, 275
- [\citeauthoryearBiretta, Stern, & Harris1991] Biretta J. A., Stern C. P., Harris D. E., 1991, AJ, 101, 1632
- [\citeauthoryearBower, Lucey, & Ellis1992] Bower R. G., Lucey J. R., Ellis R. S., 1992, MNRAS, 254, 601
- [\citeauthoryearBregman, Temi, & Bregman2006] Bregman J. N., Temi P., Bregman J. D., 2006, ApJ, 647, 26
- [Brooks et al.(2009)] Brooks, A. M., Governato, F., Quinn, T., Brook, C. B., & Wadsley, J. 2009, ApJ, 694, 396
- [\citeauthoryearBruzual & Charlot2003] Bruzual G., Charlot S., 2003, MNRAS, 344, 1000
- [\citeauthoryearFazio2005] Fazio G. G., 2005, neeu.conf, 47
- [\citeauthoryearBureau et al.2010] Bureau et al. 2011, MNRAS, in press (Paper XVIII)
- [Buta et al.(2010)] Buta, R. J., et al. 2010, ApJs, 190, 147
- [\citeauthoryearCalzetti et al.2005] Calzetti D., et al., 2005, ApJ, 633, 871
- [Cappellari et al.(2011)] Cappellari, M., et al. 2011, MNRAS, 413, 813
- [Carter(1978)] Carter, D. 1978, MNRAS, 182, 797
- [\citeauthoryearCenarro et al.2003] Cenarro A. J., Gorgas J., Vazdekis A., Cardiel N., Peletier R. F., 2003, MNRAS, 339, L12
- [\citeauthoryearCarlbergCarlberg1984] Carlberg R. G., 1984, ApJ, 286, 403
- [Carollo et al.(1993)] Carollo, C. M., Danziger, I. J., & Buson, L. 1993, MNRAS, 265, 553
- [\citeauthoryearChiosi & CarraroChiosi & Carraro2002] Chiosi C., Carraro G., 2002, MNRAS, 335, 335
- [\citeauthoryearCohen et al.1996] Cohen M., Witteborn F. C., Bregman J. D., Wooden D. H., Salama A., Metcalfe L., 1996, AJ, 112, 241
- [\citeauthoryearCombes, Young & BureauCombes et al.2007] Combes F., Young L. M., Bureau M., 2007, MNRAS, 377, 1795
- [\citeauthoryearDale et al.2009] Dale D. A., et al., 2009, ApJ, 703, 517
- [Davies et al.(1993)] Davies, R. L., Sadler, E. M., & Peletier, R. F. 1993, MNRAS, 262, 650
- [\citeauthoryearDavies et al.2001] Davies R. L., et al., 2001, ApJ, 548, L33
- [\citeauthoryearde Zeeuw et al.2002] de Zeeuw P. T., et al., 2002, MNRAS, 329, 513 (Paper II)
- [den Brok et al.(2011)] den Brok, M., et al. 2011, MNRAS, 653
- [\citeauthoryeardi Matteo, Pipino, Lehnert, Combes & Semelindi Matteo et al.2009] di Matteo P., Pipino A., Lehnert M. D., Combes F., Semelin B., 2009, AAP, 499, 427
- [\citeauthoryearEllis et al.1997] Ellis R. S., Smail I., Dressler A., Couch W. J., Oemler A., Jr., Butcher H., Sharples R. M., 1997, ApJ, 483, 582
- [\citeauthoryearEmsellem et al.2004] Emsellem E., et al., 2004, MNRAS, 352, 721
- [\citeauthoryearEmsellem et al.Paper IX2007] Emsellem E., et al., 2007, MNRAS, 379, 401 [Paper IX]
- [\citeauthoryearFaber et al.2007] Faber S. M., et al., 2007, ApJ, 665, 265
- [] Falcón-Barroso et al. 2011, MNRAS, in press
- [Fazio(2005)] Fazio, G. G. 2005, Neutrinos and Explosive Events in the Universe, 47
- [\citeauthoryearFerrarese & Merritt2000] Ferrarese L., Merritt D., 2000, ApJ, 539, L9
- [Franx & Illingworth(1990)] Franx, M., & Illingworth, G. 1990, ApJl, 359, L41
- [\citeauthoryearFranx, Illingworth & HeckmanFranx et al.1989] Franx M., Illingworth G., Heckman T., 1989, ApJ, 344, 613
- [\citeauthoryearGebhardt et al.2000] Gebhardt K., et al., 2000, ApJ, 539, L13
- [\citeauthoryearHo, Filippenko, & Sargent1997] Ho L. C., Filippenko A. V., Sargent W. L. W., 1997, ApJS, 112, 315
- [Jeong et al.(2009)] Jeong, H., et al. 2009, MNRAS, 398, 2028, Paper XIII
- [\citeauthoryearHopkins, Cox, Dutta, Hernquist, Kormendy & LauerHopkins et al.2009] Hopkins P. F., Cox T. J., Dutta S. N., Hernquist L., Kormendy J., Lauer T. R., 2009, ApJs, 181, 135
- [\citeauthoryearJordán, Blakeslee, Côté, Ferrarese, Infante, Mei, Merritt, Peng, Tonry & WestJordán et al.2007] Jordán A., Blakeslee J. P., Côté P., Ferrarese L., Infante L., Mei S., Merritt D., Peng E. W., Tonry J. L., West M. J., 2007, ApJs, 169, 213
- [\citeauthoryearJorgensen, Franx, & Kjaergaard1992] Jørgensen I., Franx M., Kjaergaard P., 1992, A&AS, 95, 489
- [\citeauthoryearKaneda, Onaka, & Sakon2007] Kaneda H., Onaka T., Sakon I., 2007, ApJ, 666, L21
- [\citeauthoryearKaviraj et al.2007] Kaviraj S., et al., 2007, ApJS, 173, 619
- [Kawata(2001)] Kawata, D. 2001, ApJ, 558, 598
- [\citeauthoryearKawata & GibsonKawata & Gibson2003] Kawata D., Gibson B. K., 2003, MNRAS, 340, 908
- [Kereš et al.(2005)] Kereš, D., Katz, N., Weinberg, D. H., & Davé, R. 2005, MNRAS, 363, 2
- [\citeauthoryearKobayashiKobayashi2004] Kobayashi C., 2004, MNRAS, 347, 740
- [Koleva et al.(2009)] Koleva, M., de Rijcke, S., Prugniel, P., Zeilinger, W. W., & Michielsen, D. 2009, MNRAS, 396, 2133
- [\citeauthoryearKuntschner et al.2006] Kuntschner H., et al., 2006, MNRAS, 369, 497, Paper VI
- [\citeauthoryearKuntschner et al.2010] Kuntschner H., et al., 2010, MNRAS, 408, 97, Paper XVII
- [\citeauthoryearLa Barbera & de CarvalhoLa Barbera & de Carvalho2009] La Barbera F., de Carvalho R. R., 2009, ApJl, 699, L76
- [\citeauthoryearLa Barbera, de Carvalho, Gal, Busarello, Merluzzi, Capaccioli & DjorgovskiLa Barbera et al.2005] La Barbera F., de Carvalho R. R., Gal R. R., Busarello G., Merluzzi P., Capaccioli M., Djorgovski S. G., 2005, ApJl, 626, L19
- [\citeauthoryearLa Barbera, Merluzzi, Busarello, Massarotti & MercurioLa Barbera et al.2004] La Barbera F., Merluzzi P., Busarello G., Massarotti M., Mercurio A., 2004, AAP, 425, 797
- [\citeauthoryearLandsmanLandsman1993] Landsman W. B., 1993, in ASP Conf. Ser. 52: Astronomical Data Analysis Software and Systems II: The IDL Astronomy User Library. p. 246
- [\citeauthoryearLarsonLarson1974] Larson R. B., 1974, MNRAS, 166, 585
- [\citeauthoryearLejeune, Cuisinier, & Buser1997] Lejeune T., Cuisinier F., Buser R., 1997, A&AS, 125, 229
- [\citeauthoryearMadden & Vigroux1999] Madden S. C., Vigroux L., 1999, ASPC, 163, 135
- [\citeauthoryearMarigo et al.2008] Marigo P., Girardi L., Bressan A., Groenewegen M. A. T., Silva L., Granato G. L., 2008, A&A, 482, 883
- [\citeauthoryearMármol-Queraltó et al.2009] Mármol-Queraltó E., et al., 2009, ApJ, 705, L199
- [Martin & Whittet(1990)] Martin, P. G., & Whittet, D. C. B. 1990, ApJ, 357, 113
- [\citeauthoryearMuñoz-Mateos et al.2009] Muñoz-Mateos J. C., et al., 2009, ApJ, 703, 1569
- [\citeauthoryearOgando, Maia, Pellegrini & da CostaOgando et al.2008] Ogando R. L. C., Maia M. A. G., Pellegrini P. S., da Costa L. N., 2008, AJ, 135, 2424
- [Oser et al.(2010)] Oser, L., Ostriker, J. P., Naab, T., Johansson, P. H., & Burkert, A. 2010, ApJ, 725, 2312
- [\citeauthoryearPeletier1989] Peletier R. F., 1989, PhD Thesis, University of Groningen
- [\citeauthoryearPeletier et al.1990] Peletier R. F., Davies R. L., Illingworth G. D., Davis L. E., Cawson M., 1990, AJ, 100, 1091
- [\citeauthoryearPeletier, Valentijn & JamesonPeletier et al.1990] Peletier R. F., Valentijn E. A., Jameson R. F., 1990, AAP, 233, 62
- [\citeauthoryearPipino, D’Ercole, Chiappini & MatteucciPipino et al.2010] Pipino A., D’Ercole A., Chiappini C., Matteucci F., 2010, ArXiv e-prints
- [\citeauthoryearPipino, D’Ercole & MatteucciPipino et al.2008] Pipino A., D’Ercole A., Matteucci F., 2008, AAP, 484, 679
- [\citeauthoryearPolletta et al.2006] Polletta M. d. C., et al., 2006, ApJ, 642, 673
- [\citeauthoryearRawle, Smith & LuceyRawle et al.2010] Rawle T. D., Smith R. J., Lucey J. R., 2010, MNRAS, 401, 852
- [\citeauthoryearReach et al.2005] Reach W. T., et al., 2005, PASP, 117, 978
- [\citeauthoryearSaglia, Maraston, Greggio, Bender & ZieglerSaglia et al.2000] Saglia R. P., Maraston C., Greggio L., Bender R., Ziegler B., 2000, AAP, 360, 911
- [\citeauthoryearSaglia et al.2002] Saglia R. P., Maraston C., Thomas D., Bender R., Colless M., 2002, ApJ, 579, L13
- [\citeauthoryearSánchez-Blázquez, Gorgas, & Cardiel2006] Sánchez-Blázquez P., Gorgas J., Cardiel N., 2006, A&A, 457, 823
- [\citeauthoryearSánchez-Blázquez et al.2009] Sánchez-Blázquez P., et al., 2009, A&A, 499, 47
- [\citeauthoryearSandage1972] Sandage A., 1972, ApJ, 176, 21
- [\citeauthoryearSarzi et al.2006] Sarzi M., et al., 2006, MNRAS, 366, 1151, Paper V
- [\citeauthoryearSarzi et al.Paper XVI2010] Sarzi M., et al., 2010, MNRAS, 402, 2187 [Paper XVI]
- [\citeauthoryearSchawinski et al.2007] Schawinski K., Thomas D., Sarzi M., Maraston C., Kaviraj S., Joo S.-J., Yi S. K., Silk J., 2007, MNRAS, 382, 1415
- [\citeauthoryearSchweizer & Seitzer1992] Schweizer F., Seitzer P., 1992, AJ, 104, 1039
- [\citeauthoryearScott et al.Paper XIV2009] Scott N., et al., MNRAS, 2009, 398, 1835 [Paper XIV]
- [\citeauthoryearShapiro et al.2010] Shapiro K. L., et al., 2010, MNRAS, 402, 2140 (Paper XV)
- [\citeauthoryearSmith et al.2009] Smith R. J., Lucey J. R., Hudson M. J., Allanson S. P., Bridges T. J., Hornschemeier A. E., Marzke R. O., Miller N. A., 2009, MNRAS, 392, 1265
- [\citeauthoryearSpolaor, Kobayashi, Forbes, Couch & HauSpolaor et al.2010] Spolaor M., Kobayashi C., Forbes D. A., Couch W. J., Hau G. K. T., 2010, ArXiv e-prints
- [\citeauthoryearSpolaor, Proctor, Forbes & CouchSpolaor et al.2009] Spolaor M., Proctor R. N., Forbes D. A., Couch W. J., 2009, ApJl, 691, L138
- [\citeauthoryearTang et al.2009] Tang Y., Gu Q.-S., Huang J.-S., Wang Y.-P., 2009, MNRAS, 397, 1966
- [\citeauthoryearTemi, Mathews, & Brighenti2005] Temi P., Mathews W. G., Brighenti F., 2005, ApJ, 622, 235
- [\citeauthoryearTemi, Brighenti, & Mathews2008] Temi P., Brighenti F., Mathews W. G., 2008, ApJ, 672, 244
- [\citeauthoryearTerlevich et al.1981] Terlevich R., Davies R. L., Faber S. M., Burstein D., 1981, MNRAS, 196, 381
- [\citeauthoryearThomas et al.2005] Thomas D., Maraston C., Bender R., Mendes de Oliveira C., 2005, ApJ, 621, 673
- [\citeauthoryearVéron-Cetty & Véron2006] Véron-Cetty M.-P., Véron P., 2006, A&A, 455, 773
- [\citeauthoryearVader, Vigroux, Lachieze-Rey & SouvironVader et al.1988] Vader J. P., Vigroux L., Lachieze-Rey M., Souviron J., 1988, AAP, 203, 217
- [Weijmans et al.(2009)] Weijmans, A.-M., et al. 2009, MNRAS, 398, 561
- [\citeauthoryearWestera et al.2002] Westera P., Samland M., Bruzual G., Buser R., 2002, ASPC, 274, 166
- [\citeauthoryearWhiteWhite1980] White S. D. M., 1980, MNRAS, 191, 1P
- [\citeauthoryearWillner et al.1977] Willner S. P., Soifer B. T., Russell R. W., Joyce R. R., Gillett F. C., 1977, ApJ, 217, L121
- [\citeauthoryearWorthey, Faber, & Gonzalez1992] Worthey G., Faber S. M., Gonzalez J. J., 1992, ApJ, 398, 69
- [\citeauthoryearYi et al.2005] Yi S. K., et al., 2005, ApJL, 619, 111
- [Young et al.(2009)] Young, L. M., Bendo, G. J., & Lucero, D. M. 2009, AJ, 137, 3053