The Velocity Distribution of Solar Photospheric Magnetic Bright Points
Abstract
We use high spatial resolution observations and numerical simulations to study the velocity distribution of solar photospheric magnetic bright points. The observations were obtained with the Rapid Oscillations in the Solar Atmosphere instrument at the Dunn Solar Telescope, while the numerical simulations were undertaken with the MURaM code for average magnetic fields of 200 G and 400 G. We implemented an automated bright point detection and tracking algorithm on the dataset, and studied the subsequent velocity characteristics of over 6000 structures, finding an average velocity of approximately 1 km s-1, with maximum values of 7 km s-1. Furthermore, merging magnetic bright points were found to have considerably higher velocities, and significantly longer lifetimes, than isolated structures. By implementing a new and novel technique, we were able to estimate the background magnetic flux of our observational data, which is consistent with a field strength of 400 G.
1 Introduction
Granulation forms the instantly recognisable “patchwork” pattern of the solar photosphere and dominates quiet Sun regions. The dark intergranular lanes are formed as a result of convective downflows and are the regions where magnetic bright points (MBPs) can be observed. It is the horizontal transfer of magnetic flux from the centre of granules, and into the lanes, that forms MBPs. In the MBPs, the magnetic flux clumps together to form small magnetic concentrations with field strengths of the order of a kiloGauss (Stenflo, 1985; Solanki, 1993). These are some of the smallest features currently observable on the solar surface, and due to their dynamic nature, can provide a conduit for the transfer of kinetic energy into the upper solar atmosphere (de Wijn et al., 2009).
Due to the increased computational power available in recent years, significant progress has been made in understanding the complex interplay between convective energy transport and radiation in these concentrated magnetic elements. MBPs are best observed as strong intensity enhancements in G-band intensity images (Muller & Roudier, 1984; Berger & Title, 1996) which have intensity peaks between times the mean photospheric intensity (Sánchez Almeida et al., 2004; Langhans et al., 2002). These enhancements are due to an increase in continuum intensity, caused by the continuum formation layer being depressed into the deeper, hotter layers of the solar photosphere, where regions of strong magnetic field concentrations and reduced CH abundances exist (Steiner et al., 2001; Shelyag et al., 2004).
The significance of MBPs on solar atmospheric energy transport and dynamics has led to several studies on their area coverage and size distribution. Sánchez Almeida et al. (2004) found that MBPs have a minor axis of 135 km, while Wiehr et al. (2004) determined a predominant diameter of km. In a recent study, Crockett et al. (2010) utilised high spatial resolution observations and magneto-hydrodynamic (MHD) simulations to conclude that the MBP area distribution peaks at 45000 km2, with a sharp decrease in occurrence for smaller surface areas. The area of the smallest MBPs is defined by the width of the inter-granular lanes, which is in turn limited by the balance of radiative and convective energies in the magneto-convective processes.
MBP velocities are induced by the expansion of granules, and are typically in the range of km s-1 (Berger & Title, 1996; Utz et al., 2010). It has been shown by Choudhuri et al. (1993) that magnetic footpoints with velocities greater than 2 km s-1 can excite magneto-sonic kink waves, which can transport sufficient energy to heat the localised quiet corona, under a two layer atmospheric approximation. Also, recent observations (Bonet et al., 2008; Wedemeyer-Böhm & Rouppe van der Voort, 2009) and simulations (Shelyag et al., 2011a) suggest the presence of vortex motions in the photosphere, with a possible connection to the spiral tracks of MBPs and chromospheric swirls. Very recent studies by Shelyag et al. (2011b) and Fedun et al. (2011) have indicated how vortex motions generate a significant amount of Poynting flux directed outwards from the photosphere, and, as a result, may be the source of various observed MHD wave modes.
In this paper, we use high spatial and temporal resolution observations, in addition to numerical simulations, to determine the velocity distribution of a large sample of MBPs. The observations and numerical simulations are described in § 2, while the methodology used, and the values obtained for the velocities of MBP structures, are detailed in § 3. As our tracking algorithm can detect and monitor bright point chains, as well as isolated brightenings and merger events, we believe that this is a unique study of the dynamics of MBPs in the solar photosphere. Differences between the velocity characteristics of non-merging MBPs, and those that undergo mergers with other bright points, are discussed in § 3. Finally, our concluding remarks are given in § 4.
2 Observations and Numerical Simulations
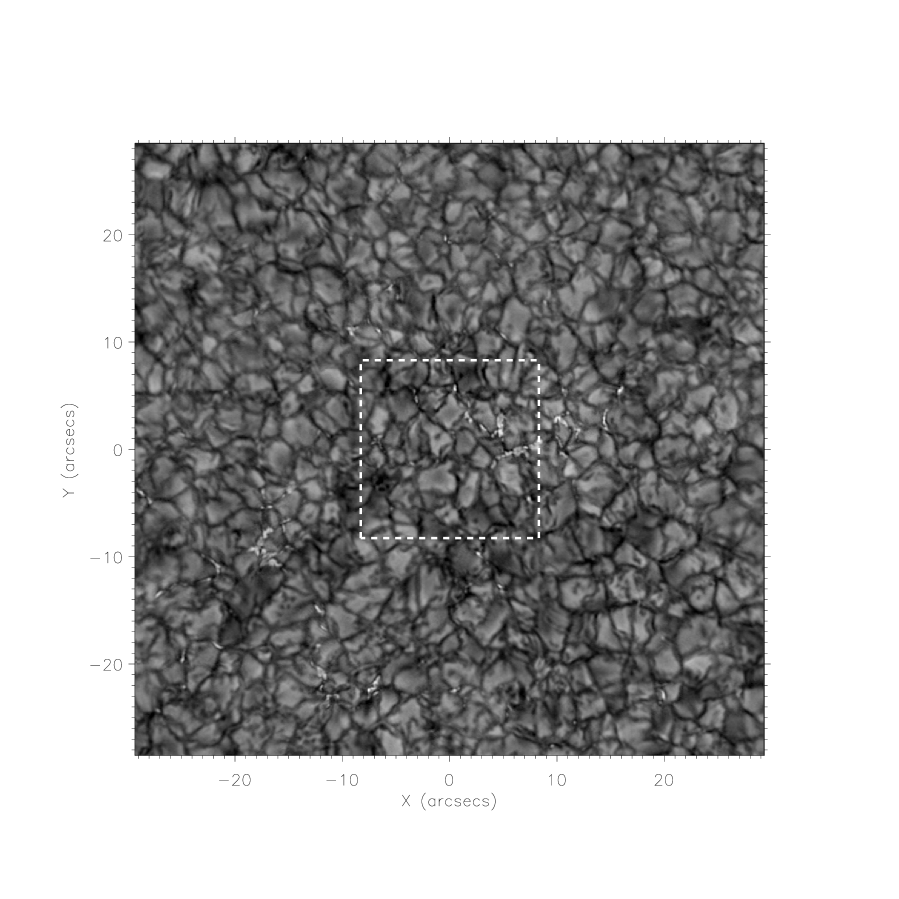
The data employed in this study were obtained using the Rapid Oscillations in the Solar Atmosphere (ROSA; Jess et al., 2010) instrument, which is installed as a common-user facility at the 76 cm Dunn Solar Telescope (DST), in New Mexico, USA. Observations were obtained during a period of excellent seeing on 2009 May 28, using a Å wide filter centred at Å (G-band). We observed a quiet Sun region at disk centre for 50 minutes, achieving diffraction-limited imaging with pixel-1. The images were reconstructed using Speckle algorithms (Wöger et al., 2008), while image de-stretching was performed using a grid (equating to a separation between spatial samples; Jess et al., 2007, 2008). These processes were implemented to remove the effects of atmospheric seeing from the dataset. G-band images were taken at a raw cadence of 0.033 s, while after speckle reconstruction the cadence was reduced to 0.528 s. Reconstructed images were then binned into consecutive groups of four to improve the signal-to-noise and reduce the overall volume of the dataset, providing a final image cadence of 2.1 s.
Simulated G-band images were produced using the detailed radiative transport technique described by Shelyag et al. (2004), with the solar photospheric magneto-convection models for the radiative transport calculations provided by the MURaM radiative MHD code (Vögler et al., 2005). A computational domain of size Mm3, was employed for the simulations, resolved by grid cells, providing a horizontal two-pixel resolution of 50 km. The level corresponding to the visible solar surface is located approximately 600 km below the upper boundary of the domain. Side boundaries of the domain are periodic, while the upper boundary is closed for vertical and stress-free horizontal plasma motions and the bottom boundary is transparent. The numerical solution is stabilised against numerical instabilities using hyperdiffusive source terms (Caunt & Korpi, 2001; Vögler et al., 2005; Shelyag et al., 2008).
In the initial stage of the numerical simulation, we use a well-developed non-magnetic photospheric convection snapshot, where we introduce uniform unipolar vertical magnetic fields of 200 G and 400 G, representing two different levels of solar magnetic activity. Following the injection of magnetic fields into the simulation, they quickly become horizontally transfered into the intergranular lanes, creating magnetic field concentrations with a strength of up to 2 kG at the photospheric level. After a few convective turnover timescales, we record 219 and 177 magneto-convection snapshots, at 200 G and 400 G, respectively, for further analysis. To obtain the G-band intensities emerging from the simulated photospheric snapshots, a spectral band in the wavelength range from 4295 Å to 4315 Å, which contains 241 CH molecular lines and 87 atomic lines, was calculated for each vertical ray in the snapshots, and convolved with a filter function centred at 4305 Å with a width of 9.2 Å.
3 Analysis and Results
The MBPs analysed in this paper were detected using the algorithm developed by Crockett et al. (2010). This automated algorithm uses the intergranular lanes to produce a binary map of bright features. A compass search is employed to disentangle features within the lanes, i.e. MBPs, from bright granules. Finally, intensity thresholding across the feature is used to determine more accurately the size and shape of the MBP. Long-lived features are then established, and stabilised, by examining subsequent frames to observe the MBP’s evolution in time. More details of these procedures may be found in Crockett et al. (2010).
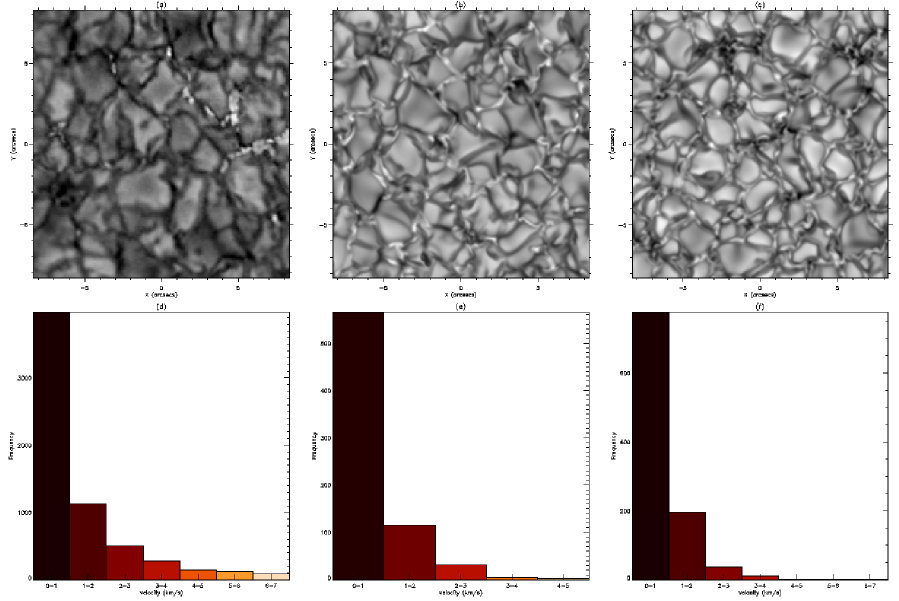
Figure 1 shows the full ROSA field-of-view, while Figure 2(a) shows an expanded version of the region highlighted in Figure 1, together with sample images of the 200 G (Fig. 2b) and 400 G (Fig. 2c) simulations. The algorithm produces an outline of the centre of gravity of each MBP observed, as well as a direct measurement of the area of each feature. A 30 s cut-off was employed to remove those MBPs which are short-lived and unlikely to have a significant horizontal velocity component, as well as assisting the removal of any false detections that may adversely affect the results. Figure LABEL:Fig3 shows snapshots from two videos that have been included as an online resource. The first depicts the tracking capabilities of the algorithm for an individual MBP throughout its 336 s lifetime, while the second displays how an MBP from the 200 G MHD simulation is tracked.
Our observed G-band dataset included a total of 6236 MBPs with lifetimes exceeding 30 s. These MBPs were found to have an average velocity of approximately 1 km s-1, and a mean lifetime of 91 s. The highest velocity recorded in this study was 7 km s-1, a value comparable to the photospheric sound speed, while the longest MBP lifetime observed was approximately 20 minutes. Similar values were obtained when the same methodology was applied to the numerical simulations. A total of 721 MBPs were detected in the 200 G simulation, with an average velocity of 0.6 km s-1, a maximum of 4.1 km s-1, an average lifetime of 108.2 s, and a maximum of just over 11 minutes. In the 400 G simulation, we detected 1024 MBPs, with an average velocity of 0.65 km s-1 and a maximum of 6.2 km s-1, an average lifetime of 168.4 s and a maximum of nearly 17 minutes. Histograms indicating the distributions of velocities for all three data sets are shown in Figure 2(d–f), with the results summarised in Table 1. A dependence of the velocity distribution on the average magnetic field strength (and thus on the solar magnetic activity level) suggests an alternative, and novel, way of estimating the net magnetic flux in the solar photosphere. Hence, as the best agreement with our observations is found for the 400 G simulation, we can infer the average magnetic flux of our observations as being close to 400 G. Small discrepancies between our observed and simulated datasets may be due to the large MBP sample present in our observations (6236 versus 1024).
The distribution of velocities, for both the observed and simulated datasets, are shown as histograms in Figure 2(d–f). These demonstrate that the majority of MBPs have velocities between 0 and 1 km s-1, while some MBPs (i.e. 30% in the observations, 6% in the 200 G simulated data and 6% in the 400 G) have velocities in excess of 2 km s-1. The considerable fraction of MBPs with velocities greater than 2 km s-1 is important, as rapid bursts in their motion may induce magnetosonic kink waves (Choudhuri et al., 1993). As shown previously, these kink waves may act as a conduit for imparting energy into the upper solar atmosphere.
Although there is considerable agreement between the results obtained in the observed and simulated data, there are some slight discrepancies that need to be addressed for a more complete picture. For example, the maximum velocity, the maximum lifetime and the proportion of MBPs with velocities greater than 2 km s-1 are all smaller in the simulated datasets. A possible reason is that the net (or average) magnetic field applied within the computational domain remains constant throughout the 200 G or 400 G time series, whereas the flux present in the observed data may constantly change with time. This dynamic nature of flux generation and annihilation could directly lead to the higher velocity distributions detected for the observed MBPs.
An alternative algorithm based on local correlation tracking (LCT; Welsch et al., 2004; Matloch et al., 2010) was applied to the observations and simulated time series, and yielded similar velocity characteristics to within 0.3 km s-1. A significant number of MBPs, 21% of those detected in the observations, were involved with a merging event. Only a few of mergers (31) are observed in the 200 G simulation, whereas 207 are detected in the 400 G simulation. Comparisons with an active region area would be a useful study in the future to observe how the frequency of merging events in such a feature compares to the quiet Sun region discussed here.
There is only a slight difference between the velocities obtained for merging events and those of isolated MBPs. The average velocities evaluated for all the merging events in the observations was found to be 1.6 km s-1, slightly above the measured value for isolated MBPs. However, the average lifetime of the merging MBPs is 201.2 s, more than twice the value for non-merging MBPs. These results are echoed in the values for the 200 G simulated dataset, although only 31 mergers were witnessed out of the 721 detections. Here, the average velocity of the merging MBPs is 0.9 km s-1, with an average lifetime of 227 s. For the 400 G simulation time series, the average velocity was found to be 0.8 km s-1, with an average lifetime of a merging MBP of 329 s (determined over a total of 207 merging events). These results show that there is little difference in the velocity of a merging MBP when compared with its non-merging counterpart. However, the former do appear to have longer lifetimes. This effect may arise due to an increase in stability of the MBPs when they undergo a merger. One possibility to account for the marginal elevation of velocity characteristics for merging MBPs is the barycenter method used to establish the merging velocity. During a merger, the shift of the centre of gravity as the MBPs unite may lead to a larger recorded velocity value. This may also explain why we see such a high maximum velocity in the observed data set. It is most likely an artefact of MBP geometry changes, which induce a considerable motion on the barycenter of the MBP structure. Thus, some velocities may be overestimated by this method. However, employing LCT methods on the same MBP groups indicate that a fraction of these structures do in fact demonstrate velocities comparable to the sound speed.
4 Concluding Remarks
We have used high resolution observations, and state-of-the-art MHD simulations, to determine the velocity distribution of magnetic bright points (MBPs) on the solar surface. The average velocity established from our observations is 1 km s-1, averaged over a total of 6236 MBP structures, with a typical lifetime of 91 s. A total of 721 MBPs were tracked in the 200 G numerical simulation, with an average velocity of 0.6 km s-1 and a mean lifetime of 108.2 s. The slight differences between the observed and 200 G simulated datasets can be attributed to the initial value of magnetic field applied to the MHD simulation. Using an initial magnetic field of 400 G, the subsequent numerical simulation yielded values closer to the observational distribution. The average velocity and average lifetime of the 1024 MBPs detected in the 400 G data is 0.65 km s-1 and 168.4 s, respectively. When local correlation tracking (LCT) was applied to each data set, the difference in MBP velocities was found to be 0.3 km s-1, showing a level of consistency between the two independent techniques.
For the merging events witnessed in the observational dataset, the average velocity was found to be 1.6 km s-1, with a mean lifetime of 201.2 s. The 200 G simulated dataset only produced 31 merger events, with an average velocity of 0.9 km s-1 and mean lifetime of 227 s. By contrast, the 400 G simulation had 207 mergers, with an average velocity of 0.8 km s-1 and mean lifetime of 329 s. All of the data sets show that merging events exhibit longer average lifetimes, which we believe is a result of greater MBP stability as a result of the merger. Although the 200 G simulation produce similar MBP lifetimes, our data are most consistent with the 400 G simulation in both appearance and in MBP merger lifetimes. We intend to expand on this study by observing the velocity characteristics of MBPs and merger events in the vicinity of an active region.
Importantly, we have presented a novel technique for estimating the average photospheric magnetic flux through comparison of observations and MHD simulations. By scaling the initial magnetic flux injected into the numerical simulation to replicate the MBP dynamics established in our observational time series, we can directly estimate the average background magnetic flux in the solar feature studied, without the necessity of vector magnetograms. Following this methodology, we find our observational data is consistent with an average magnetic flux of 400 G.
References
- Berger & Title (1996) Berger, T. E., & Title, A. M., 1996, ApJ, 463, 365
- Bonet et al. (2008) Bonet, J. A., Márquez, I., Sánchez Almeida, J., Cabello, I., & Domingo, V. 2008, ApJ, 687, L131
- Caunt & Korpi (2001) Caunt, S. E., & Korpi, M. J., 2001, A&A, 369, 706
- Choudhuri et al. (1993) Choudhuri, A. R., Dikpati, M., & Banerjee, D., 1993, ApJ, 413, 811
- Crockett et al. (2010) Crockett, P. J., Mathioudakis, M., Jess, D. B., Shelyag, S., Keenan, F. P., & Christian, D. J., 2010, ApJL, 722, L188
- de Wijn et al. (2009) de Wijn, A. G., Stenflo, J. O., Solanki, S. K., & Tsuenta, S., 2009, Space Sci Rev., 144, 275
- Fedun et al. (2011) Fedun, V., Shelyag, S., Verth, G., Mathioudakis, M., & Erdélyi, R. 2011, Annales Geophysicae, 29, 1029
- Jess et al. (2007) Jess, D. B., Andić, A., Mathioudakis, M., Bloomfield, D. S., & Keenan, F. P. 2007, A&A, 473, 943
- Jess et al. (2010) Jess, D. B., Mathioudakis, M., Christian, D. J., Keenan, F. P., Ryans, R. S. I., & Crockett, P. J., 2010, Sol. Phys, 261, 363
- Jess et al. (2008) Jess, D. B., Mathioudakis, M., Crockett, P. J., & Keenan, F. P., 2008, ApJL, 688, L119
- Langhans et al. (2002) Langhans, K., Schmidt, W., & Tritschler, A., 2002, A&A, 394, 1069
- Matloch et al. (2010) Matloch, Ł., Cameron, R., Shelyag, S., Schmitt, D., & Schüssler, M., 2010, A&A, 519, A52
- Muller & Roudier (1984) Muller, R., & Roudier, T., 1984, Sol. Phys., 94, 33
- Sánchez Almeida et al. (2004) Sánchez Almeida, J., Márquez, I., Bonet, J. A., Domínguez Cerdeña, I., & Muller, R., 2004, ApJL, 609, L91
- Shelyag et al. (2004) Shelyag, S., Schüssler, M., Solanki, S. K., Berdyugina, S. V., Vögler, A., 2004, A&A, 427, 335
- Shelyag et al. (2008) Shelyag, S., Fedun, V., & Erdélyi, R. 2008, A&A, 486, 655
- Shelyag et al. (2011a) Shelyag, S., Keys, P. H., Mathioudakis, M., & Keenan, F. P., 2011a, A&A, 526, A5
- Shelyag et al. (2011b) Shelyag, S., Fedun, V., Keenan, F. P., Erdélyi, R., & Mathioudakis, M. 2011b, Annales Geophysicae, 29, 883
- Solanki (1993) Solanki, S. K., 1993, Space Sci. Rev., 63, 1
- Steiner et al. (2001) Steiner, O., Hauschildt, P. H., & Bruls, J., 2001, A&A, 372,L13
- Stenflo (1985) Stenflo, J. O., 1985, Sol. Phys., 100, 189
- Utz et al. (2010) Utz, D., Hanslmeier, A., Muller, R., Veronig, A., Rybák, J., & Muthsam, H., 2010, A&A, 511, A39
- Vögler et al. (2005) Vögler, A., Shelyag, S., Schüssler, M., Cattaneo, F., Emonet, T., & Linde, T., 2005, A&A, 429, 335
- Wedemeyer-Böhm & Rouppe van der Voort (2009) Wedemeyer-Böhm, S., & Rouppe van der Voort, L. 2009, A&A, 507, L9
- Welsch et al. (2004) Welsch, B. T., Fisher, G. H., Abbett, W. P., & Regnier, S. 2004, ApJ, 610, 1148
- Wiehr et al. (2004) Wiehr, E., Bovelet, B., & Hirzberger, J., 2004, A&A, 422, L63
- Wöger et al. (2008) Wöger, F., von der Lühe, O., & Reardon, K., 2008, A&A, 488, 375
| Data Set | ROSA Observations | 200G Sims | 400G Sims |
| FOV size | |||
| Average cadence (s) | 2.112 | 8.7 | 6.7 |
| Number of MBPs detected | 6236 | 721 | 1024 |
| Mean lifetime (s) | 91 | 108 | 168 |
| Average velocity (km s-1) | 1.0 | 0.6 | 0.65 |
| Maximum velocity (km s-1) | 7.0 | 4.1 | 6.2 |
| Percentage of detections that merge | 21% | 4% | 20% |
| Average velocity of mergers (km s-1) | 1.6 | 0.9 | 0.8 |
| Average lifetime of mergers (s) | 201 | 227 | 329 |