Budker Institute of Nuclear
Physics, Novosibirsk, 630090, Russia
On behalf of Belle
Collaboration
Abstract
Originally designed for CP violation studies in the B meson system,
the B-Factories recently showed an exciting capability for improving
our experimental knowledge in the field of hadron spectroscopy. We
review results on bottomonium spectroscopy from the Belle experiment
at the KEK-B collider and present exciting new results from the
unique large data set taken at the resonance.
PRESENTED AT
The Ninth International Conference on
Flavor Physics and CP Violation
(FPCP 2011)
Maale Hachamisha, Israel, May 23–27, 2011
1 Introduction
The Belle Collaboration has collected a large sample of
collisions at the energy of the resonance, which lies above
the threshold for production of meson pairs, primarily with a
purpose of studying decays of . There have been a number of
unexpected results on the non- decays of the . In
particular, anomalously large rates for dipion transitions to lower
bottomonium states have been
observed [1]. If these signals are attributed entirely to
the decays, the measured partial decay widths
are about two orders of
magnitude larger than typical widths for dipion transitions among
states with .
Recently the CLEO-c Collaboration observed the process
at a rate comparable to the process
at and found an indication of
an even higher transition rate at the
energy [2]. This implies that the production
might be enhanced in the region of the and motivates a search
for the in the data.
We use the full data sample with the integrated luminosity of
collected near the peak of the resonance with the
Belle detector [3] at the KEKB asymmetric-energy
collider [4].
2 Observation of the and
We observe the and in the missing mass spectrum of
pairs. The missing mass is defined as where is
the center-of-mass (c.m.) energy, and are
the energy and momentum measured in c.m. frame. The details of
the analysis can be found in [5]. The
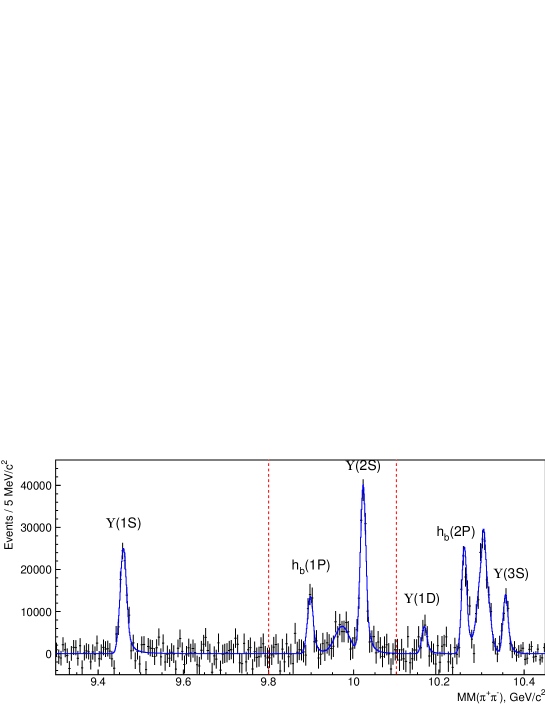
distribution for the selected pairs is shown in
Fig. 1(a). In this figure only the and
transitions are discernible.
To fit the spectrum, we separate it into three adjacent
regions with boundaries at , ,
and . We fit every region separately to
better control the complicated shape of the combinatorial
background, which is described by a Chebyshev polynomial of 6-7th
order. In region 3 we subtract the contribution bin-by-bin,
while in other regions its shape is smooth and is absorbed into
combinatorial background. The signal peaks are described by
Gaussians with paramenters obtained from exclusive decays of the
to .
The
spectrum with the combinatorial background and contributions
subtracted, and the signal function resulting from the fit overlaid,
are shown in Fig. 1(b).
Figure 1: (a)The distribution for the selected
pairs. Vertical lines indicate the locations of the , ,
, and signals. (b) The spectrum with the combinatorial background and
contributions subtracted (dots with error bars) and signal
component of the fit function (solid histogram). The vertical dashed
lines indicate the boundaries of the fit regions.
The significance of the and signals which includes the
systematic uncertainty is and ,
respectively.
This is the first observation of the and spin-singlet
bottomonium states in the reaction at the
energy. We measure the masses and the cross sections relative to the
cross-section:
,
for the and
,
for the .
The masses do not differ significantly from the center-of-gravity of
the corresponding states. For the hyperfine splitting we
find for the and
for the .
The values of
comparable with unity indicate that the and
are produced via an exotic process that violates the
suppression of heavy quark spin-flip. For further study we
investigate resonant substructure of these decays [6].
Because of high background Dalitz plot analysis is impossible with
current statistics, therefore we study the one-dimensional
distributions in . We define the as a
missing mass of the opposite-sign pion, . We measure the
yield of signal decays as a function of the by fitting
the spectra in the bins of . We combine the
spectra for the corresponding and bins
and we use half of the phase space to avoid double counting.
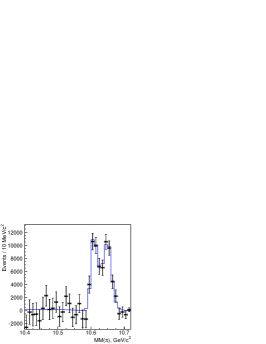
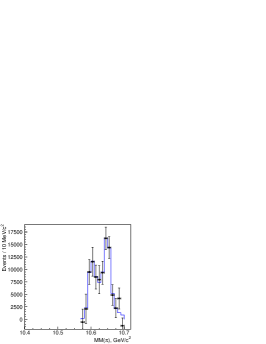
Results of the fits for the yield as a function of are
shown in Fig. 2. The yield
exhibits a clear two-peak structure without
any significant non-resonant contribution. In the following we refer
to these structures as and , respectively.
Figure 2: Left: the yield of the as a
function of (points with error bars) and results of the fit
(histogram). Right: the yield of the as a function of
(points with error bars) and results of the fit (histogram).
We perform a fit to the distributions. We assume
that spin-parity for both and is , therefore
in the fit function we use a coherent sum of two -wave
Breit-Wigner amplitudes; we add also a non-resonant contribution.
(1)
Here ; the variables , ,
(), , , and are floating in the fit;
is a phase-space factor, () is the
momentum of the pion originating from the () decay
measured in the rest frame of the corresponding mother particle. The
results of the fit are shown in Fig. 2 and are
summarized in Table 1. The non-resonant amplitude is
found to be consistent with zero.
We find that the hypothesis of two resonances is favored over
the hypothesis of a single resonance (no resonances) at the
() level. The parameters of the
and obtained in the fit of and are consistent with
each other.
3 Analysis of
To select candidate events we require the presence of
a pair of muon candidates with an invariant mass in the range of
and two pion candidates of
opposite charge. These tracks are required to be consistent with
coming from the interaction point. We also require that none of the
four tracks be positively identified as an electron. No additional
requirements are applied at this stage.
Candidate events are identified by the invariant mass
of the combination and the missing mass
associated with the system calculated as where
is the center-of-mass (c.m.) energy and
and are the energy and momentum of the system
measured in the c.m. frame.
The amplitude analyses of the three-body decays that
are reported here are performed by means of unbinned maximum
likelihood fits to two-dimensional Dalitz distributions.
Before fitting the Dalitz plot for events in the signal region, we
determine the distribution of background events over the Dalitz plot
using events in the mass sidebands that are refitted
to the nominal mass of the corresponding state to match the
phase space boundaries.
In the sideband Dalitz distributions one can see a strong
concentration of background events in the very low invariant
mass region; these are due to photon conversion on the innermost
parts of the Belle detector. Because of their low energy, these
conversion electrons are poorly identified and pass the electron
veto requirement. We exclude this high background region by applying
the requirements on the invariant mass. For the remainder of
the Dalitz plot the distribution of background events is assumed to
be uniform. The variation of reconstruction efficiency across the
Dalitz plot is determined from MC simulation. The fraction of signal
events in the signal region for each of the three final
states is determined from a fit to the corresponding
spectrum using a Crystal Ball function [7] for the
signal and a linear function for the combinatorial background
component.
Figure 3 shows Dalitz plots of the events in the
signal regions for the three decay channels under study. In all
cases, two horizontal bands are evident in the system near
( GeV) and
( GeV).
Figure 3: Dalitz plots for events in the (a) ; (b)
; (c) signal regions. Dalitz plot regions to
the right of the vertical lines are included in the amplitude
analysis.
We use the following parameterization for the
three-body decay amplitude:
(2)
where , . Here we assume
that the dominant contributions come from the amplitudes that
conserve the orientation of the spin of the heavy quarkonium state
and, thus, both pions in the cascade decay
are emitted in an -wave with respect to the heavy quarkonium
system. As will be shown later, angular analyses support this
assumption. Consequently, we parameterize the observed
and peaks with an -wave Breit-Wigner function
without dependence of the resonance width . To account
for the possibility of decay to both and
, the amplitudes and are symmetrized with
respect to and transposition. Taking into account
isospin symmetry, the resulting amplitude is written as
(3)
where the masses and the widths () are
free parameters of the fit. Due to the very limited phase space
available in the decay, there is a significant
overlap between the two processes and . We also include amplitudes and to
account for possible contributions in the channel from
scalar and tensor states, respectively.
Inclusion of the state is necessary in order to describe
the prominent structure in the spectrum for the
final state around (see
Fig. 4). We also find that the addition of the
gives a better description of the data at
and drastically improves the fit likelihood
values. We use a Breit-Wigner function to parameterize the
and a coupled-channel Breit-Wigner (Flatte)
function [8] for the . The mass and the width of
the state are fixed at their world average
values [9]; the mass and the coupling constants of the
state are fixed at values defined from the analysis of
: MeV/, ,
[10].
Following suggestions given in Refs.[11] and
references therein, the non-resonant amplitude has been
parameterized as
(4)
where ( is not an independent variable and can
be expressed via and but we use it here for clarity),
, , and are free parameters of the fit (with an exception of the
channel as described below).
The logarithmic likelihood function is then constructed
as
(5)
where folded with the detector
resolution function (5.6 MeV/ for ; the
resolution is better and is not taken into account since no narrow
resonances are observed in the system), and
is a fraction of signal events in the data sample.
Both and are corrected for reconstruction
efficiency.
Figure 4: Comparison of fit results (open histogram) with
experimental data (points with error bars) for events in the , and signal
regions. The hatched histogram shows the background component.
In the fit to the sample, the amplitudes and phases of all
of the components are allowed to float. However, in the cases of
and the available phase space is significantly
smaller and contributions from the and are
not well defined. Thus, in the fit to the and
signal samples, we fix the amplitudes and relative phases of these
components to the values measured in the fit to the sample.
Moreover, in the fit to the sample, we also fix the
and parameters of the amplitude. Possible effects of these assumptions are considered
while determining the model-dependent uncertainty. Results of the
fits to signal events are shown in
Fig. 4, where one-dimensional projections of the
data and fits are compared. To combine and events
we plot mass distributions in terms of
and ; fits are performed in terms of
and . Results of the fits are summarized in
Table 1. We try various alternative models to
parameterize the decay amplitude as described in the systematic
uncertainty section. The combined statistical significance of the
two peaks exceeds 10 sigma for all tested models and for all
channels.
Table 1: Comparison of results on and parameters
obtained from () and
() analyses. Quoted values are in MeV/ for masses, in
MeV for widths and in degrees for the relative phase. Relative
amplitude is defined as .
Final state
Rel. amplitude
Rel. phase,
4 Discussion and Conclusions
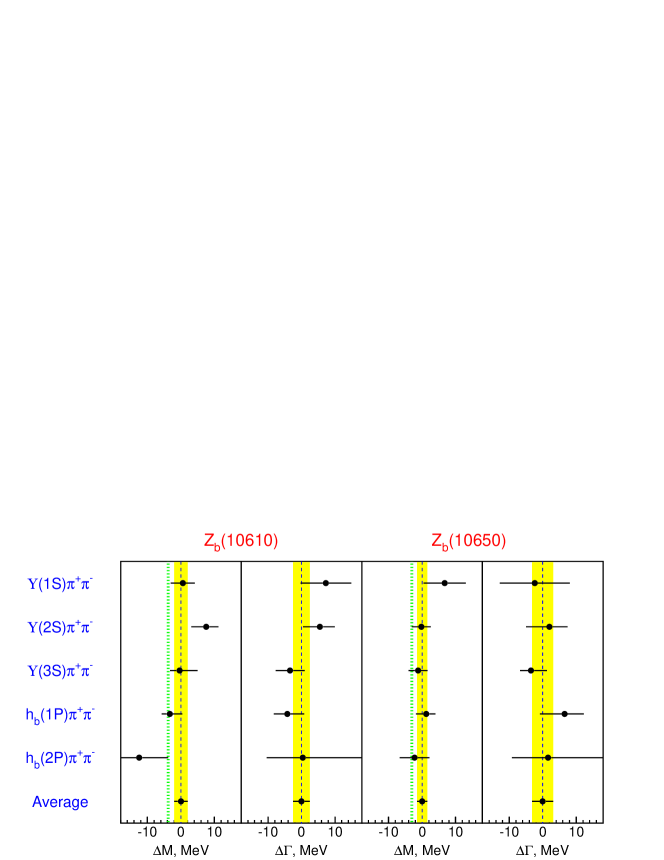
Figure 5: Comparison of and parameters
obtained from different decay channels. The vertical dotted lines
indicate and thresholds.
In conclusion, we have observed two charged bottomonium-like
resonances, the and , with signals in five different
decay channels, () and ().
Parameters of the resonances as measured in different channels are
summarized in Table 1. All channels yield consistent
results as can be seen in Fig. 5. A simple weighted
averages over all five channels give
,
and
,
, where statistical and
systematic errors are added in quadrature.
The measured masses of these states exceed by only a few MeV/
the thresholds for the open beauty channels
( MeV) and ( MeV). This
“coincidence” can be explained by a molecular-like type of new
states, i.e., their structure is determined by the strong
interaction dynamics of the and meson pairs [12].
The widths of both states are similar and are of the order of
. The production rate is similar to the
production rate for every decay channel. Their relative phase is
consistent with zero for the final states with the and
consistent with 180 degree for the final states with the .
The decays seem to be saturated by the and
intermediate states; this decay mechanism is responsible for
the high rate of the process measured recently by
the Belle Collaboration.
Analysis of angular distributions for charged pions [6]
favors the spin-parity assignment for both and
. Since the has negative G-parity, states
will have opposite G-parity due to emission of the pion.
References
[1] K.-F. Chen et al. (Belle Collaboration),
Phys. Rev. Lett. 100, 112001 (2008).
[2] R.E. Mitchell, arXiv:1102.3424v1.
[3] A. Abashian et al. (Belle
Collaboration), Nucl. Instrum. Methods Phys. Res., Sect. A 479, 117 (2002).
[4] S. Kurokawa and E. Kikutani, Nucl. Instrum. Methods
Phys. Res. Sect., A499, 1 (2003), and other papers included in
this Volume.
[5]I. Adachi et al. (Belle Collaboration)arXiv:1103.3419.
[6] I.Adachi et al. (Belle Collaboration)
arXiv:1105.4583.
[7] T. Skwarnicki, Ph.D. Thesis, Institute for Nuclear Physics,
Krakow 1986; DESY Internal Report, DESY F31-86-02 (1986).
[8]
S.M. Flatté, Phys. Lett. B 63, 224, (1976).
[9] K. Nakamura et al. (Particle Data Group),
J. Phys. G 37, 075021 (2010).
[10] A. Garmash et al. (Belle Collaboration),
Phys. Rev. Lett. 96, 251803 (2006).