Departmento de Física de la Materia Condensada, Universidad de Zaragoza, 50009 Zaragoza (Spain)
Departamento de Matemáticas, Universidad Carlos III, 28911 Leganés, Madrid (Spain)
Structures and organization in complex systems Dynamics of evolution Social and economic systems
Disentangling Social and Group heterogeneities:
Public Goods games
on Complex Networks
Abstract
In this Letter we present a new perspective for the study of the Public Goods games on complex networks. The idea of our approach is to consider a realistic structure for the groups in which Public goods games are played. Instead of assuming that the social network of contacts self-defines a group structure with identical topological properties, we disentangle these two interaction patterns so to deal with systems having groups of definite sizes embedded in social networks with a tunable degree of heterogeneity. Surpisingly, this realistic framework, reveals that social heterogeneity may not foster cooperation depending on the game setting and the updating rule.
pacs:
89.75.Fbpacs:
87.23.Kgpacs:
89.65.-s1 Introduction
The last few years have witnessed the success of the application of physical techniques and concepts to social systems [1]. One topic that has attracted a considerable amount of attention is the evolutionary dynamics [2, 3] of social dilemmas [4]: Situations in which an individually desirable outcome leads to an undesirable one from a societal viewpoint. A particularly important paradigm in this class is the tragedy of the commons [5] or, as it is more generally known, the Public Goods game [6, 7]. In a Public Goods game (PGG), altruist or cooperative individuals in a group of people contribute an amount (ÒcostÓ) to the public good; selfish people or defectors do not contribute. The total contribution is multiplied by an enhancement factor and the result is equally distributed between all members of the group. Hence, defectors get the same benefit of cooperators at no cost, i.e., they free-ride on the cooperatorsÕ effort. The dilemma then arises as nobody has any incentive to contribute to the public good, and therefore nobody receives any benefit. A number of hypotheses have been put forward to explain why people might eventually contribute to a public good, including reputation, punishment, beliefs and other factors [8, 9].
One of such hypotheses is of particular relevance for our research, namely, that contributions to a public good are enhanced by the assortment of individuals. This implies that contributors interact mostly with other contributors and therefore end up doing better than free-riders. There are several roads to assortment but prominent among them is the existence of a social network that dictates who interact with whom. This proposal, originating [10] on work on another paradigm, the Prisoner’s Dilemma [11], has given rise to an explosion of research on evolutionary game theory on graphs [12, 13]. For the specific context of the PGG, the issue was considered by Brandt et al. [14], whose numerical simulations indicated that local interactions can foster contribution, even for values of well below the critical value (above this threshold contributing is obviously always the best option). While this result was obtained on an hexagonal lattice, subsequent research [15, 16] generalized it to other lattices as well as to heterogeneous scale-free (SF) [17] networks.
Within the above context, and following the seminal work by Santos et al. [16] about the PGG on top of complex networks, it is widely accepted that SF topologies enhance considerably the emergence of cooperation as it was previously observed for the Prisoner’s Dilemma game [18, 19]. In the case of the PGG [16] it is assumed that each of the groups in which the game is played is automatically defined by considering each player and all of her neighbors in the network. Following this recipe, several mechanisms aimed at further enhancing cooperation on SF networks have been investigated [20, 21, 22, 23, 24, 25, 26, 27]. However, the structure of most real networks [28] reveals that the above assumption about the structure of the interaction groups does not hold. On the contrary, most real interaction networks comprise many small modules of densely interconnected nodes in which group interactions take place. More importantly, these small modules tend to overlap only slightly [29], so that a given node rarely involves all its social acquaintances when collaborating in one groupal task. Therefore, the existing works on the PGG on networks have neglected the role of the mesoscale patterns, i. e., the groups in which the PGG is played.
The aim of this Letter is to use the PGG to gain knowledge on the effects of social heterogeneity (that arising when looking at the number of social contacts of nodes) when the mesoscale structure of small interaction modules is incorporated. Recent work by us [30] hints that the fostering of cooperation observed on heterogeneous networks may be different depending on whether the mesoscopic structure of real collaboration networks is incorporated or not. Thus, the question arises naturally as to what are the effects of social heterogeneity when a mesoscale structure is incorporated in synthetic models of homogeneous (Erdös-Rényi [17]) and heterogeneous SF networks. Thus, the answer to this question allows to disentangle the influence of social heterogeneity from that imposed to the group structure in [16]. Surprisingly, our results show that cooperation is not an increasing function of social heterogeneity. On the contrary, an homogeneous social structure may lead to larger levels of cooperation depending on the game setting and the updating rule at work. We believe that this is an important contribution to both evolutionary games on graphs and dynamics involving group interactions on networks, in so far as data on social collaborations very often reveals a rather homogenous group structure embedded in heterogeneous social networks.
2 Interaction networks and group structure
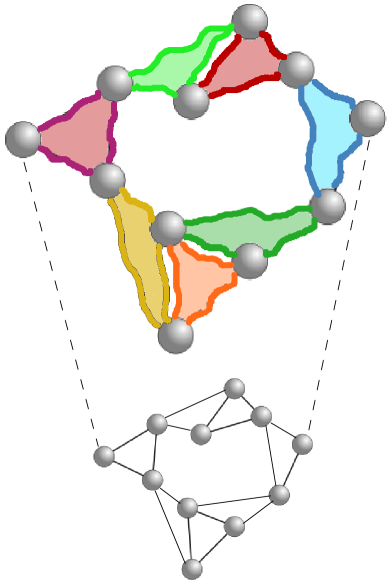
Let us start by introducing the complex networks in which the evolutionary dynamics of the PGG will be implemented. In Fig. 1 we show a model network composed of individuals with a complex interaction backbone. The complex interaction backbone described by the connections among pairs of nodes appears as the projection of the seven interaction groups highlighted in Fig. 1. Each of these groups comprises three individuals and represents the interaction groups in which collaborative tasks take place. It is evident that the set of groups is enough to define univocally the resulting complex backbone of interactions. However, the information provided solely by the projected network does not allow to recover the groups in which each individual has been involved to produce the final topology.
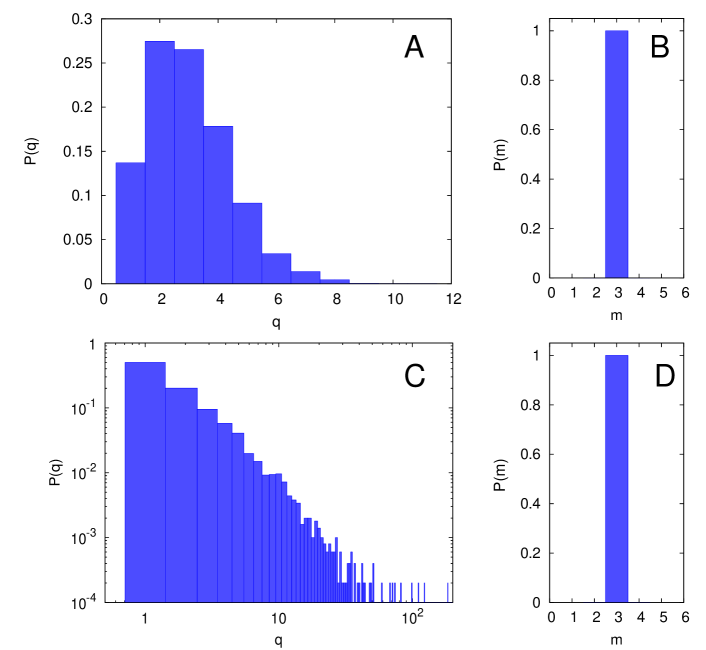
The above example highlights that any dynamical process involving group interactions, such as the PGG, cannot be treated from the macroscopic interaction backbone but it demands to incorporate the mesoscopic patterns arising from the integration of all the interaction groups. To this aim, it is useful to represent the system as a bipartite network [31] in which two types of nodes coexist: individuals and groups. The bipartite nature of a system such as the one shown in Fig. 1 is characterized by two distributions: (i) the probability that an individual participates in groups, , and (ii) the probability that individuals take part of one group, . In order to construct such bipartite graphs we will consider a method of network generation inspired in a model [32] aimed at mimicking the structure of scientific collaboration networks. Inspired in this context, where the interaction groups represent co-authored articles, and also in real collaboration data [33, 34, 35], we consider the size of the groups to be small and homogeneous (note that in Fig. 1).
As in [32], the construction of our networks relies on an iterative process in which interaction groups are created sequentially starting from an initial core of individuals (that by itself constitutes the first group of the system) and a set of unconnected individuals. At each step of the process, a new individual from the unconnected set defines a new group of size by choosing its partners among the remaining individuals in the system. In order to generate a family of networks interpolating between homogeneous and heterogeneous topologies we adopt a similar strategy to that of the model introduced in [36]. For each of its choices, the newcomer assigns a probability to the other nodes. With probability the newcomer makes the choice completely random so that the probability that a node is selected by the newcomer is . On the other hand, with probability , the newcomer selects a partner proportionally to the number of groups belongs to, , so that . When the newcomer has selected partners, the new group is constituted. This process is iterated times so that the final network is composed of groups and individuals. In our case we will fix .
Obviously, when the network groups are always formed following a random selection rule so that the final probabilty that a node participates in groups follows a Poisson distribution centered around (see Fig. 2.A for which ) similarly to Erdös-Rényi (ER) graphs. Alternatively, when the group structure is created by means of a preferential choice so that the probability follows a scale-free (SF) distribution, with mean (see Fig. 2.C). Let us recall that these two topologies are homogeneous (ER) and heterogeneous (SF) only from the point of view of the number of groups each individual participates in, i.e., regarding the social structure. However in both topologies the group structure is homogeneous, so that is a delta function centered around (see Fig. 2.B and 2.D). Let us note that the projected versions of the bipartite networks constructed with and correspond to SF and ER networks respectively. In the remainder of the Letter we will focus on these two limiting cases (ER and SF) in order to unveil the effects that social heterogeneity [as described by ] has on the evolution of cooperation.
Having set the network structure we encode it by means of a biadjacency matrix [with and ] so that if agent participates in group and otherwise. With this topological information one can define the dynamics of the PGG as follows. At each time step , each individual plays a round of the PGG within each of the groups it is engaged to. Obviously, the benefit obtained in each of these games depends on the strategies of the agents participating in each group. If we denote by the strategy of agent during round of the PGG, so that when plays as cooperator and when defects, the overall benefit after playing round of the PGG reads:
| (1) |
where is (as defined above) the number of groups in which is engaged and accounts for the cost payed by agent in each of her groups when playing as cooperator. We will study two formulations of the PGG (as defined in [16]). First, we consider a fixed cost per game (FCG) formulation so that each cooperator invests a fixed cost in each of the groups she participates in. Alternatively, we will also study the situation of fixed cost per individual (FCI). In this latter scenario, a cooperator invests a total amount that is equally distributed among all her groups so that
Once a round of the PGG is played, every agent updates her strategy. We will focus now in the replicator update rule as used in [16]. In this framework each agent chooses randomly one of her partners, say , and compares their benefits in the last round of the game. If nothing happens and stays the same in the next round, . However, when agent will take the strategy of () with probability:
| (2) |
where is a normalization term that accounts for the difference between the maximum possible payoff of and and the minimum one. Thus, to compute one must calculate first the maximum and the minimum payoff each individual can obtain, and use these values, and , to compute the correct associated to each couple of nodes. In the case of the PGG with FCG we can take advantage of the fixed size of the groups to derive analitically the value of as a function of the number of groups each of the two nodes, say and , belongs to. In particular, when the we obtain:
| (3) |
while for the expression for reads:
| (4) |
For the case of FCI, it is not possible to derive as a function of and and one must compute the maximum payoff for each node. This maximum payoff reads:
| (5) |
On the contrary, the minimum possible payoff of a node in the FCI formulation does not the depends on the properties of the node: . Finally, let us note that the group structure plays no role in this update stage, as it makes use of the (projected) network of contacts.
3 Homogeneous vs Heterogenous networks
We now focus on the evolution of the cooperation for networks with homogeneous group structure and either SF or ER social patterns. To this end we simulate the evolutionary dynamics of the PGG from an initial condition in which the number of defectors and cooperators is roughly the same and they are randomly distributed across the network. For each value of the normalized enhancement factor , we iterate a large number of rounds of the PGG (typically ) and we measure the average fraction of cooperators, , over a time window of additional rounds. The results reported for each value of are the average over different initial conditions.
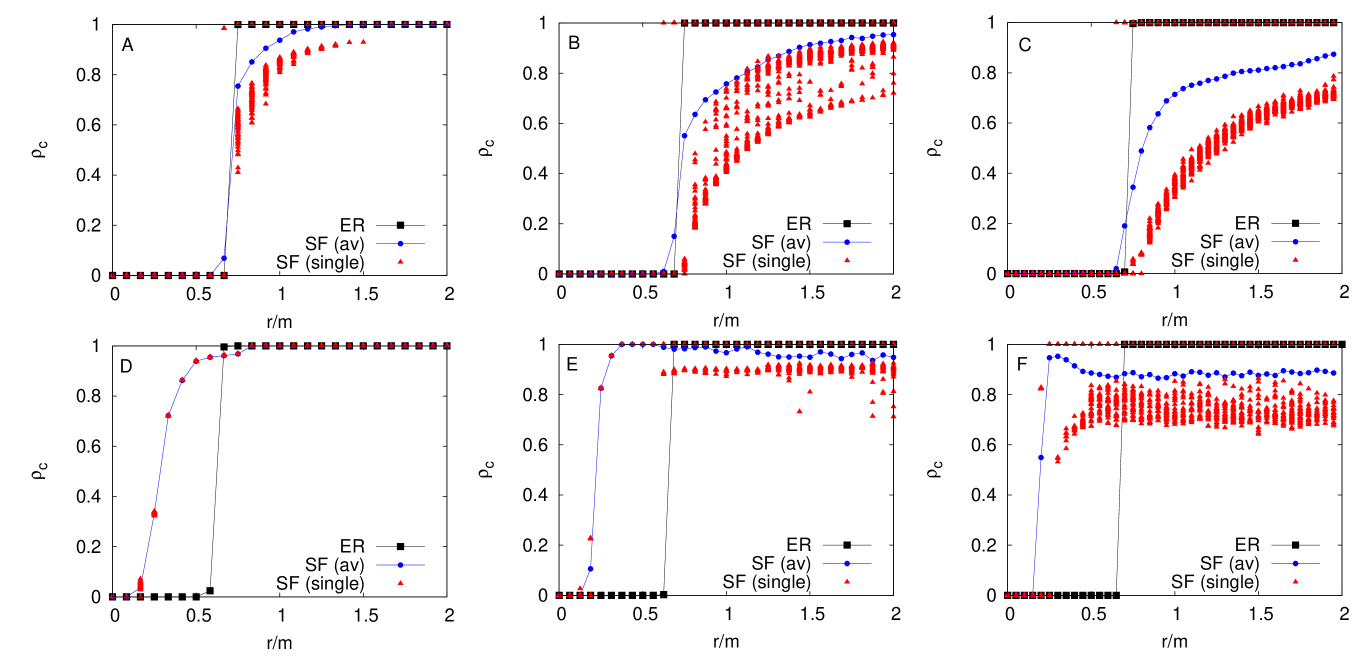
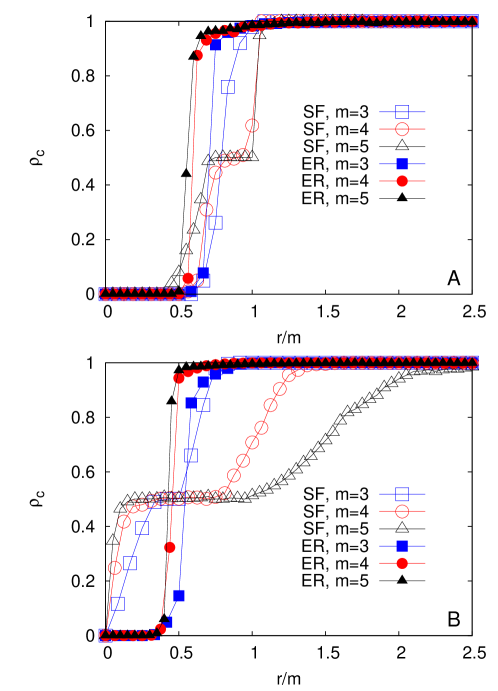
In the top panels of Fig. 3 we show the evolution of as a function of for the PGG in its FCG version. Each of the plots corresponds to a different value of , namely in Fig. 3.A, in Fig. 3.B and in Fig. 3.C, and all them show the curves for both ER (filled squares) and SF (filled circles) topologies. The main finding is that the average level of cooperation achieved on ER substrates is remarkably larger than those observed on SF architecctures. Specifically, while the onset of cooperation occurs around the same value (regardless of the value of ) for both ER and SF substrates, the sharp boost in the cooperation of ER networks is in contrast of the slow increment observed for SF networks, particularly for and . This striking result points out that the ability of SF to outperform the promotion of cooperators on ER networks reported in [16] is intrinsically due to the entanglement of social and group heterogeneities (in [16] the associated distribution of group sizes in SF networks is , being the same exponent of the degree distribution of the SF network of contacts). In our setting, the discrimination of social and group heterogeneities in SF networks and the addition of a realistic group architecture leads to a dramatic change in the ability of heterogeneous networks to foster cooperation.
The differences in the average level of cooperation are not the unique difference between homogeneous and heterogeneous networks. In the panels of Fig. 3 we show the values reached by in each of the realizations for SF networks. It is clear that, after the cooperation onset, , some of the realizations reach full cooperation while others end up in a dynamical equilibrium in which cooperators and defectors coexist. Note also that the value of associated to those solutions displaying coexistence decreases significantly with . On the other hand, ER networks always lead to fixation, i.e., the dynamics always reaches one absorbing state (either full defection or full cooperation).
The results obtained with the FCI formulation are shown in the bottom panels of Fig. 3. This scenario turns out to favor the emergence of cooperation on SF networks since its onset anticipates significantly with respect to the FCG formulation (note that for all the values of ). On the contrary, for ER the onset of cooperation takes place at the same value of as in the FCG formulation. The enhancement shown by SF networks is clearly due to the fact that in the FCI setting cooperators pay the same cost regardless the number of groups they belong. This equivalence among degree-classes allows cooperator hubs to collect more payoff while, for defector hubs, the change from FCG to FCI does not represent any improvement. On the other hand, the dynamical differences between SF networks and ER networks persist since SF allows coexistence of cooperators and defectors while ER do not. Moreover, as grows the frequency of the solution displaying coexistence increases and for large values of the average value of is lower than that reached by ER networks for and . Therefore, in the FCI setting, when both the size of the groups and the degree of enhancement increase, ER substrates outperform the ability of SF networks to sustain cooperation.
4 Other update rules
To complete our study, let us now analyze the PGG with two other update rules, namely, Moran selection and Unconditional Imitation (UI). In the first case, a Moran agent chooses one neighbor proportionally to her payoff (not randomly as in the Replicator case). Then, agent copies the strategy of agent for the next round, , even if has performed worse than []. Therefore, the probability that takes the strategy of reads:
| (6) |
where the symbol means that the sum is over the partners of . Note that, at variance with the Replicator rule, Moran selection allows mistakes. In the setting of UI the strategy update is done as follows. After every round each agent imitates the neighbour with the largest payoff, provided it is larger than her own. Thus, at variance with Moran selection and the Replicator update, UI is a completely deterministic rule while UI (as the Replicator rule) does not allow mistakes. Note also that both Moran and UI are context-focused rules (agents look at all their partners), while the Replicator update is link-focused (agents look one randomly chosen partner).
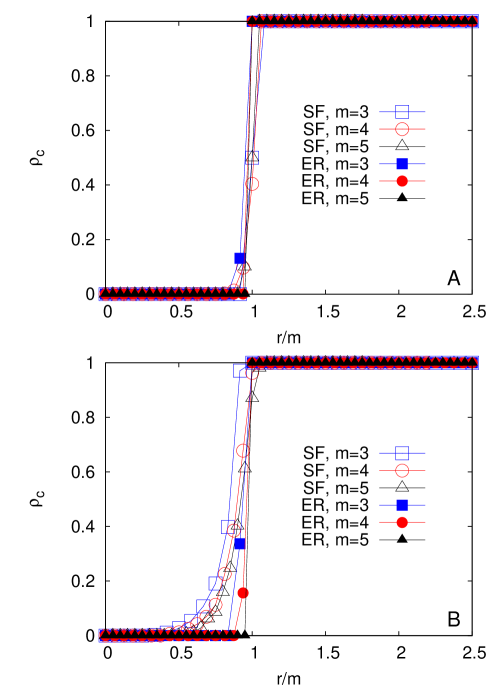
In Fig. 4 the results obtained with the Moran update are shown. It is worth noticing that in FCG version (top panel), there is no difference at all in behavior between SF and ER, while in FCI (bottom panel) the onset of cooperation appears earlier in heterogeneous SF networks, as with the Replicator rule, but in here the differences are not as pronounced as in the former case. Therefore, under Moran selection the degree of heterogeneity of social interactions plays little role in the promotion of cooperation. In Fig. 5 we show the behavior of systems with UI update rule. For the FCG situation (top panel) the cooperation onset of SF and ER occurs simultaneously (around ). However, ER reaches full cooperation faster. In this sense, for this cost scheme and under UI, ER promotes cooperation better than SF (as in the Replicator case). On the other hand, for the PGG with FCI (bottom panel) cooperation on SF networks rises suddenly from (even earlier than in the Replicator case); however, the ER network reaches full cooperation much before than SF, particularly for and . Interestingly, a plateau around appears in both FCG and FCI cases for the SF network. For such values of where the plateau is observed the evolutionary dynamics ends up suddenly (few generations after the initial condition) reaching either a full cooperation or a full defection state. Thus, the final outcome depends strongly on the initial configuration of strategies so that for a large number of realizations . We believe that this is connected to the initial distribution of strategies in the hubs as under this update scheme their behavior is very determinant for the rest of the network.
5 Conclusions
The work reported here allows us to draw two important conclusions. First, the enhancement of cooperation observed in PGG on SF networks with respect to ER networks does not appear when taking into account the details of the group structure of the population. This is clearly so in the FCG scheme, while under FCI we observe that cooperation sets on quite earlier but as the group size increases it becomes more difficult to reach full cooperation. Second, SF and ER networks behave differently depending on the evolutionary dynamics under consideration. Thus, the above comments apply to Replicator dynamics, but Moran selection gives rise to basically similar behavior on both types of networks and UI reverses the Replicator dynamics outcome, with SF networks performing worse in general than ER networks. Therefore, as has been shown for other social dilemmas [13], the outcome of a PGG on a network is far from universal and depends on the network structure, on the evolutionary dynamics and on the (mesoscale) group structure, a novel factor arising from the game itself. We believe that this conclusion has far reaching implications, the most important one being the relevance of the network hierarchical structure for the emergence of cooperation in a multi-player setup. Indeed, our results strongly indicate that when trying to model cooperative behavior, the outcome of the model may depend very much on this mesoscale structure which, in turn, are almost always determined by the kind of function or cooperative enterprise the agents are involved in. In this context, it becomes apparent that disentangling the scales associated to the different types of relationships between the agents is crucial in order to understand the observations in different social contexts.
Acknowledgements.
J. G.-G. is supported by the MICINN through the Ramón y Cajal program and grants FIS2008-01240 and MTM2009-13838. D. V. is supported in part by a postdoctoral contract from Universidad Carlos III de Madrid. A. S. was supported in part by grants MOSAICO and Complexity-NET RESINEE (Ministerio de Ciencia e Innovación, Spain) and MODELICO-CM (Comunidad de Madrid, Spain).References
- [1] \NameCastellano C., Fortunato S. Loreto V. \REVIEWRev. Mod. Phys. 812009591.
- [2] \NameHofbauer J. Sigmund K. \BookEvolutionary Games and Population Dynamics (Cambridge University Press, Cambridge) 1998.
- [3] \NameNowak M. A. \BookEvolutionary dynamics: exploring the equations of life (The Belknap Press of Harvard University Press, Cambridge) 2006.
- [4] \NameKollock P. \REVIEWAnnu. Rev. Sociol. 241998183.
- [5] \NameHardin G. \REVIEWScience16219681243.
- [6] \NameOlson M. \BookThe logic of collective action (Harvard University Press, Harvard) 1965.
- [7] \NameOstrom E. \REVIEWJ. Econ. Perspec.142000137.
- [8] \NameGlance N. S. Huberman B. A. \REVIEWScientific American270199476.
- [9] \NameSigmund K. \BookThe Calculus of Selfishness (Princeton University Press) 2010.
- [10] \NameNowak M. A. May R. M. \REVIEWNature3591992826.
- [11] \NameAxelrod R. \BookThe Evolution of Cooperation (Basic Books, New York) 1984.
- [12] \NameSzabó G. Fáth G. \REVIEWPhys. Rep.446200797.
- [13] \NameRoca C. P., Cuesta J. Sánchez A. \REVIEWPhys. Life Rev.62009208.
- [14] \NameBrandt H., Hauert C. Sigmund K. \REVIEWProc. R. Soc. London B27020031099.
- [15] \NameHauert C. Szabó G. \REVIEWComplexity8200331.
- [16] \NameSantos F. C., Santos M. D. Pacheco J. M. \REVIEWNature4542008213.
- [17] \NameBocaletti S., Latora V., Moreno Y., Chavez M. Hwang D. U. \REVIEWPhys. Rep.4242006175.
- [18] \NameSantos F. C. Pacheco J. M. \REVIEWPhys. Rev. Lett.95200598104.
- [19] \NameGómez-Gardeñes J., Poncela J., Floría L. M. Moreno Y. \REVIEWJ. Theor. Biol.2532008296.
- [20] \NameRong Z. Wu Z.-X. \REVIEWEPL87200930001.
- [21] \NameLei C., Wu T., Jia J.-Y., Cong R. Wang L. \REVIEWPhysica A38920104708.
- [22] \NameCao X.-B., Du W.-B. Rong Z.-H. \REVIEWPhysica A38920101273.
- [23] \NameShi D.-M., Zhuang Y. Wang B.-H. \REVIEWEPL90201058003.
- [24] \NameLiu R.-R., Jia C.-X. Wang B.-H. \REVIEWPhysica A38920105719.
- [25] \NamePeng D., Yang H. X., Wang W. X., Chen G. R. Wang B. H. \REVIEWEur. Phys. J. B732010455.
- [26] \NameYang H.-X., Wang W.-X., Wu Z.-X., Lai Y.-C. Wang B.-H. \REVIEWPhys. Rev. E792009056107.
- [27] \NameZhang H., Yang H., Du W., Wang B. Cao X. \REVIEWPhysica A38920101099.
- [28] \NameAhn Y.-Y., Barrow J. C. Lehman S. \REVIEWNature4662010761.
- [29] \NamePalla G., Derényi I. Vicsek T. \REVIEWNature4352005814.
- [30] \NameGómez-Gardeñes J., Romance M., Criado R., Vilone D. Sánchez A. \REVIEWCHAOS212011016113.
- [31] \NameGómez-Gardeñes J., Latora V., Moreno Y. Profumo E. \REVIEWProc. Natl. Acad. Sci. USA 10520081399.
- [32] \NameRamasco J., Dorogovtsev S. Pastor-Satorras R. \REVIEWPhys. Rev. E702004036106.
- [33] \NameNewman M. \REVIEWProc. Nat. Acad. Sci. USA702001404.
- [34] \NameNewman M. \REVIEWPhys. Rev. E642001016131.
- [35] \NameNewman M. \REVIEWProc. Nat. Acad. Sci. USA10120045200.
- [36] \NameGómez-Gardeñes J. Moreno Y. \REVIEWPhys. Rev. E732006056124.