The Evolution of Ly Emitting Galaxies Between and
Abstract
We describe the results of a new, wide-field survey for Ly emission-line galaxies (LAEs) in the Extended Chandra Deep Field South (ECDF-S). By using a nearly top-hat 5010 Å filter and complementary broadband photometry from the MUSYC survey, we identify a complete sample of 141 objects with monochromatic fluxes brighter than ergs cm-2 s-1 and observers-frame equivalent widths greater than Å (i.e., 20 Å in the rest-frame of Ly). The bright-end of this dataset is dominated by x-ray sources and foreground objects with GALEX detections, but when these interlopers are removed, we are still left with a sample of 130 LAE candidates, 39 of which have spectroscopic confirmations. This sample overlaps the set of objects found in an earlier ECDF-S survey, but due to our filter’s redder bandpass, it also includes 68 previously uncataloged sources. We confirm earlier measurements of the LAE emission-line luminosity function, and show that an apparent anti-correlation between equivalent width and continuum brightness is likely due to the effect of correlated errors in our heteroskedastic dataset. Finally, we compare the properties of LAEs to LAEs found at . We show that in the Gyr after , the LAE luminosity function evolved significantly, with fading by mag, the number density of sources with ergs s-1 declining by , and the equivalent width scale-length contracting from Å to Å. When combined with literature results, our observations demonstrate that over the redshift range to , LAEs contain less than of the star-formation rate density of the universe.
1 Introduction
In the local universe, relatively few galaxies have Ly present in emission (Deharveng et al., 2008; Cowie et al., 2010). This is simply due to the nature of the line: since Ly involves the ground state of hydrogen, each photon must resonantly scatter many times before escaping into intergalactic space. As a result, even a small amount of dust can quench the emission leaving the galaxy.
In the high-redshift universe, however, the presence of Ly emission is common. Surveys of Lyman break galaxies (LBGs) have demonstrated that roughly half of these bright, high-mass systems have Ly visible in emission (Shapley et al., 2003; Reddy et al., 2008). Moreover, lower-mass Ly emitting objects with extremely high mass-specific star-forming rates exist in large numbers (Gawiser et al., 2006a, 2007; Ouchi et al., 2008). These Ly emitters (LAEs) are an important constituent of the high-redshift universe. Not only do LAEs sample a wider range of the galaxy luminosity function than LBGs, but they are also more amenable to spectroscopy. Consequently, LAEs are powerful probes of large scale structure, and perhaps the best tracers we have for the signature of baryonic acoustic oscillations. In fact, LAEs are the targets of the Hobby-Eberly Telescope Dark Energy Experiment (Hill et al., 2008), a Stage III Dark Energy project (Albrecht et al., 2006) which will survey the universe between .
Unfortunately, we do not yet have a clear understanding of the global properties of LAEs. Although their space density, luminosity function, and equivalent width distribution are known at redshifts , the evolution of these properties towards lower redshifts is uncertain. For instance, the results of a intermediate-bandpass (FWHM = 130 Å) survey with the ESO 2.2-m telescope (Nilsson et al., 2009a) imply that LAEs become rarer and redder by , but the double-blind VLT observations of Ly and H emission argue otherwise (Hayes et al., 2010). Similarly, while the analysis of Nilsson et al. (2011) suggests that the mean stellar mass of LAEs becomes greater at lower redshift, a comparison of narrow-band selected LAE samples at (Gawiser et al., 2007) and Guaita et al. (2011) show no evolution in mass.
Here we present the results of a new narrow-band survey for LAEs in the Extended Chandra Deep Field South (ECDF-S). In §2, we describe our observations, review the techniques used to detect emission-line galaxies, and give a list of LAE candidates, 130 of which are members of a statistically complete sample with Ly fluxes greater than ergs cm-2 s-1 and rest-frame equivalent widths greater than 20 Å. In §3, we present the LAE luminosity function and show the distribution of Ly equivalent widths as a function of line luminosity and continuum luminosity. In §4, we compare these functions to those of the sample of objects obtained by Guaita et al. (2010). We show that there has been significant evolution between the two epochs in , the characteristic emission-line luminosity of the Schechter (1976) function, , the integrated number density of bright LAEs, and , the e-folding scale length of the rest-frame equivalent width distribution. In §5, we examine the LAEs’ star-formation rates, using both their rest-frame UV emission and Ly, and in §6, we compare the star-formation rate density of the LAE population with that of the universe as a whole. We conclude by summarizing our results and arguing that LAEs represent the extreme low-metallicity, low-extinction, faint-end tail of the high-redshift star-forming galaxy population.
For this paper, we assume a CDM cosmology, with , and km s-1 Mpc-1.
2 The Sample
The luminosity function and equivalent width distribution of LAEs is fairly well-known from the narrow-band surveys of Gronwall et al. (2007, hereafter Gr07) and Ouchi et al. (2008). However these observations, which have identified more than 200 LAE candidates with little contamination from foreground objects, suffer from larger than normal photometric uncertainties due to the Gaussian-like transmission profiles of their narrow-band filters. To confirm these results, and to increase the survey sample at , we extended the Gr07 study by re-imaging the ECDF-S, this time with a 57 Å full-width-half-maximum (FWHM) nearly top-hat filter centered near 5010 Å. As with Gr07, the data were collected with the MOSAIC II CCD camera on the CTIO Blanco 4-m telescope, and consisted of a set of 47 images taken in seeing for a total narrow-band exposure time of 15.67 hr. A log of the observations is given in Table 1; a figure showing our filter’s transmission curve, compared to that used by Gr07, appears in Figure 1.
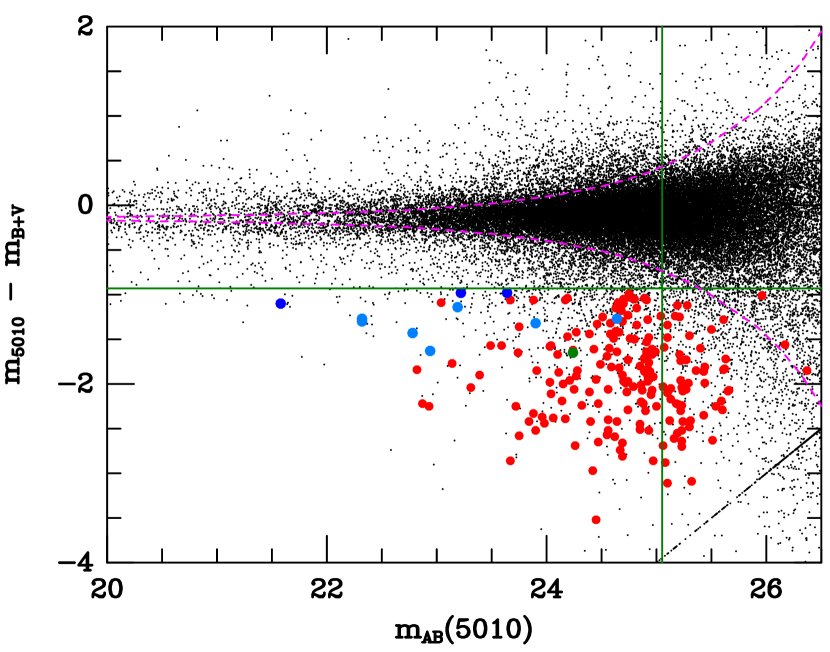
The procedures used to reduce the data, identify line emitters, and measure LAE brightnesses were identical to those used by Gr07 and discussed in detail by Feldmeier et al. (2003). After de-biasing, flat-fielding, and aligning the data, we co-added our narrow-band frames to create a master image that was clipped of cosmic rays. This frame was then compared to a deep + continuum image provided by the MUSYC collaboration (Gawiser et al., 2006b), and the routines of DAOPHOT were used to create a color-magnitude diagram of all sources found on the narrow-band image. Objects with narrow-band minus continuum colors less than 0.93 mag in the AB system were flagged as possible emission-line sources (see Figure 2). Then, to detect those LAEs whose photometry was compromised by object blending, sky gradients, and/or source confusion, we re-ran our detection algorithm on a “difference” frame made by subtracting a scaled version of the + continuum image from the narrow-band frame. In this case, our detection algorithm was set to flag all objects brighter than four times the standard deviation of the local sky. This difference technique produced a sample of several thousand additional candidates, most of which were below our equivalent width threshold. However, when the weak emission-line sources were excluded, the result was a sample of objects that was larger than that produced by the two-color method alone.
For both detection algorithms, we intentionally biased our parameters to identify faint sources at the expense of false detections (i.e., we introduced Type I errors into our dataset). To compensate for this, we visually inspected each candidate, both on the co-added narrow-band and broadband frames, and on sub-samples of the original images. This step excluded most of the false positives, which were typically at the frame limit, and artifacts produced by cross-talk associated with the CCD electronics.
To derive the line fluxes and equivalent widths of our LAE candidates, we took advantage of the fact that Gr07 measured the 5000 Å AB magnitudes of several ECDF-S field stars by comparing their large aperture instrumental magnitudes to those of spectrophotometric standard stars (Stone, 1977; Hamuy et al., 1992) taken throughout their survey. To place our new 5010 Å narrow-band observations on the same photometric system, we therefore measured our LAE brightnesses with respect to these same stars. We then converted our narrow-band 5010 AB magnitudes into monochromatic fluxes () by comparing the filter’s integral transmission (which is the relevant quantity for field star photometry) to its monochromatic transmission at the center of the bandpass (see Gr07 and Jacoby et al., 1987). Note that this simple procedure is only exact for top-hat filters where the monochromatic transmission is insensitive to wavelength: as Gr07 showed, observations through filters with a Gaussian-shaped transmission curve require a more sophisticated approach.
Along with monochromatic flux, we also derived photometric equivalent widths for all our LAE candidates by comparing their narrow-band AB flux densities, , to their continuum flux densities, via
| (1) |
where Å approximates the contribution of the galaxy’s underlying continuum within the narrow-band filter’s bandpass. For consistency with Gr07, we then excluded all sources with equivalent widths less than 20 Å in the rest-frame of Ly (approximately 80 Å in the observers frame), and derived equatorial positions for the remaining objects with respect to reference stars in the USNO-B1.0 astrometric catalog (Monet et al., 2003). This left us with a sample of 199 LAE candidates.
To measure the completeness of our sample as a function of magnitude, we followed the procedures described by Feldmeier et al. (2003) and performed a series of artificial star experiments. By adding 1,000,000 stars (2000 at a time) to our narrow-band frame, and re-running our detection algorithms, we were able to compute the flux level below which the object recovery fraction dropped below 90% and 50%. The 90% value, which corresponds to an AB magnitude of , and a monochromatic flux of ergs cm-2 s-1 () is our limiting flux for statistical completeness. A total of 141 objects are brighter than this limit. Those emission-line objects satisfying our 80 Å equivalent width threshold and brighter than our completeness limit are listed in Table 2; additional objects below the completeness limit are given in Table 3. Our estimated photometric errors, as a function of log flux, appear in Table 4.
To confirm the robustness of our measurements, and to double-check the transmission curve of our narrow-band filter, we compared our sample of Ly emitters to the list of LAEs published by Gr07. As Figure 1 shows, the volumes studied in these two surveys have a great deal of overlap: a quick inspection of the two curves suggests that of the LAEs found in our new survey should appear in the Gr07 tables. Indeed, this is the case: of the 199 candidates detected, 80 are present in the previous list of emission-line sources. Moreover, 39 of the objects common to both surveys already have spectroscopic confirmations. In this restricted sample, the lowest redshift object has its emission line at 4981 Å (), where the transmission of our filter falls to roughly 25% of its peak value. Conversely, our highest redshift source has Ly at 5023 Å (), i.e., where the Gr07 filter transmission is of its peak. A comparison of the inferred monochromatic fluxes for this subset of objects, where the wavelength of the Ly emission-line is known, also shows excellent agreement (see Figure 3). This consistency argues that the transmission curves displayed in Figure 1 are accurate, and the photometric errors tabulated in Table 4 are reasonable.
2.1 Chandra, GALEX, and Swift Detections
Figure 4 shows the flux distribution of all our high-equivalent width (EW Å) objects. The most obvious feature is the presence of a small number of sources with monochromatic fluxes brighter than ergs cm-2 s-1. This luminous tail is not nearly as pronounced in the survey of Ouchi et al. (2008), and not visible at all in the Gr07 dataset. A closer examination, however, reveals that many of these extremely bright sources are foreground interlopers.
To show this, we first removed the AGN from our sample by cross-correlating the positions of our LAE candidates with those of the x-ray point sources found in the 2 Msec exposure of the Chandra Deep Field South (Luo et al., 2008) and the four 250 ksec exposures of the Extended Chandra Deep Field South (Lehmer et al., 2005; Virani et al., 2006). Eight spatial coincidences were found, including one for our second brightest source (a AGN which entered our sample due to its strong C III] emission; Balestra et al., 2010), and our third brightest source (which, at , must have been detected due to a change in brightness between the time of our narrow-band and continuum exposures; Szokoly et al., 2004). In fact, at flux levels brighter than , half of our LAE candidates (and the candidates of Gr07) are co-incident with x-ray identified AGN. These contaminants are noted in Table 2.
We next compared our list of LAE candidates to the catalogs of UV sources detected by the GALEX (Schiminovich et al., 2003) and Swift (UVOT; Hoversten et al., 2009) satellites. Both instruments have conducted deep () surveys of the ECDF-S using near-UV (and, for GALEX, far-UV) filters. Since at , the near-UV corresponds to rest-frame wavelengths far beyond the Lyman break, any LAE candidate listed in these catalogs is most likely a foreground contaminant. Our cross-correlation procedure (which used a matching radius of ), produced ten coincidences, including five associated with the x-ray sources described above. Of the remaining objects, the most prominent is our LAE candidate #1, a marginally-resolved galaxy which is nearly a magnitude brighter than any other object in our sample. Fortuitously, this object already has a redshift: spectroscopy by Vanzella et al. (2008) confirms the source to be a galaxy with extremely strong [O II] emission (rest-frame equivalent width EW Å). Although such objects are rare, and none were found in the Gr07 survey, a few are present in the magnitude-limited set of objects defined by Hogg et al. (1998). The other four UV matches include two likely superpositions (i.e., objects containing a more-likely counterpart within the error circle), and two sources with estimated observers-frame equivalent widths (82 Å) barely above our threshold. (The spectroscopy of Le Fèvre et al. (2005) confirms that one of them is foreground.) We identify each of these UV-bright sources in Table 2, but in the analysis that follows, we exclude only the x-ray sources and the three GALEX/Swift-UVOT objects with unambiguously identified counterparts. This leaves us with a statistically complete sample of 130 objects, 39 of which have spectroscopic confirmations.
2.2 X-ray Stacking
By cross-correlating our LAE positions with the x-ray catalog from Chandra, we were able to eliminate bright AGN from our candidate list. This, of course, does not exclude the possibility that many of our LAEs have low-level nuclear activity. To place a constraint on this activity, we performed a stacking analysis on the x-ray data, similar to that described by Brandt et al. (2001). We combined our new LAE dataset with that found by Gr07, excluded the known x-ray sources, and stacked the x-ray signal of all 233 LAEs in the statistically complete samples, using the new 4 Msec exposure of the Chandra Deep Field South and the 250 ksec exposures of the surrounding region. The mean LAE of the resulting Msec effective exposure has an x-ray flux less than counts s-1 in the soft band and counts s-1 in the hard band ( upper limits), implying luminosity limits of ergs s-1 and ergs s-1, respectively. Clearly, few, if any of our LAEs harbor low-luminosity AGN. We also used these data to place a limit on the mean star-formation rate of the LAEs in our sample. Since LAEs all have extremely high mass-specific star-formation rates (Gawiser et al., 2007), the contributions of low-mass x-ray binaries to the total 2 – 10 keV emission of these systems should be negligible. This being the case, our upper limit on the hard x-ray flux from the LAE population yields a star-formation rate of yr-1 or yr-1, depending on whether we use Lehmer et al. (2010) or Persic et al. (2004) for the calibration. Although this value is still several times larger than the star-formation rates derived from the LAE’s rest-frame UV and Ly emission (see §5), the numbers do provide hope that with additional observations, we will be able to detect the x-ray emission from LAE starbursts.
3 The LAE Luminosity Function and Equivalent Width Distribution
Figure 5 displays the distribution of continuum-subtracted Ly emission-line luminosities for our new sample of LAEs. To find the best-fit Schechter (1976) function to these data, we followed the procedures described in detail by Gr07. First, we computed two convolution kernels, one (a Gaussian) representing the photometric uncertainty of our measurements (as a function of magnitude), and the other determined using the derivative of the inverse of the filter transmission function. (This latter kernel does not normalize to one, since it also includes the effect of equivalent width censorship.) We then applied these two kernels to a series of functions of the form
| (2) |
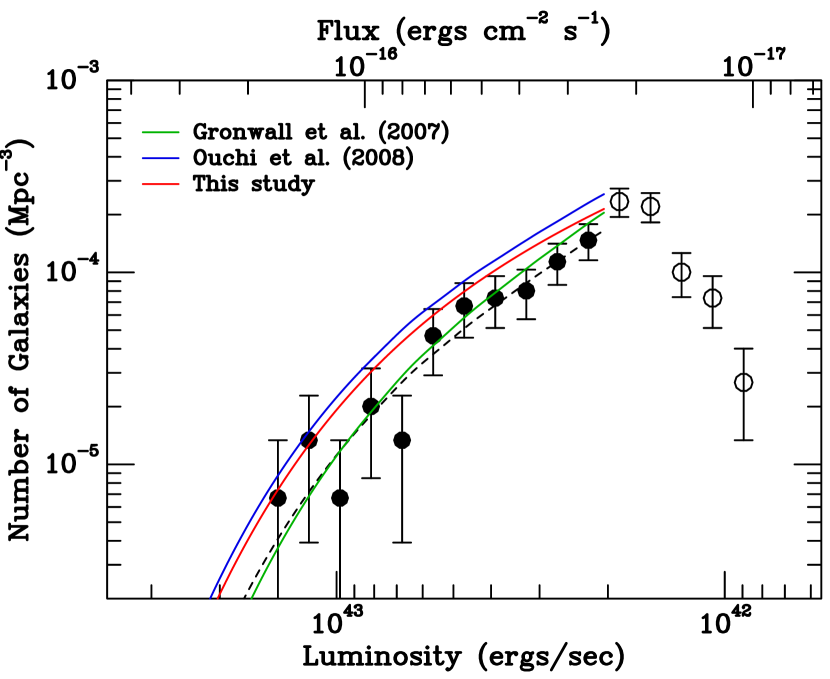
treated each curve as a probability distribution, and computed the likelihood that the observed sample of Ly luminosities could be drawn from that distribution. Figure 5 displays our best-fit function, both before (the dashed line) and after the equivalent-width censorship (solid red line). Also plotted are the best-fit curves for the LAEs found by Gr07 (in green) and Ouchi et al. (2008, in blue). The parameters of these functions are listed in Table 5. Note that for the current study, we have fixed the faint-end slope of our Schechter (1976) function to . This is the most-likely value inferred from the Gr07 data, once continuum subtraction has been applied to their fluxes, and it is also consistent with the recent LAE measurements of Cassata et al. (2011). Since our data are mag shallower than that of Gr07, we adopt their estimate for the faint-end slope.
From the figure, it is immediately obvious that all three luminosity functions are similar, both in shape and in normalization, and all fit the data extremely well. Our most-likely value of is similar to that found by Ouchi et al. (2008) and less than mag brighter than that derived Gr07. Similarly, all three functions imply Mpc-3 for the density of galaxies with rest-frame equivalent widths greater than 20 Å and Ly fluxes greater than ergs cm-2 s-1. Since our new dataset has substantial overlap with that of Gr07, the consistency between these two samples is not surprising. The Ouchi et al. (2008) survey, however, is an independent measurement. Even after we follow their recommendation and increase by to compensate for their higher equivalent width limit, there is still excellent agreement in the functions. This is indicative of the robustness of the results.
3.1 Equivalent Width versus Luminosity
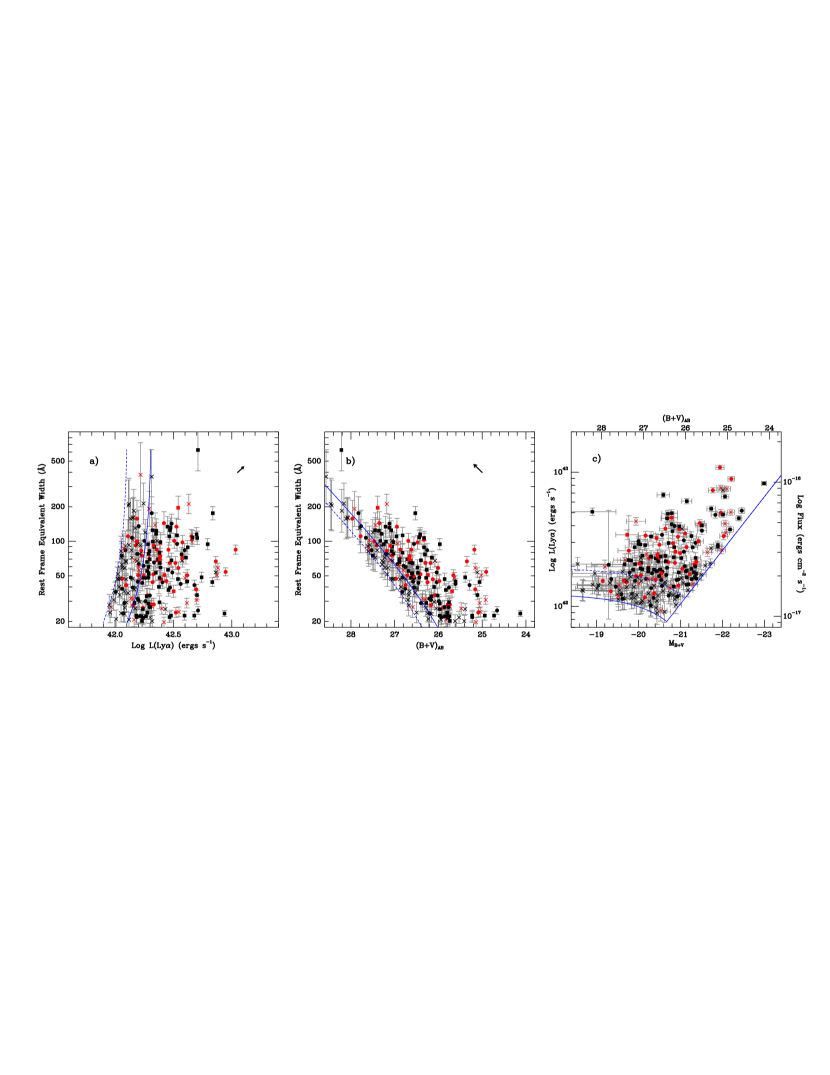
There has been some discussion in the literature concerning the relationship between Ly equivalent width and continuum luminosity in high-redshift galaxies. Starting with Ando et al. (2006), a number of authors have claimed a deficit of continuum bright, high-equivalent width objects, both in samples of Lyman-break galaxies (e.g., Ando et al., 2007; Iwata et al., 2007; Vanzella et al., 2009) and Ly emitters (Ouchi et al., 2008; Shioya et al., 2009). However, Nilsson et al. (2009b), via a series of Monte Carlo simulations, have argued that the observed correlations are not statistically significant, and there is no need to invoke the presence of exotic stellar populations or a clumpy interstellar medium (Ouchi et al., 2008; Mao et al., 2007; Kobayashi et al., 2010). We illustrate the problem in Figure 6. The left panel of the figure shows the LAE equivalent width measurements as a function of (continuum subtracted) Ly luminosity, for both the present sample and the sample of objects found by Gr07. The figure displays no evidence for a shift in the equivalent width distribution as a function of luminosity. A 2-sample Anderson-Darling test (Scholz & Stephens, 1987) which compares the equivalent widths of bright ( ergs s-1) and faint ( ergs s-1) LAEs confirms that there is no significant difference between the two samples. Moreover, if we apply the non-parametric rank-order Efron & Petrosian (1992) test to the data, we find no reason to reject the hypothesis that equivalent width and Ly luminosity are statistically independent quantities.
In contrast, the middle panel of Figure 6 displays the distribution of Ly equivalent widths as a function of continuum magnitude. The difference between the two diagrams is striking. While the lack of low equivalent-width sources with faint continuum magnitudes is simply a selection effect (the Ly emission-line is too faint to be seen), the absence of high equivalent-width, bright continuum objects is real. If we apply the non-parametric rank-order statistic described by Efron & Petrosian (1992) to our truncated dataset, then we find that the null hypothesis of independence between equivalent width and continuum magnitude is excluded at the level (for the Gr07 sample) and the level (for our new dataset). In other words, equivalent width shows no correlation when plotted against line brightness, but a clear anti-correlation when compared to continuum brightness.
The explanation for these seemingly contradictory results probably lies in the fact that equivalent width is a derived quantity formed from two photometric measurements, one for the emission line, and one for the continuum. Consequently, the points displayed in the first two panels of Figure 6 possess correlated errors. In the left-hand diagram, emission-line strength and equivalent width are positively correlated, so photometric errors will preferentially scatter objects into the high-luminosity, high-equivalent width region of the diagram. Conversely, in the middle panel, continuum strength and equivalent width are negatively correlated, so errors in the abscissa will move objects away from this portion of the figure. When this dichotomy is coupled with the heteroskedastic nature of the dataset – the largest uncertainties are associated with the objects having the faintest continuum magnitudes and therefore the highest equivalent widths – the result can be an apparent correlation in one figure, and a lack of correlation in another.
The best way to investigate the systematics of equivalent width is to plot the two independent quantities in the relation – line strength and continuum strength – against one another. This is done in the right-hand panel of Figure 6. Here, there is no evidence of any systematic behavior with luminosity: the LAEs occupy a strip in the diagram whose thickness appears constant with luminosity. This argues strongly against the presence of a systematic dependence of equivalent width on luminosity.
4 Evolution from to
To investigate the evolution of Ly emitters in the redshift range , we can compare the properties of our LAE candidates to those of the objects found by Guaita et al. (2010, hereafter Gu10) in their deep narrow-band survey of the ECDF-S. Like the observations described here, Gu10 used a 50 Å wide FWHM filter () and the prime focus Mosaic II CCD camera of the CTIO 4-m telescope to identify a complete sample of candidate LAEs over arcmin2 region of the sky. Also, like our sample, the Gu10 objects are defined via their color with respect to deep continuum images provided by the MUSYC survey (Gawiser et al., 2006b), have rest-frame Ly equivalent widths greater than 20 Å, and have minimum Ly luminosities of ergs s-1. Thus, in area, number, and depth, the Gu10 dataset is well-suited for a comparative study.
Gu10 have already used the Chandra and GALEX source lists to eliminate some high-equivalent width interlopers from their sample: as with our candidates, true galaxies without AGN should not only be undetected in the x-ray, but in the ultraviolet as well, as nearly all their near-UV flux originates at wavelengths beyond the Lyman break. To these criteria, we added two others. First, we eliminated one LAE candidate that was previously identified as a QSO in the COMBO-17 source catalog (Wolf et al., 2004). EIS J033330.60274819.3 is located at the extreme edge of the ECDF-S Field 1 x-ray pointing, from the field center. Although the object is not cataloged as an x-ray source, it is (barely) detected in the hard x-ray band, and its implied (rest-frame) 2 keV to 2500 Å flux ratio is consistent with that expected for an AGN (Strateva et al., 2005). (Using a aperture, we derive .) Moreover, the candidate in question is exceptionally luminous for an LAE, as it has a continuum-subtracted narrow-band flux that is over a magnitude brighter than the next most luminous source in the Gu10 object list. Thus, even if the candidate is not an AGN, its extreme luminosity places it in a different category from all other candidates in the Gu10 sample, and unfittable via a traditional Schechter (1976) function.
In addition to excluding this one object, we also examined each candidates’ appearance on HST -band images taken as part of the GOODS (Giavalisco et al., 2004) and GEMS (Rix et al., 2004) surveys. Since LAEs are, in general, much fainter in the continuum than Lyman-break galaxies, we might expect the sample of objects to be smaller (in physical extent) than the largest Lyman-break galaxies found by Ferguson et al. (2004) and Ravindranath et al. (2006). In fact, the HST-based morphological study of Bond et al. (2011) classified these “large” objects as photometric interlopers, and Guaita et al. (2011) used this discriminant in their analysis of the LAEs’ spectral energy distributions. Thirty-four of the Gu10 objects fall into this category, but only four are among the brightest 100 objects in the sample, and only one is more luminous than the sample’s 90% completeness limit. Consequently, their inclusion or exclusion makes very little difference to the analysis. Below, we will present results both including and excluding these objects.
Before fitting the luminosity function, we made one other modification to the Gu10 dataset. For consistency with our photometry and with the analysis of Gr07, we chose to adopt Gu10’s point-source aperture fluxes in our analysis, rather than their corrected aperture fluxes, which were derived using the photometric techniques of Gawiser et al. (2006b). While this latter procedure is most useful for selecting LAEs out of the general galaxy population, the former method is better suited for measuring the brightnesses of exceedingly compact () sources on groundbased images. (Since the seeing on the Gu10 frames is roughly twice the size of the largest LAE counterpart identified on HST frames of the region (Bond et al., 2011), this change is certainly justified.) This technical revision reduces the derived magnitudes of a significant fraction of the Gu10 LAEs, sometimes by as much as mag. Our final sample then consists of 37 LAEs brighter than the Gu10 90% completeness limit of , and 73 sources belonging to a statistically complete sample of objects with monochromatic, continuum-subtracted fluxes greater than ergs cm-2 s-1.
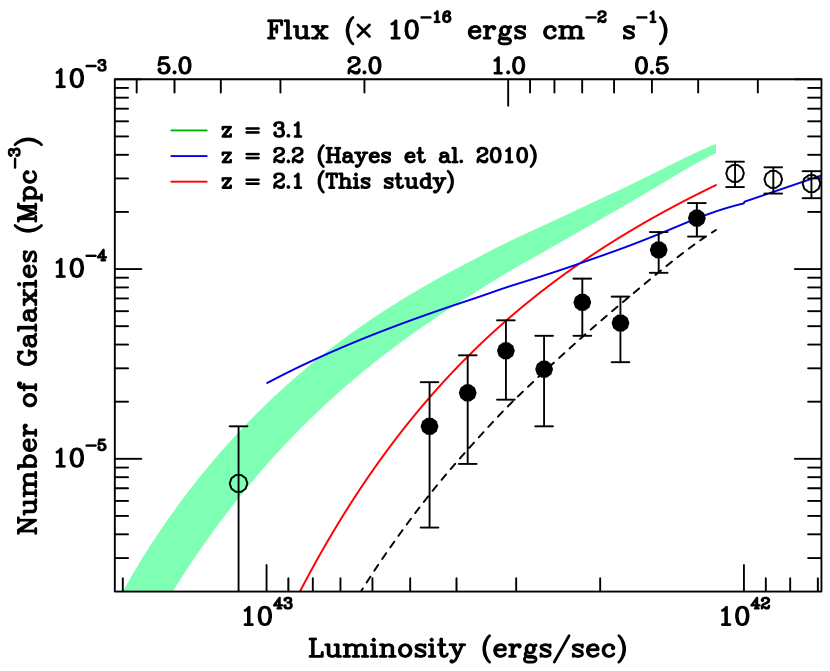
In Figure 7, we fit the Gu10 LAE monochromatic fluxes (with the “large” objects excluded) to a Schechter (1976) function in exactly the same manner as for the samples, setting , and using convolution kernels appropriate for the Gu10 photometric errors and filter transmission function. The first feature to note is the offset between the dashed line, which displays the best fit to the data, and the solid black line, which represents the implied luminosity function. This difference, which is almost 3 times larger than in Figure 5, is due entirely to the properties of the narrow-band filter employed in the survey. Like the Gr07 observations, the Gu10 study was performed through a filter whose transmission curve is more Gaussian-shaped than top-hat. Consequently, LAEs with redshifts that place their emission-line off the center of the filter have their monochromatic fluxes (and equivalent widths) systematically underestimated. The result is an effective survey volume that is less than that implied by FWHM of the filter. (See Gr07 for a full description of the effect.)
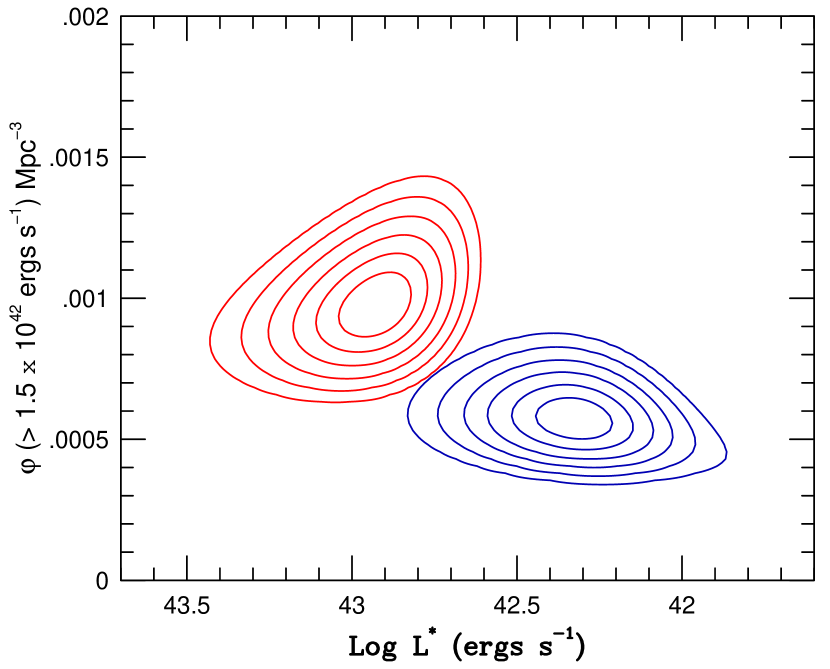
Even after we correct for this offset, it is apparent that there are fewer bright LAEs at than predicted by the luminosity functions. Our value of , is mag fainter than that measured at the higher redshift, and there are fewer LAEs with emission-line luminosities brighter than ergs s-1. Even if the “large” LAE candidates are included in the fit, the result does not change: the inclusion of these objects brightens by only 0.01 mag, and increases the normalization of the function by only 4%. The dramatic change in the luminosity function between and is also illustrated via the likelihood contours of Figure 8, and is similar, though a bit larger, than the fall-off seen by Blanc et al. (2011) in their blind integral-field spectroscopic survey of the COSMOS, GOODS-N, MUNICS-S2, and XMM-LSS fields. We note, however, that though the Blanc et al. (2011) observations with the McDonald 2.7-m telescope dwarf all other LAE surveys in terms of survey volume Mpc3), their measurement of LAE evolution is limited by the relatively small number of objects detected ( LAEs distributed roughly evenly between ), and a very bright limiting luminosity ( ergs s-1). Similarly, our results are consistent with the narrow-band photometry of Nilsson et al. (2009a), though again, the size of the telescope (2.2 m) and width of the interference filter (130 Å FWHM) restricted their study to relatively luminous objects. Still, this survey did detect LAE candidates with little expected contamination, and the global properties of the sample should be robust. The only apparent contradiction with our data involes the analysis of Hayes et al. (2010), who used a combination of Ly, H, and deep broadband imaging (the latter for photo- estimates) to derive a much slower rate of evolution at the bright end of the LAE luminosity function. However, this result is based on only 21 LAEs, none brighter than ergs s-1. Thus, it is still possible that all the results are consistent.
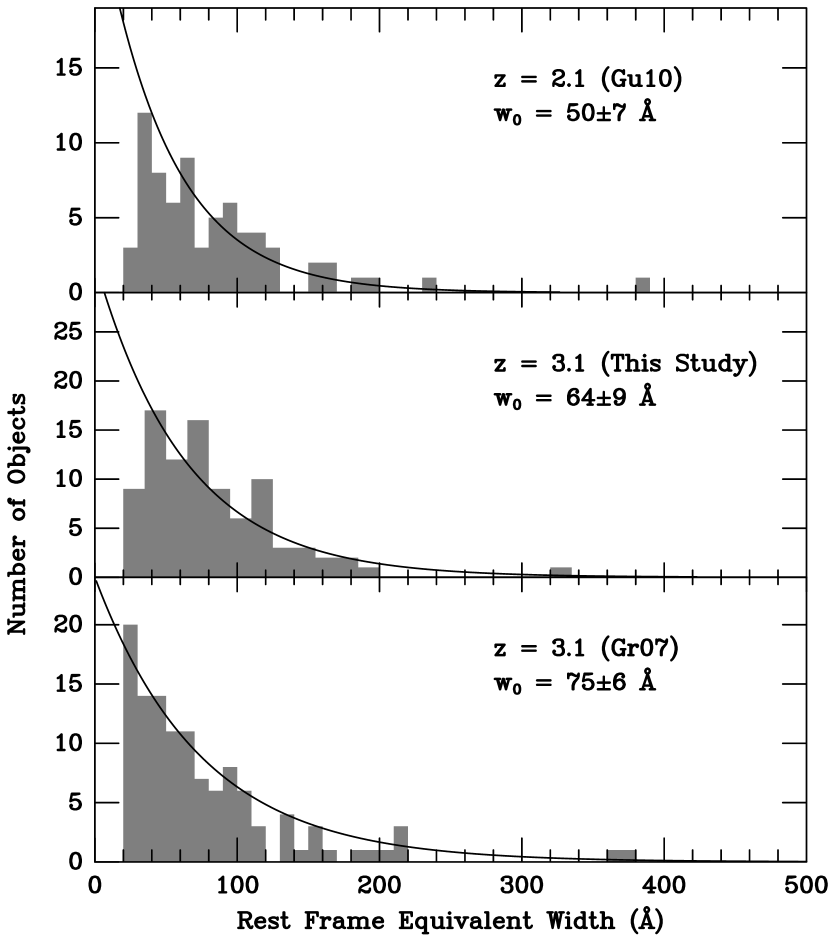
More evidence of LAE evolution comes from the distribution of Ly equivalent widths. Figure 9 displays a histogram of rest-frame equivalent widths for the present sample, the Gr07 sample, and the Gu10 dataset. The two distributions are statistically identical: K-S and Anderson-Darling tests can discern no difference between the datasets, and an exponential fit to the distributions, using the same maximum-likelihood procedures as Gr07, yields a rest-frame scale-length of Å for the LAEs of our new survey. This is consistent with the value of Å found by Gr07, and, when the two datasets are combined, the resulting equivalent width scale length for LAEs is Å. This contrasts sharply with the best-fit value of Å for the LAE sample. Non-parametric statistics, such as those associated with the K-S and Anderson-Darling tests, prove that the samples differ with greater than 99% confidence, confirming that some amount of evolution has occurred in the Gyr between and .
5 Ly and UV Star Formation Rates
The strength of the Ly emission line and brightness of the UV continuum are both functions of star formation. Specifically, the assumptions of an optically thick interstellar medium, Case B recombination, and a Salpeter (1955) universal initial mass function lead to a relationship between Ly luminosity (in ergs s-1) and star-formation rate,
| (3) |
(Kennicutt, 1998; Brocklehurst, 1971). Similarly, population synthesis models for systems of stars undergoing a constant rate of star formation predict
| (4) |
where (in ergs s-1 Hz-1) represents the population’s mid-UV (1500 Å to 2800 Å) continuum luminosity (Kennicutt, 1998). Thus, in the absence of dust, galaxies which are optically thick to Lyman radiation should have Ly luminosities that are well-correlated with their continuum flux.
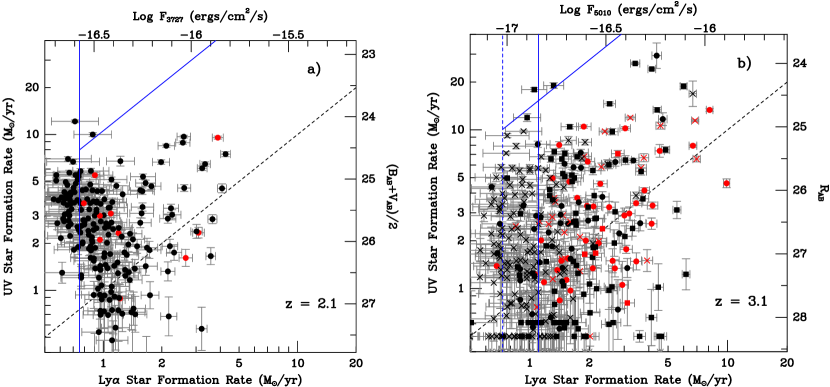
Figure 10 compares the two quantities. From the figure, it is easy to see that at both redshifts, there is a wide range of star-formation rate ratios, and that the scatter in the diagram is much larger than that produced by simple photometric errors. Objects above the one-to-one line are easily explained by the loss of Ly photons, most likely to encounters with dust grains (e.g., Charlot & Fall, 1993; Hayes et al., 2010; Atek et al., 2009). In contrast, objects below the line may be systems for which the “continuous star formation approximation” in population synthesis models is inappropriate (i.e., objects with star-formation timescales less than yr) or ones where the dust is preferentially embedded within large neutral gas clouds with steep density profiles (e.g., Neufeld, 1991; Hansen & Oh, 2006; Finkelstein et al., 2009).
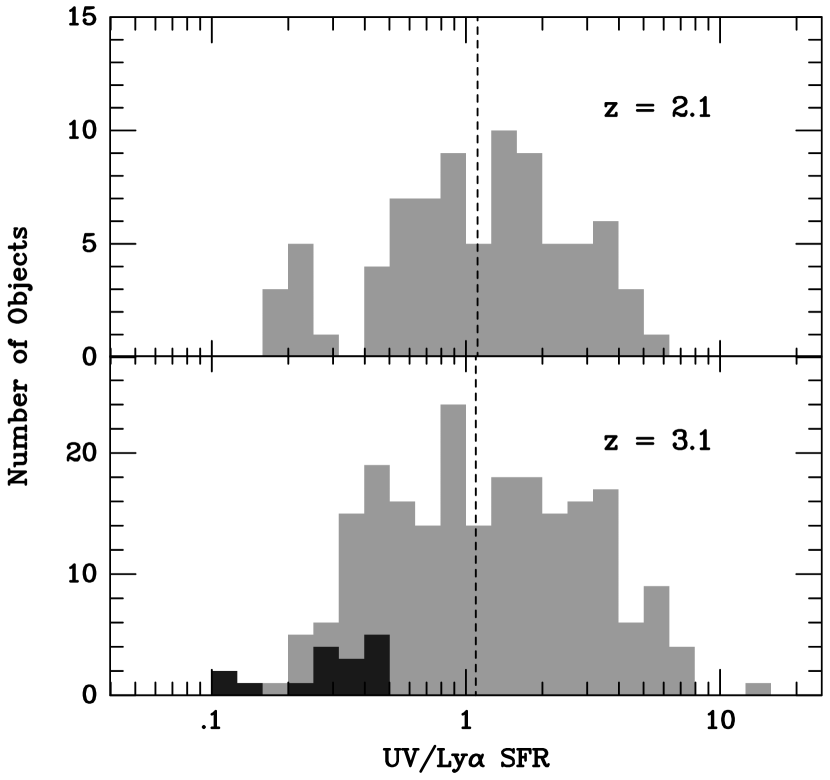
Interestingly, the distribution of star-formation rate ratios displayed in Figure 10 shows no evidence for evolution between and . Our new survey is complete to a continuum-subtracted monochromatic luminosity limit of ergs s-1. For LAEs brighter than this, the median ratio of the UV star-formation rate to the Ly star-formation rate is , where the uncertainty is determined via a bootstrap analysis. For systems, this ratio is . Moreover, as Figure 11 illustrates, there is no difference in the shape of the underlying distribution: while a number of physical mechanisms might cause a systematic shift in the ratio of the two star formation rate indicators, an Anderson-Darling test can find no evidence for any evolution, even at the level.
Nevertheless, the change in the equivalent width distribution, does point to a decrease in the efficiency of Ly emission. As described above, Ly line flux and mid-UV continuum flux are both driven by a galaxy’s star-formation rate. Moreover, in the wavelength range , a star-forming galaxy’s spectral energy distribution (SED) is well-fit by a simple power-law, , with slope (Calzetti et al., 1994; Meurer et al., 1999). Since is rather insensitive to a starburst’s duration, metallicity, or initial mass function (Leitherer et al., 1999; Bouwens et al., 2009), any systematic shift in a population’s Ly to 1250 Å continuum flux ratio, i.e., in its Ly equivalent width, must be due to some other parameter. Geometry is one such variable, since an increase in the opening angle for Ly emission would cause a typical line-of-sight to receive fewer photons. However, purely geometrical effects cannot explain the fading of the LAE luminosity function, nor a decline in the star formation rate density of the LAE population (see next section). The most likely explanation for these changes is dust, which can decrease , and also reduce the efficiency of line emission by destroying Ly photons. This interpretation is supported by the SED analysis of Guaita et al. (2011), who found that LAEs have slightly greater reddening than their counterparts (Gawiser et al., 2007).
6 The Star Formation Rate Density of LAEs
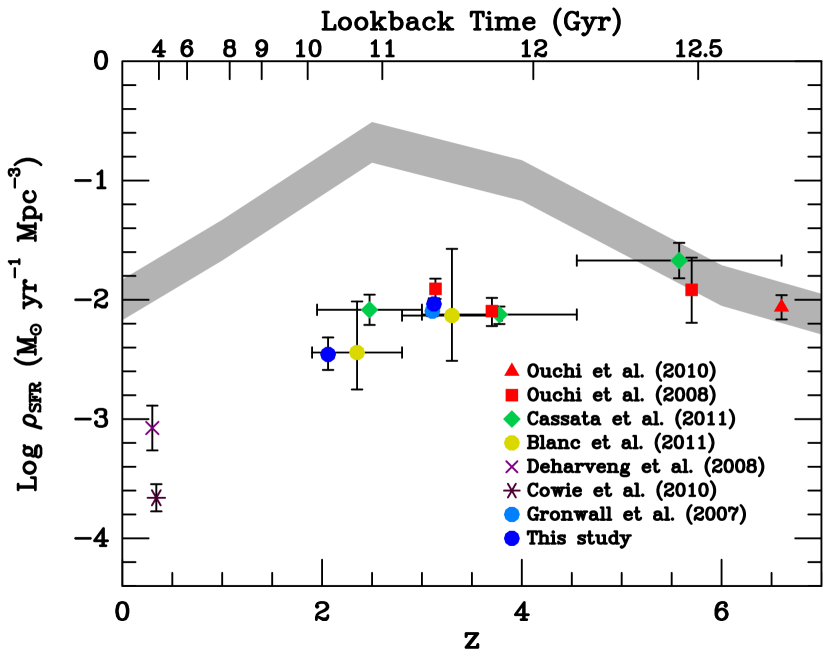
Narrow-band imaging (Ouchi et al., 2008, 2010, Gr07, Gu10), along with slitless (Deharveng et al., 2008), long-slit (Cassata et al., 2011), and integral-field (Blanc et al., 2011) spectroscopy now yield a coherent picture of the evolution of the LAE population and their star-formation rate density. To illustrate this, we computed the total observed Ly luminosities of the and LAE populations by integrating their best-fit Schechter (1976) functions of Table 5 down to zero. We then used equation (3) to convert these luminosities into star-formation rate densities, and compared our results to those of other LAE measurements and from estimates made using the rest-frame UV continuum. This comparison is shown in Figure 12. As the figure indicates, at , the star-formation rate densities one obtains from Ly are identical to those derived from the rest-frame UV; at these redshifts, the assumption of an optically thick Case B interstellar medium, little extinction, and a Ly escape fraction near unity appears reasonable. However, at a lookback time of Gyr, there is a rapid transition, as at all subsequent epochs the ratio of LAE to rest-frame UV star-formation rate density is . The decline in the Ly-based measurements between and (and, indeed, to ) roughly follows that for the universe as a whole.
Figure 10 shows that, in a differential sense, dust has very little effect on the LAE population: on average, the star-formation rates inferred from Ly are similar to those derived from the rest-frame UV. The dispersion in the diagram is large, suggesting the presence of some reddening (and perhaps implying that many of the LAEs have star-formation timescales less than yr), but overall, the Ly escape fraction from these objects appears to be close to unity. On the other hand, Figure 12 proves that globally, Ly-based measurements of star formation yield values that are more than an order of magnitude less than those found from the rest-frame UV. Clearly, the bulk of star formation is occuring outside of the LAE population. As confirmed by their colors and nebular emission, LAEs represent the extreme low-extinction, low-metallicity tail of the star-forming galaxy population (Gawiser et al., 2007; Guaita et al., 2011; Finkelstein et al., 2011).
7 Conclusion
Our 5010 Å narrow-band survey of the Extended Chandra Deep Field South has produced 199 high equivalent width (EW Å) objects, of which 141 are members of a statistically complete sample with monochromatic fluxes brighter than ergs cm-2 s-1. X-ray and UV observations with the Chandra, GALEX, and Swift satellites demonstrate that most of our brightest candidates are AGN or foreground [O II] emitters, but when we exclude these sources, we are still left with a complete sample of 130 candidates that are likely to be Ly emitting galaxies at . This sample overlaps that defined by Gr07 using a 4990 Å narrow-band filter, but includes an additional 68 candidates. This brings the total number of likely LAEs known in the ECDF-S to 360, with 223 being members of statistically complete samples. The sample now extends in redshift space from to and includes 72 objects with spectroscopic confirmations.
Using these data, we have explored the luminosity function and equivalent width distribution of LAEs. Both functions are in excellent agreement with previous determinations: our value for the Schechter cutoff () and equivalent width e-folding scale ( Å) are statistically identical to values in the literature (Gr07, Ouchi et al., 2008) and the normalization of the functions are also consistent to . We show that an apparent apparent deficit of continuum-bright, high equivalent-width objects is most likely an artifact caused by correlated errors in our heteroskedastic dataset. When the independent parameters of line-luminosity and continuum luminosity are compared, the apparent correlation disappears.
We have also examined the evolution of the LAE luminosity function towards lower redshifts by comparing our sample of Ly emitters to the LAEs found by Gu10. We show that in the Gyr between the two epochs, the number of LAEs with line luminosities brighter than ergs s-1 declined by , and faded by mag. Thus, it appears that the large decrease in the frequency and strength of galactic Ly emission observed by Deharveng et al. (2008) and Cowie et al. (2010) at has begun by . Similarly, there are significantly fewer LAEs with extremely high equivalent widths: between and , the scale length of the LAE equivalent width distribution decreased from Å to Å. This decrease suggests that LAEs have slightly more dust than their counterparts. This hypothesis is supported by the results of spectral energy distribution fitting (Gawiser et al., 2007; Guaita et al., 2011), but is not confirmed by an analysis of the objects’ UV to Ly-based star formation rate ratios.
Finally, by integrating our LAE luminosity functions and then combining our measurements with other data from the literature, we have estimated how the contribution of LAEs to the star-formation rate density of the universe changes with redshift. At , LAEs are responsible for most of the star-formation rate density, but in the redshift range , this fraction has decreased to . As pointed out by Blanc et al. (2011), this suggests that globally, there has been strong evolution in the Ly escape fraction. This is consistent with other results based on LAE photometry and spectroscopy: at the epochs considered here, Ly emitters represent the extreme low-metallicity, low-extinction, faint-end tail of the star-forming galaxy population (Gawiser et al., 2007; Guaita et al., 2011; Finkelstein et al., 2011).
References
- Albrecht et al. (2006) Albrecht, A., Bernstein, G., Cahn, R., Freedman, W.L., Hewitt, J., Hu, W., Huth, J., Kamionkowski, M., Kolb, E.W., Knox, L., Mather, J.C., Staggs, S., & Suntzeff, N.B. 2006, arXiv:astro-ph/0609591
- Ando et al. (2006) Ando, M., Ohta, K., Iwata, I., Akiyama, M., Aoki, K., & Tamura, N. 2006, ApJ, 645, L9
- Ando et al. (2007) Ando, M., Ohta, K., Iwata, I., Akiyama, M., Aoki, K., & Tamura, N. 2007, PASJ, 59, 717
- Atek et al. (2009) Atek, H., Kunth, D., Schaerer, D., Hayes, M., Deharveng, J.M., Östlin, G., & Mas-Hesse, J.M. 2009, A&A, 506, L1
- Balestra et al. (2010) Balestra, I., Mainieri, V., Popesso, P., Dickinson, M., Nonino, M., Rosati, P., Teimoorinia, H., Vanzella, E., Cristiani, S., Cesarsky, C., Fosbury, R.A.E., Kuntschner, H., & Rettura, A. 2010, A&A, 512, A12
- Blanc et al. (2011) Blanc, G.A., Adams, J., Gebhardt, K., Hill, G.J., Drory, N., Hao, L., Bender, R., Byun, J., Ciardullo, R., Finkelstein, S., Fry, A., Gawiser, E., Gronwall, C., Hopp, U., Jeong, D., Kelz, A., Kelzenberg, R., Komatsu, E., MacQueen, P., Murphy, J., Palunas, P., Roth, M., Schneider, D., & Tufts, J. 2010, ApJ, in press
- Bond et al. (2011) Bond, N., Gawiser, E., Guaita, L., Padilla, N., Gronwall, C., Ciardullo, R., & Lai, K. 2011, submitted to Ap. J. (arXiv:1104.2880)
- Bouwens et al. (2009) Bouwens, R.J., Illingworth, G.D., Franx, M., Chary, R.-R., Meurer, G.R., Conselice, C.J., Ford, H., Giavalisco, M., & van Dokkum, P. 2009, ApJ, 705, 936
- Bouwens et al. (2010) Bouwens, R.J., Illingworth, G.D., Oesch, P.A., Stiavelli, M., van Dokkum, P., Trenti, M., Magee, D., Labbé, I., Franx, M., Carollo, C.M., & Gonzalez, V. 2010, ApJ, 709, L133
- Brandt et al. (2001) Brandt, W.N., Alexander, D.M., Hornschemeier, A.E., Garmire, G.P., Schneider, D.P., Barger, A.J., Bauer, F.E., Broos, P.S., Cowie, L.L., Townsley, L.K., Burrows, D.N., Chartas, G., Feigelson, E.D., Griffiths, R.E., Nousek, J.A., & Sargent, W.L.W. 2001, AJ, 122, 2810
- Brocklehurst (1971) Brocklehurst, M. 1971, MNRAS, 153, 471
- Calzetti et al. (1994) Calzetti, D., Kinney, A.L., & Storchi-Bergmann, T. 1994, ApJ, 429, 582
- Cassata et al. (2011) Cassata, P., Le Fèvre, O., Garilli, B., Maccagni, D., Le Brun, V., Scodeggio, M., Tresse, L., Ilbert, O., Zamorani, G., Cucciati, O., Contini, T., Bielby, R., Mellier, Y., McCracken, H.J., Pollo, A., Zanichelli, A., Bardelli, S., Cappi, A., Pozzetti, L., Vergani, D., & Zucca, E. 2011, A&A, 525, A143
- Charlot & Fall (1993) Charlot, S., & Fall, S.M. 1993, ApJ, 415, 580
- Cowie et al. (2010) Cowie, L.L., Barger, A.J., & Hu, E.M. 2010, ApJ, 711, 928
- Deharveng et al. (2008) Deharveng, J.-M., Small, T., Barlow, T.A., Péroux, C., Milliard, B., Friedman, P.G., Martin, D.C., Morrissey, P., Schiminovich, D., Forster, K., Seibert, M., Wyder, T.K., Bianchi, L., Donas, J., Heckman, T.M., Lee, Y.-W., Madore, B.F., Neff, S.G., Rich, R.M., Szalay, A.S., Welsh, B.Y., & Yi, S.K. 2008, ApJ, 680, 1072
- Efron & Petrosian (1992) Efron, B., & Petrosian, V. 1992, ApJ, 399, 345
- Feldmeier et al. (2003) Feldmeier, J.J., Ciardullo, R., Jacoby, G.H., & Durrell, P.R. 2003, ApJS, 145, 65
- Ferguson et al. (2004) Ferguson, H.C., Dickinson, M., Giavalisco, M., Kretchmer, C., Ravindranath, S., Idzi, R., Taylor, E., Conselice, C.J., Fall, S.M., Gardner, J.P., Livio, M., Madau, P., Moustakas, L.A., Papovich, C.M., Somerville, R.S., Spinrad, H., & Stern, D. 2004, ApJ, 600, L107
- Finkelstein et al. (2009) Finkelstein, S.L., Malhotra, S., Rhoads, J.E., Hathi, N.P., & Pirzkal, N. 2009, MNRAS, 393, 1174
- Finkelstein et al. (2011) Finkelstein, S.L., Hill, G.J., Gebhardt, K., Adams, J., Blanc, G.A., Papovich, C., Ciardullo, R., Drory, N., Gawiser, E., Gronwall, C., Schneider, D.P., & Tran, K.-V. 2011, ApJ, 729, 140
- Gawiser et al. (2006a) Gawiser, E., van Dokkum, P.G., Gronwall, C., Ciardullo, R., Blanc, G.A., Castander, F.J., Feldmeier, J., Francke, H., Franx, M., Haberzettl, L., Herrera, D., Hickey, T., Infante, L., Lira, P., Maza, J., Quadri, R., Richardson, A., Schawinski, K., Schirmer, M., Taylor, E.N., Treister, E., Urry, C.M., & Virani, S.N. 2006, ApJ, 642, L13
- Gawiser et al. (2006b) Gawiser, E., van Dokkum, P.G., Herrera, D., Maza, J., Castander, F.J., Infante, L., Lira, P., Quadri, R., Toner, R., Treister, E., Urry, C.M., Altmann, M., Assef, R., Christlein, D., Coppi, P.S., Durán, M.F., Franx, M., Galaz, G., Huerta, L., Liu, C., López, S., Méndez, R., Moore, D.C., Rubio, M., Ruiz, M.T., Toft, S., & Yi, S.K. 2006, ApJS, 162, 1
- Gawiser et al. (2007) Gawiser, E., Francke, H., Lai, K., Schawinski, K., Gronwall, C., Ciardullo, R., Quadri, R., Orsi, A., Barrientos, L.F., Blanc, G.A., Fazio, G., Feldmeier, J.J., Huang, J., Infante, L., Lira, P., Padilla, N., Taylor, E.N., Treister, E., Urry, C.M., van Dokkum, P.G., & Virani, S.N. 2007, ApJ, 671, 278
- Giavalisco et al. (2004) Giavalisco, M., et al. 2004, ApJ, 600, L93
- Gronwall et al. (2007) Gronwall, C., Ciardullo, R., Hickey, T., Gawiser, E., Feldmeier, J.J., van Dokkum, P.G., Urry, C.M., Herrera, D., Lehmer, B.D., Infante, L., Orsi, A., Marchesini, D., Blanc, G.A., Francke, H., Lira, P., & Treister, E. 2007, ApJ, 667, 79 (Gr07)
- Guaita et al. (2011) Guaita, L., Acquaviva, V., Padilla, N., Gawiser, E., Bond, N.A., Ciardullo, R., Tresiter, E., Kurczynski, P., Gronwall, C., Lira, P., & Schawinski, K. 2011, ApJ, 733, 114
- Guaita et al. (2010) Guaita, L., Gawiser, E., Padilla, N., Francke, H., Bond, N.A., Gronwall, C., Ciardullo, R., Feldmeier, J.J., Sinawa, S., Blanc, G.A., & Virani, S. 2010, ApJ, 714, 255 (Gu10)
- Hamuy et al. (1992) Hamuy, M., Walker, A.R., Suntzeff, N.B., Gigoux, P., Heathcote, S.R., & Phillips, M.M. 1992, PASP, 104, 533
- Hayes et al. (2010) Hayes, M., Östlin, G., Schaerer, D., Mas-Hesse, J.M., Leitherer, C., Atek, H., Kunth, D., Verhamme, A., de Barros, S., & Melinder, J. 2010, Nature, 464, 562
- Hansen & Oh (2006) Hansen, M., & Oh, S.P. 2006, MNRAS, 367, 979
- Hill et al. (2008) Hill, G.J., Gebhardt, K., Komatsu, E., Drory, N., MacQueen, P.J., Adams, J., Blanc, G.A., Koehler, R., Rafal, M., Roth, M.M., Kelz, A., Gronwall, C., Ciardullo, R., & Schneider, D.P. 2007, A.S.P. Conference Series 399, Panoramic Views of Galaxy Formation and Evolution, ed. T. Kodama, T. Yamada, & K. Aoki (San Francisco: Astronomical Society of the Pacific), 115
- Hogg et al. (1998) Hogg, D.W., Cohen, J.G., Blandford, R., & Pahre, M.A. 1998, ApJ, 504, 622
- Hoversten et al. (2009) Hoversten, E.A., Gronwall, C., Vanden Berk, D.E., Koch, T.S., Breeveld, A.A., Curran, P.A., Hinshaw, D.A., Marshall, F.E., Roming, P.W.A., Siegel, M.H., & Still, M. 2009, ApJ, 705, 1462
- Iwata et al. (2007) Iwata, I., Ohta, K., Tamura, N., Akiyama, M., Aoki, K., Ando, M., Kiuchi, G., & Sawicki, M. 2007, MNRAS, 376, 1557
- Jacoby et al. (1987) Jacoby, G.H., Quigley, R.J., & Africano, J.L. 1987, PASP, 99, 672
- Kennicutt (1998) Kennicutt, R.C. 1998, ARA&A, 36, 189
- Kobayashi et al. (2010) Kobayashi, M.A.R., Totani, T., & Nagashima, M. 2010, ApJ, 708, 1119
- Le Fèvre et al. (2005) Le Fèvre, O., et al. 2005, A&A, 439, 845
- Lehmer et al. (2005) Lehmer, B.D., Brandt, W.N., Alexander, D.M., Bauer, F.E., Schneider, D.P., Tozzi, P., Bergeron, J., Garmire, G.P., Giacconi, R., Gilli, R., Hasinger, G., Hornschemeier, A.E., Koekemoer, A.M., Mainieri, V., Miyaji, T., Nonino, M., Rosati, P., Silverman, J.D., Szokoly, G., & Vignali, C. 2005, ApJS, 161, 21
- Lehmer et al. (2010) Lehmer, B.D., Alexander, D.M., Bauer, F.E., Brandt, W.N., Goulding, A.D., Jenkins, L.P., Ptak, A., & Roberts, T.P. 2010, ApJ, 724, 559
- Leitherer et al. (1999) Leitherer, C., Schaerer, D., Goldader, J.D., González Delgado, R.M., Robert, C., Kune, D.F., de Mello, D.F., Devost, D., & Heckman, T.M. 1999, ApJS, 123, 3
- Luo et al. (2008) Luo, B., Bauer, F.E., Brandt, W.N., Alexander, D.M., Lehmer, B.D., Schneider, D.P., Brusa, M., Comastri, A., Fabian, A.C., Finoguenov, A., Gilli, R., Hasinger, G., Hornschemeier, A.E., Koekemoer, A., Mainieri, V., Paolillo, M., Rosati, P., Shemmer, O., Silverman, J.D., Smail, I., Steffen, A.T., & Vignali, C. 2008, ApJS, 179, 19
- Mao et al. (2007) Mao, J., Lapi, A., Granato, G.L., de Zotti, G., & Danese, L. 2007, ApJ, 667, 655
- Meurer et al. (1999) Meurer, G.R., Heckman, T.M., & Calzetti, D. 1999, ApJ, 521, 64
- Monet et al. (2003) Monet, D.G., Levine, S.E., Canzian, B., Ables, H.D., Bird, A.R., Dahn, C.C., Guetter, H.H., Harris, H.C., Henden, A.A., Leggett, S.K., Levison, H.F., Luginbuhl, C.B., Martini, J., Monet, A.K.B., Munn, J.A., Pier, J.R., Rhodes, A.R., Riepe, B., Sell, S., Stone, R.C., Vrba, F.J., Walker, R.L., Westerhout, G., Brucato, R.J., Reid, I.N., Schoening, W., Hartley, M., Read, M.A., & Tritton, S.B. 2003, AJ, 125, 984
- Neufeld (1991) Neufeld, D.A. 1991, ApJ, 370, L85
- Nilsson et al. (2009a) Nilsson, K.K., Tapken, C., Möller, P., Freudling, W., Fynbo, J.P.U., Meisenheimer, K., Laursen, P., Östlin, G. 2009a, A&A, 498, 13
- Nilsson et al. (2009b) Nilsson, K.K., Möller-Nilsson, O., Möller, P., Fynbo, J.P.U., & Shapley, A.E. 2009b, MNRAS, 400, 232
- Nilsson et al. (2011) Nilsson, K.K., Östlin, G., Møller, P., Möller-Nilsson, O., Tapken, C., Freudling, W., & Fynbo, J.P.U. 2011, A&A, 529, A9
- Ouchi et al. (2008) Ouchi, M., Shimasaku, K,, Akiyama, M,, Simpson, C., Saito, T., Ueda, Y., Furusawa, H., Sekiguchi, K., Yamada, T., Kodama, T., Kashikawa, N., Okamura, S., Iye, M., Takata, T., Yoshida, M., & Yoshida, M. 2008, ApJS, 176, 301
- Ouchi et al. (2010) Ouchi, M., Shimasaku, K., Furusawa, H., Saito, T., Yoshida, M., Akiyama, M., Ono, Y., Yamada, T., Ota, K., Kashikawa, N., Iye, M., Kodama, T., Okamura, S., Simpson, C., & Yoshida, M. 2010, ApJ, 723, 869
- Persic et al. (2004) Persic, M., Rephaeli, Y., Braito, V., Cappi, M., Della Ceca, R., Franceschini, A., & Gruber, D.E. 2004, A&A, 419, 849
- Ravindranath et al. (2006) Ravindranath, S., Giavalisco, M., Ferguson, H.C., Conselice, C., Katz, N., Weinberg, M., Lotz, J., Dickinson, M., Fall, S.M., Mobasher, B., & Papovich, C. 2006, ApJ, 652, 963
- Reddy et al. (2008) Reddy, N.A., Steidel, C.C., Pettini, M., Adelberger, K.L., Shapley, A.E., Erb, D.K., & Dickinson, M. 2008, ApJS, 175, 48
- Rix et al. (2004) Rix, H.-W., Barden, M., Beckwith, S.V.W., Bell, E.F., Borch, A., Caldwell, J.A.R., Häussler, B., Jahnke, K., Jogee, S., McIntosh, D.H., Meisenheimer, K., Peng, C.Y., Sanchez, S.F., Somerville, R.S., Wisotzki, L., & Wolf, C. 2004, ApJS, 152, 163
- Salpeter (1955) Salpeter, E.E. 1955, ApJ, 121, 161
- Schechter (1976) Schechter, P. 1976, ApJ, 203, 297
- Schiminovich et al. (2003) Schiminovich, D., Arnouts, S., Milliard, B., & the GALEX Science Team 2003, BAAS, 35, 1371
- Scholz & Stephens (1987) Scholz, F.W., & Stephens, M.A. 1987, J. Amer. Stat. Assoc., 82, 918
- Shapley et al. (2003) Shapley, A.E., Steidel, C.C., Pettini, M., & Adelberger, K.L. 2003, ApJ, 588, 65
- Shioya et al. (2009) Shioya, Y., Taniguchi, Y., Sasaki, S.S., Nagao, T., Murayama, T., Saito, T., Ideue, Y., Nakajima, A., Matsuoka, K., Trump, J., Scoville, N.Z., Sanders, D.B., Mobasher, B., Aussel, H., Capak, P., Kartaltepe, J., Koekemoer, A., Carilli, C., Ellis, R.S., Garilli, B., Giavalisco, M., Kitzbichler, M.G., Impey, C., LeFevre, O., Schinnerer, E., & Smolcic, V. 2009, ApJ, 696, 546
- Stone (1977) Stone, R.P.S. 1977, ApJ, 218, 767
- Strateva et al. (2005) Strateva, I.V., Brandt, W.N., Schneider, D.P., Vanden Berk, D.G., & Vignali, C. 2005, AJ, 130, 387
- Szokoly et al. (2004) Szokoly, G.P., Bergeron, J., Hasinger, G., Lehmann, I., Kewley, L., Mainieri, V., Nonino, M., Rosati, P., Giacconi, R., Gilli, R., Gilmozzi, R., Norman, C., Romaniello, M., Schreier, E., Tozzi, P., Wang, J.X., Zheng, W., & Zirm, A. 2004, ApJS, 155, 271
- Vanzella et al. (2008) Vanzella, E., Cristiani, S., Dickinson, M., Giavalisco, M., Kuntschner, H., Haase, J., Nonino, M., Rosati, P., Cesarsky, C., Ferguson, H.C., Fosbury, R.A.E., Grazian, A., Moustakas, L.A., Rettura, A., Popesso, P., Renzini, A., Stern, D., & the GOODS Team 2008, A&A, 478, 83
- Vanzella et al. (2009) Vanzella, E., Giavalisco, M., Dickinson, M., Cristiani, S., Nonino, M., Kuntschner, H., Popesso, P., Rosati, P., Renzini, A., Stern, D., Cesarsky, C., Ferguson, H.C., & Fosbury, R.A.E. 2009, ApJ, 695, 1163
- Virani et al. (2006) Virani, S.N., Treister, E., Urry, C.M., & Gawiser, E. 2006, AJ, 131, 2373
- Wolf et al. (2004) Wolf, C., Meisenheimer, K., Kleinheinrich, M., Borch, A., Dye, S., Gray, M., Wisotzki, L., Bell, E.F., Rix, H.-W., Cimatti, A., Hasinger, G., & Szokoly, G. 2004, A&A, 421, 913


| Exposure | Seeing | ||
|---|---|---|---|
| UT Date | (min) | () | Notes |
| 15 Oct 2006 | Through clouds | ||
| 17 Oct 2006 | Photometric | ||
| 19 Oct 2006 | Photometric | ||
| 21 Oct 2006 | Photometric | ||
| 20 Nov 2006 | Photometric | ||
| 22 Nov 2006 | Light cirrus |
| ID | (2000) | (2000) | Log | Observed EW (Å) | CommentsaaG-XXX denotes identification number in Gronwall et al. (2007) | |
|---|---|---|---|---|---|---|
| 1 | 3:32:17.57 | 27:49:40.9 | 98 | 0.337 | GALEX, UVOT source; Resolved | |
| 2 | 3:32:04.06 | 27:37:25.4 | 124 | 0.977 | x-ray, GALEX source | |
| 3 | 3:31:46.18 | 27:57:08.6 | 129 | … | x-ray, GALEX, UVOT source | |
| 4 | 3:33:07.61 | 27:51:26.9 | 153 | 1.609 | x-ray, UVOT source; | |
| 5 | 3:31:40.14 | 28:03:07.5 | 249 | … | G-009 | |
| 6 | 3:31:34.73 | 27:56:21.8 | 377 | 3.131 | G-019 | |
| 7 | 3:33:12.72 | 27:42:46.9 | 389 | … | G-002 | |
| 8 | 3:31:51.04 | 27:57:15.7 | 195 | … | x-ray, GALEX source | |
| 9 | 3:33:04.86 | 27:45:54.9 | 97 | … | ||
| 10 | 3:32:18.80 | 27:42:48.2 | 230 | 3.116 | G-004 |
| ID | (2000) | (2000) | Log | Observed EW (Å) | CommentsaaG-XXX denotes identification number in Gronwall et al. (2007) | |
|---|---|---|---|---|---|---|
| 142 | 3:32:06.86 | 27:53:33.4 | 611 | … | ||
| 143 | 3:32:58.57 | 27:41:31.0 | 307 | … | G-221 | |
| 144 | 3:31:52.83 | 27:45:18.6 | 186 | 3.106 | G-050 | |
| 145 | 3:33:12.89 | 28:03:08.2 | 739 | … | ||
| 146 | 3:33:18.56 | 27:33:49.5 | 926 | … | ||
| 147 | 3:33:21.69 | 27:45:06.9 | 163 | … | ||
| 148 | 3:33:02.99 | 28:02:34.9 | 136 | … | ||
| 149 | 3:32:57.35 | 27:51:42.1 | 331 | … | G-102 | |
| 150 | 3:33:38.74 | 27:47:02.5 | 460 | … | G-142 | |
| 151 | 3:32:14.57 | 27:45:52.4 | 314 | 3.118 | G-090 |
| Log | (mag) | Log | (mag) |
|---|---|---|---|
| 0.012 | 0.079 | ||
| 0.016 | 0.095 | ||
| 0.022 | 0.115 | ||
| 0.029 | 0.134 | ||
| 0.036 | 0.167 | ||
| 0.044 | 0.198 | ||
| 0.052 | 0.235 | ||
| 0.066 | 0.288 |
| Sample | (ergs s-1) | (Mpc-3) | (ergs s-1 Mpc-3) | |
|---|---|---|---|---|
| (Gr07) | ||||
| (Ouchi et al., 2008)aaValues are interpolated to , and appropriate for a 64 Å rest-frame equivalent width limit. Following their suggestion, these numbers should be increased by to approximate our 20 Å limit. | ||||
| (Gu10) |