11email: echapill@mpifr-bonn.mpg.de 22institutetext: Université de Bordeaux, Observatoire Aquitain des Sciences de l’Univers, 2 rue de l’Observatoire BP 89, F-33271 Floirac, France 33institutetext: CNRS/INSU - UMR5804, Laboratoire d’Astrophysique de Bordeaux; 2 rue de l’Observatoire BP 89, F-33271 Floirac, France
33email: guilloteau@obs.u-bordeaux1.fr,dutrey@obs.u-bordeaux1.fr 44institutetext: IRAM, 300 rue de la Piscine, F-38406 Saint Martin d’Hères, France.
44email: pietu@iram.fr,guelin@iram.fr
Chemistry in Disks. V: CN and HCN in proto-planetary disks ††thanks: Based on observations carried out with the IRAM Plateau de Bure Interferometer. IRAM is supported by INSU/CNRS (France), MPG (Germany), and IGN (Spain).
Abstract
Context. The chemistry of proto-planetary disks is thought to be dominated by two major processes: photodissociation near the disk surface, and depletion on dust grains in the disk mid-plane, resulting in a layered structure with molecules located in a warm layer above the disk mid-plane.
Aims. We attempt here to confront this warm molecular layer model prediction with the distribution of two key molecules for dissociation processes: CN and HCN
Methods. Using the IRAM Plateau de Bure interferometer, we obtained high spatial and spectral resolution images of the CN J=2-1 and HCN J=1-0 lines in the disks surrounding the two T-Tauri DM Tau and LkCa 15 and the Herbig Ae MWC 480. Disk properties are derived assuming power law distributions. The hyperfine structure of the observed transitions allows us to constrain the line opacities and excitation temperatures. We compare the observational results with predictions from existing chemical models, and use a simple PDR model (without freeze-out of molecules on grains and surface chemistry) to illustrate dependencies on UV field strength, grain size and gas-to-dust ratio. We also evaluate the impact of Ly radiation.
Results. The temperature ordering follows the trend found from CO lines, with DM Tau being the coldest object and MWC 480 the warmest. Although CN indicates somewhat higher excitation temperatures than HCN, the derived values in the T Tauri disks are very low (8-10 K). They agree with results obtained from C2H, and are in contradiction with thermal and chemical model predictions. These very low temperatures, as well as geometrical constraints, suggest that substantial amounts of CN and HCN remain in the gas phase close to the disk mid-plane, and that this mid-plane is quite cold. The observed CN/HCN ratio () is in better agreement with the existence of large grains, and possibly also a substantial contribution of Ly radiation.
Key Words.:
Stars: circumstellar matter – planetary systems: protoplanetary disks – individual: LkCa 15, MWC 480, DM Tau, – Radio-lines: stars1 Introduction
Studying the physical and chemical structure of proto-planetary disks is a prerequisite for our understanding of planet formation. While much theoretical work has been made on the structure and evolution of these disks (Bergin et al., 2007, and references therein), key parameters such as gas density and temperature, or molecular content and distribution remain poorly constrained. Since H2, which represents 80 % of the gas mass, cannot be observed with a good spatial resolution, our knowledge of the molecular component relies on low abundance tracers such as CO (Guilloteau & Dutrey, 1998). Interferometric maps of the CO emission, at mm and sub-mm wavelengths, resolve the gaseous disks, revealing their radial and vertical structure. Studies of the rare CO isotopologues, 13CO and C18O, confirm the existence of a vertical temperature gradient (Dartois et al., 2003; Piétu et al., 2007), allowing first face to face confrontation between model predictions and observations in the outer parts of the disks.
This led to a global picture of a flared disk consisting of 3 strata, or layers. The upper layer, close to the disk surface, is directly illuminated by the stellar UV and dominated by photo-dissociation reactions. The lowest layer, near the disk plane, is very cold, so that molecules are expected to be depleted on grains. Between those, the third layer, where the gas is lukewarm and the chemistry dominated by gas-phase reactions. Such a simple picture is already challenged by new observations which reveal that large amounts of cold CO are still in the gas phase (Dartois et al., 2003; Piétu et al., 2007), contrary to predictions. Vertical mixing was proposed to refurbish CO in the cold zone (Aikawa & Nomura, 2006; Aikawa, 2007; Semenov et al., 2006, see also Willacy et al. 2006).
In this scheme, molecules are displaced from the upper layers to the cold mid-plane and have the time to cool down before sticking onto grains; the results, however, are strongly dependent on the grain surface reaction efficiencies and on the disk structure. Hersant et al. (2009) have also shown that photo-desorption may increase the amount of cold CO in the gas.
A deeper understanding of the disk structure relies on the study of molecules probing different physical and chemical conditions. Apart from CO, only few molecules show strong enough mm/sub-mm emission to be detected: HCO+, N2H+, HCN, CN, HNC, CCH, CS and H2CO (Dutrey et al., 1997; Kastner et al., 1997; Thi et al., 2004; van Zadelhoff et al., 2001). Even fewer can be mapped (Aikawa et al., 2003; Qi et al., 2004; Dutrey et al., 2007; Schreyer et al., 2008). Among those, HCN and CN are particularly interesting because they trace different conditions and their abundances are closely related: HCN may be photo-dissociated (e.g., by Ly radiation from the star) to yield CN (Bergin et al., 2003). One thus expects HCN to trace the UV-shielded lukewarm and cold layers of the disk and CN the uppermost layer.
In this article, we present high angular resolution (3′′ to 1.5′′) observations of HCN J=1-0 and CN J=2-1 emission in 3 protoplanetary disks. The sources belong to the nearby Taurus-Aurigae star forming region, but have moved outside their parent cloud, so that they can be observed without interference. Table 1 summarizes their stellar properties.
- DM Tau is a classical T-Tauri star of mass 0.5 surrounded by a disk in Keplerian rotation (Guilloteau & Dutrey, 1998; Piétu et al., 2007). Dartois et al. (2003) have shown the existence of a vertical temperature gradient from high angular resolution observations of several transitions of and . Eight different molecular species have been detected in this source (Dutrey et al., 1997).
- LkCa 15 is a 1 T-Tauri star surrounded by a disk with a central cavity (Piétu et al., 2006). Piétu et al. (2007) found no evidence of a vertical temperature gradient from their CO multi-isotopologue data. The cavity radius derived from dust emission is AU, but some CO gas remains down to 20 AU or so (Piétu et al., 2007).
- Finally, MWC 480 is a Herbig Ae star of 1.8 surrounded by a Keplerian disk (Mannings et al., 1997; Simon et al., 2000; Piétu et al., 2007). CO isotopologues indicate a vertical temperature gradient. The disk continuum emission was resolved by Piétu et al. (2006), suggesting even lower temperatures for the dust than from 13CO, but Guilloteau et al. (2011) show that alternative solutions with radially varying dust properties are possible.
Section 2 presents the observations. The method of analysis and the results are shown in Section 3 and Section 4 is dedicated to the chemical modeling. We discuss the implications of our study in Section 5 and then we conclude.
| Source | Right ascension | Declination | Spec. type | Effective temp.(K) | Stellar lum.() | CO paper |
|---|---|---|---|---|---|---|
| MWC 480 | 04:58:46.264 | 29:50:36.86 | A4 | 8460 | 11.5 | 1,2 |
| LkCa 15 | 04:39:17.790 | 22:21:03.34 | K5 | 4350 | 0.74 | 1,2 |
| DM Tau | 04:33:48.733 | 18:10:09.89 | M1 | 3720 | 0.25 | 1,3 |
2 Observations
All the observations reported here were made with the IRAM Plateau de Bure interferometer (PdBI).
The CN J=21 observations of DM Tau were performed in Feb., Apr., Sep. and Oct. 1997 with baselines ranging from 15 m to 180 m. The spatial resolution (HPBW) was (PA ) for “natural weighting”. The HCN J=10 data were obtained in Nov. 1999, Jan. 2001 and Jan. 2002 with baselines from 15 to 330 m. The HPBW was (PA ) using natural weighting, and at PA for “robust” weighting.
The LkCa15 and MWC 480 data were observed in HCN J=10 and CN J=21 data in a track sharing mode, to obtain an homogeneous calibration for both sources. Baselines ranged from 15 to 330 meters, with an emphasis on short baselines: natural weighting yielded an HPBW of (PA ) and robust weighting an HPBW of (PA ) for CN, and proportionally larger by a factor 2.5 for HCN.
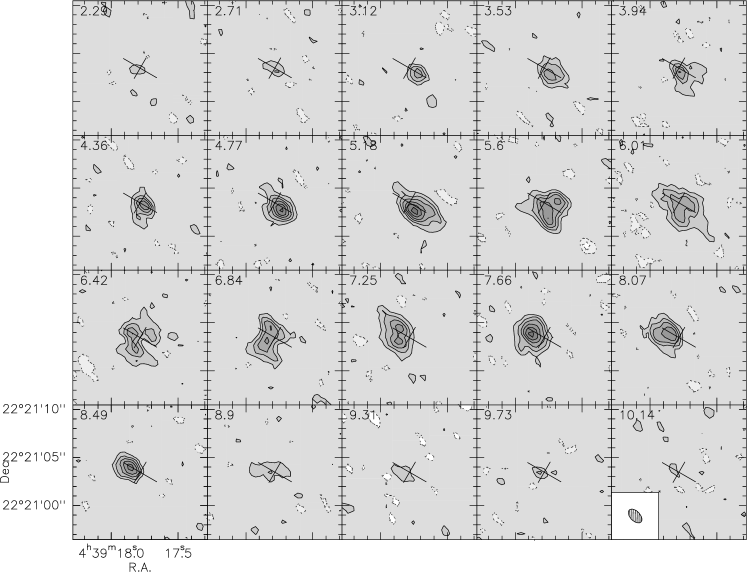
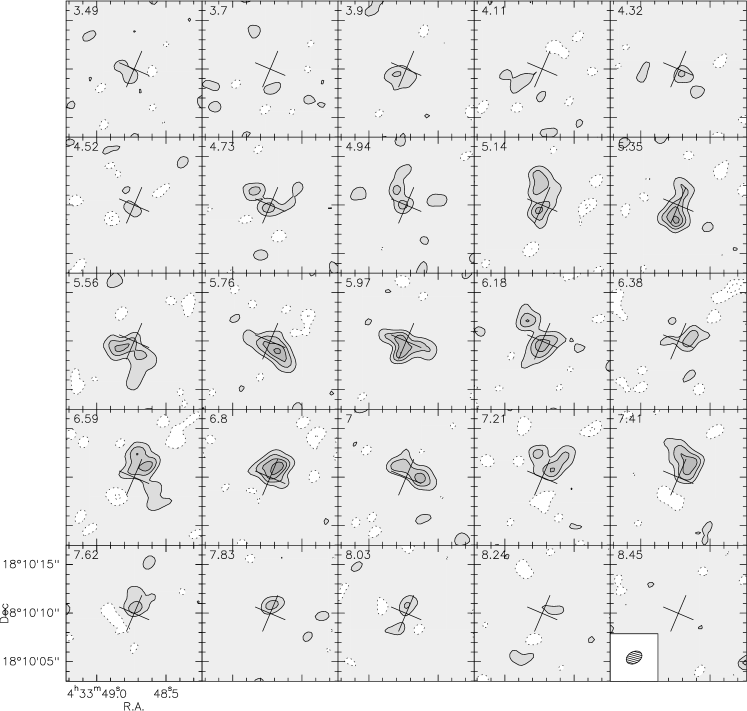
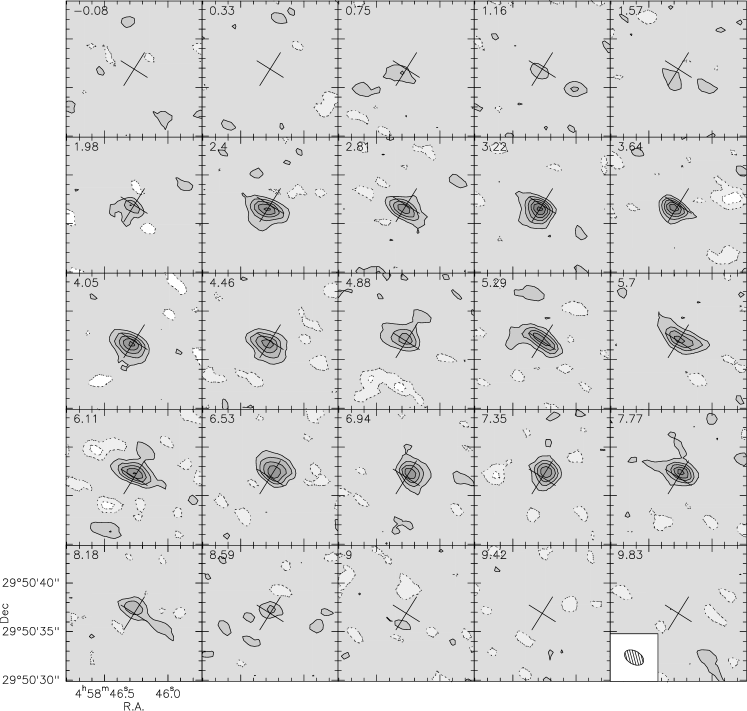
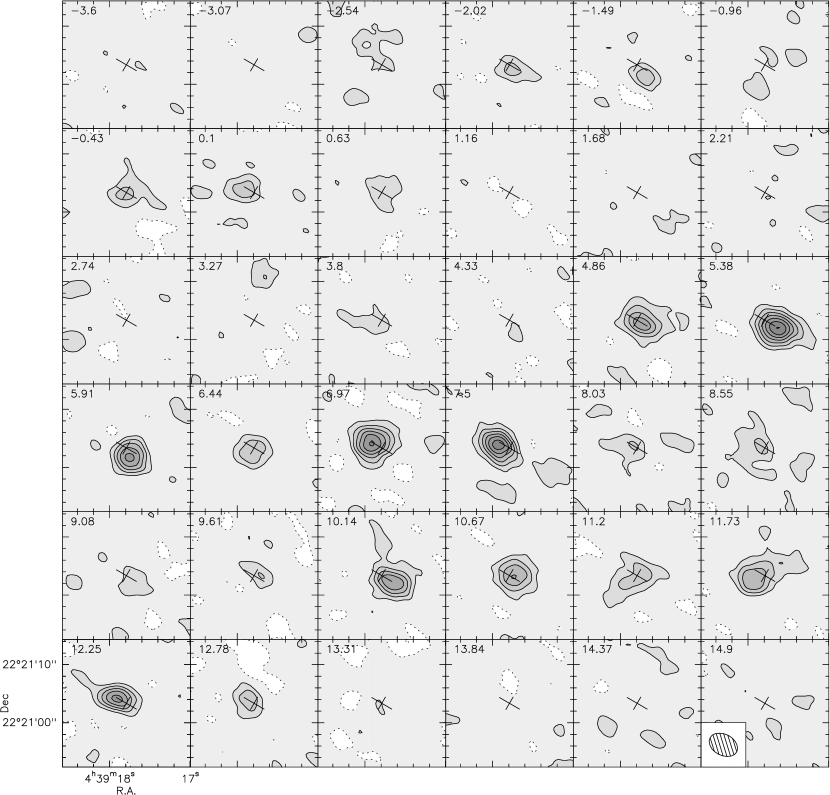
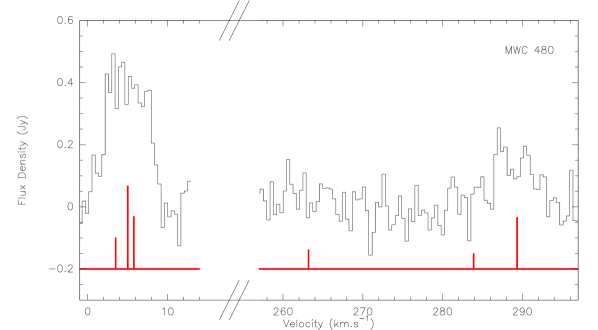
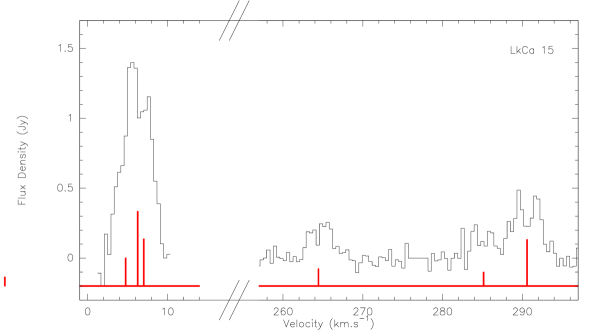
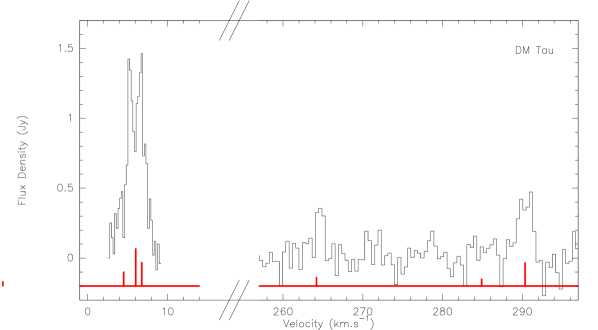
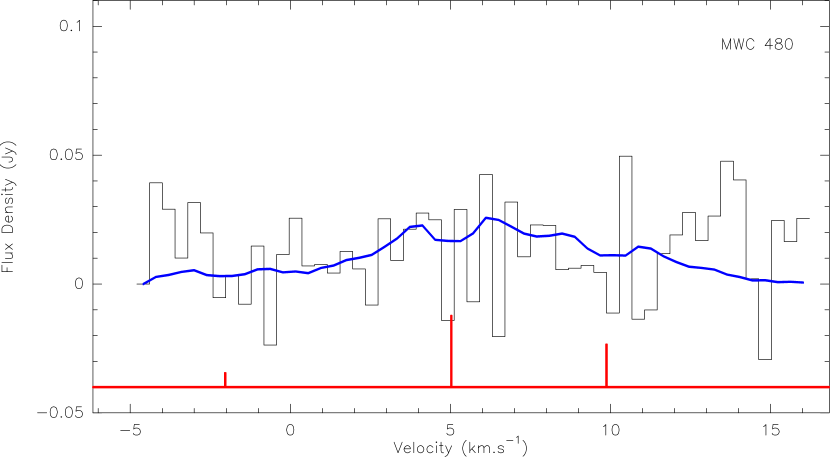
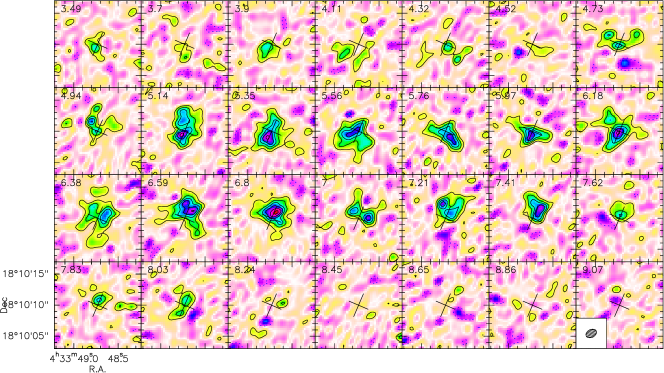
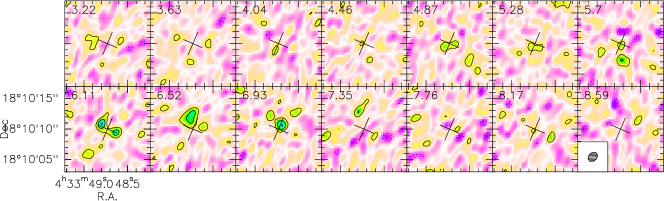
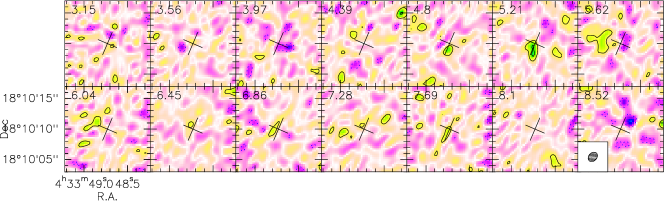
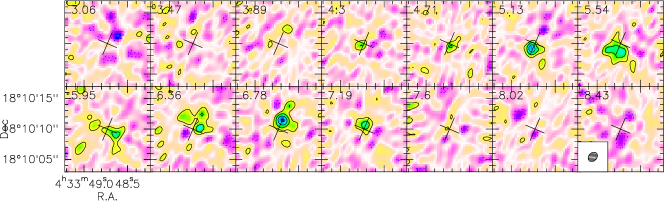
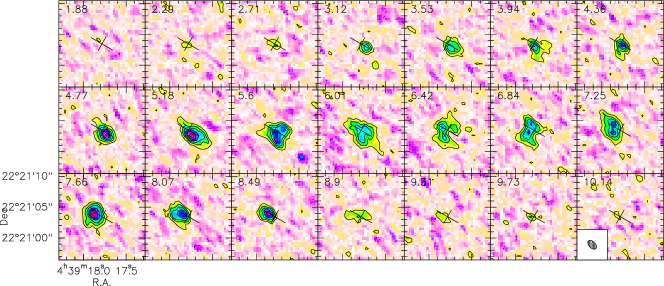
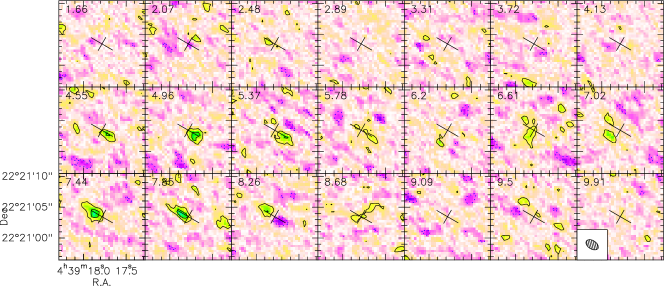
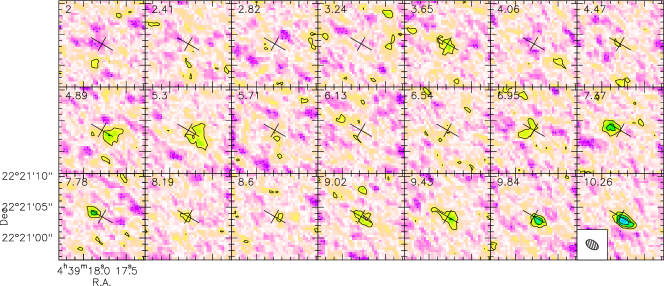
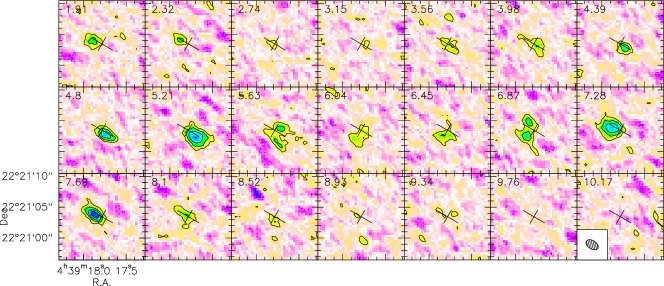
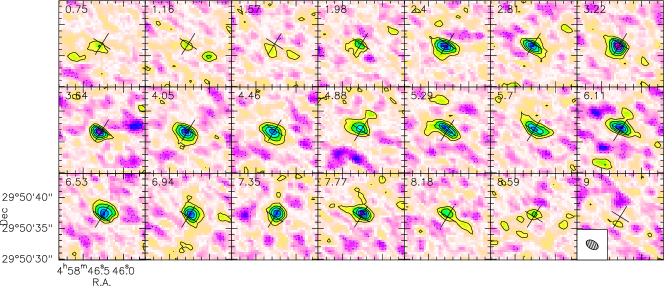
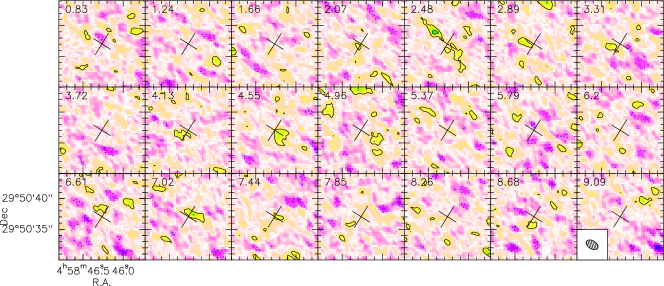
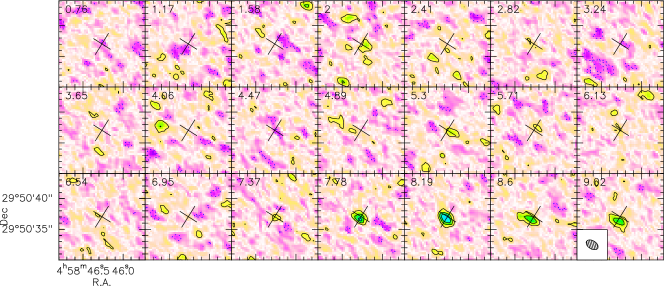
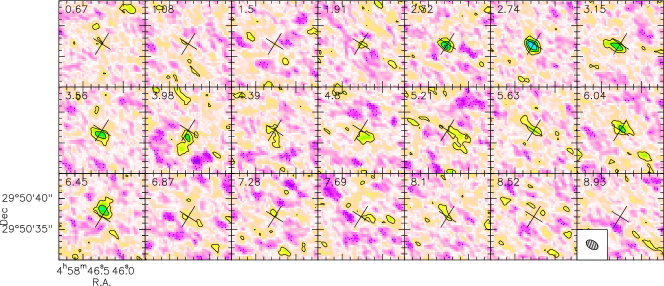
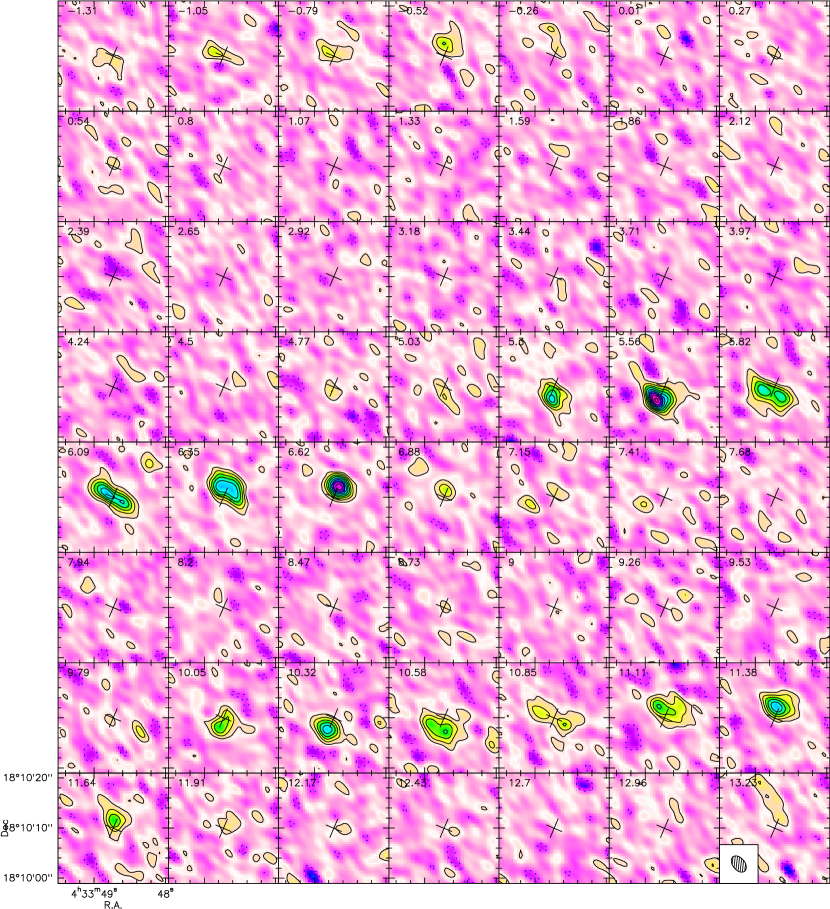
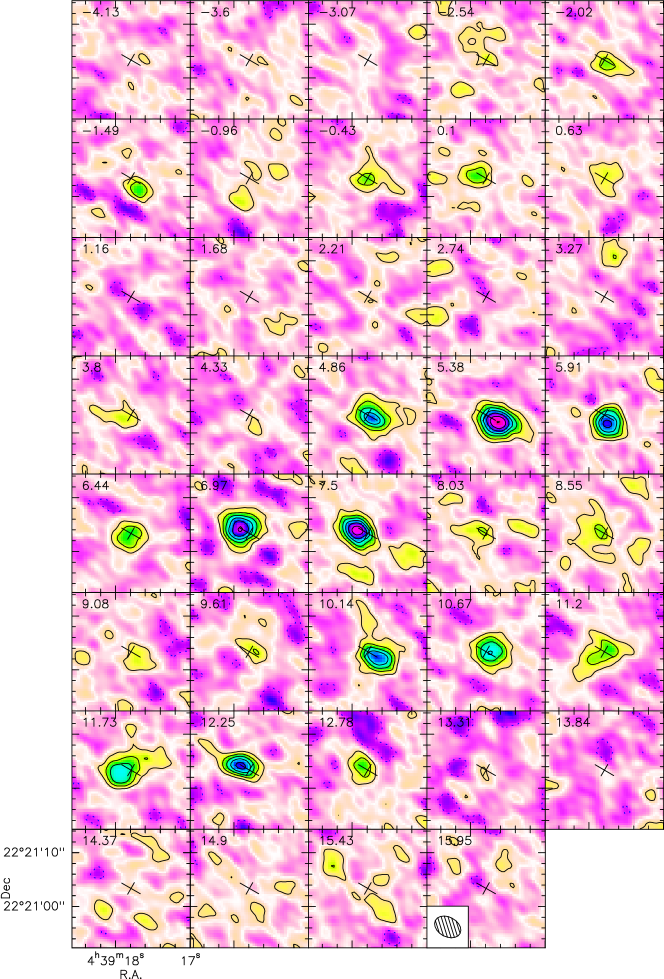
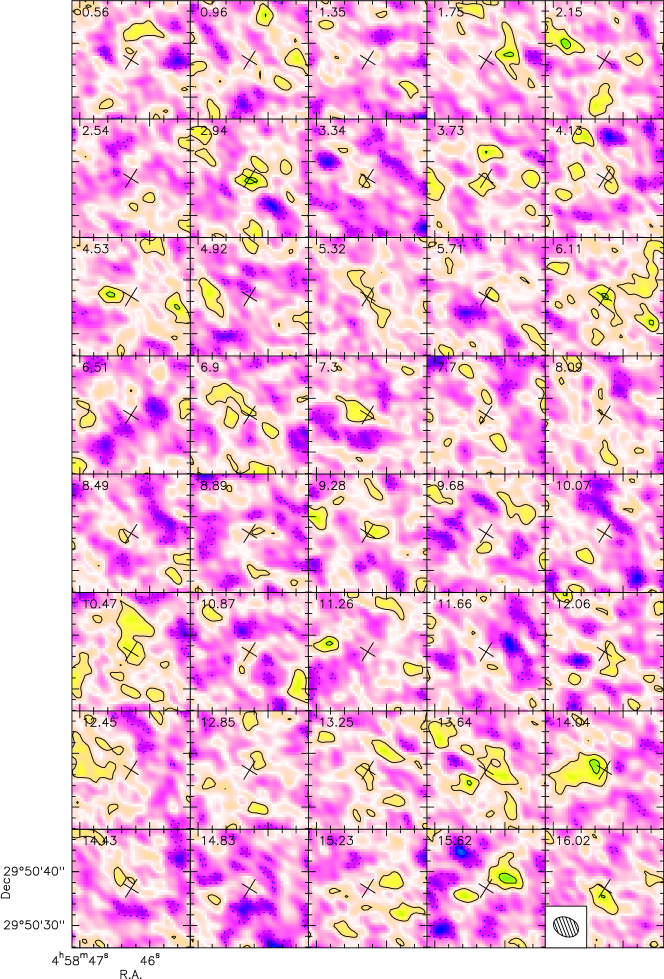
We used the GILDAS222See http://www.iram.fr/IRAMFR/GILDAS for more information about the GILDAS software. software package (Pety, 2005) for the data calibration and deconvolution, and as framework for the implementation our minimization method. The resulting velocity-channel maps in the HCN J=10 and CN J=21 lines are shown in Fig. 2 and 1) and the spectra integrated over the disk are presented in Fig. 4-3. In MWC 480, the HCN emission is weak, but significant at the level (see Fig.5). Channel maps for HCN in MWC 480 line are only presented in Appendix, which also includes a more complete set of channel maps for all sources, in particular those of the other observed CN hyperfine components. We caution that although the integrated spectra in Fig. 4-3 were obtained from the Clean images, they underestimate the flux. This is not due to the lack of short spacings, but to the difficulty of deconvolving channel per channel low signal-to-noise data when the synthesized beam has relatively high sidelobes. Furthermore, we stress that this imaging bias has no influence on our derived parameters, since all our analysis is based on a comparison between model visibilities and actual measurements in the UV plane. Additional channel maps for CN, and also HCN in MWC 480 reveal
Calibration errors could directly affect the derived temperature and molecular column densities. To minimize the calibration errors, all our flux density scale is based on a comparison with MWC 349, a source with precisely known spectral index of 0.6. In addition, as in Guilloteau et al. (2011), MWC 480 is strong enough in continuum to provide an additional comparison; the final relative flux scale accuracy is about 5%. Our flux density scale here is identical to that used by Guilloteau et al. (2011). However, recent re-calibration of the MWC 349 flux density at mm wavelengths indicate that this overall scale may be too low by about 10 % (Krips et al. in prep.).
LkCa 15
DM Tau
 MWC 480
LkCa 15
DM Tau
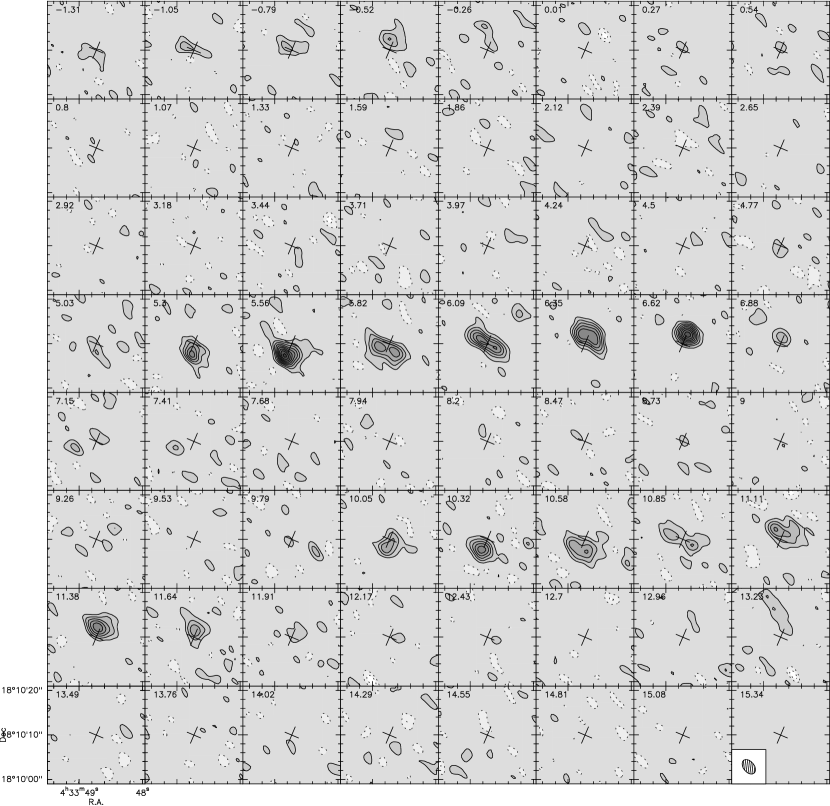
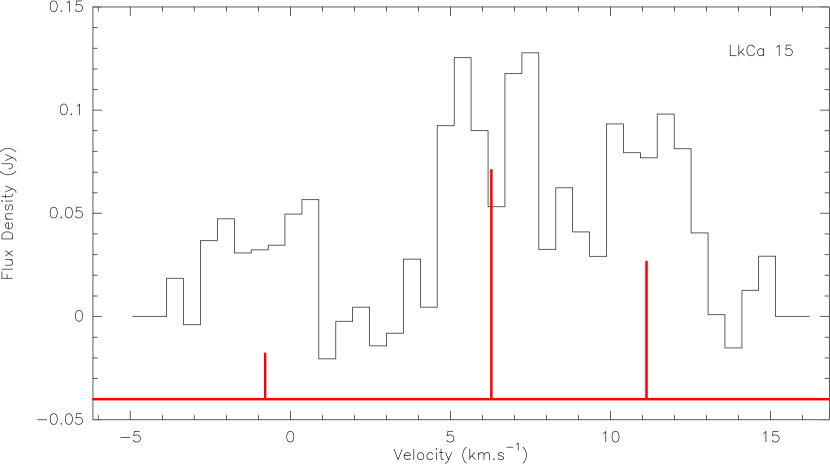
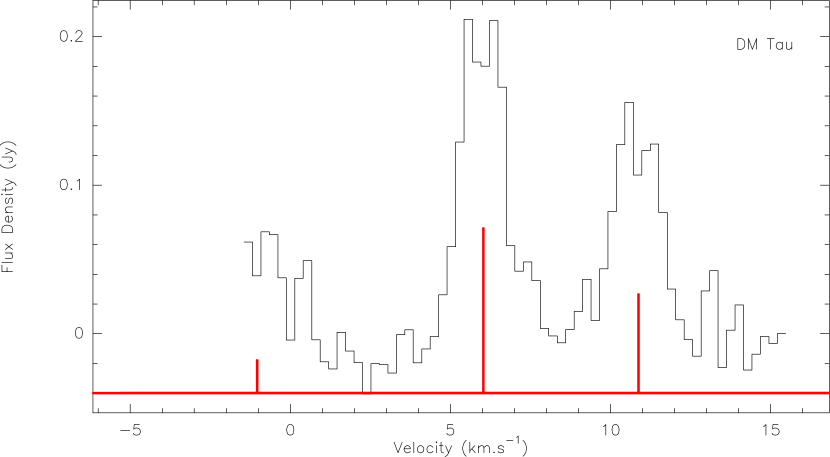
The velocity was smoothed to 0.41 in the cases of MWC 480 and LkCa 15 to produce the velocity-channel maps on Fig. 1 and to in the case of DM Tau. We used however full spectral resolution in the model fitting analysis described below: for CN(2-1), in LkCa 15 and MWC 480, and in DM Tau. For HCN(1-0), spectral resolutions were in LkCa 15, in MWC 480 and in DM Tau. The velocity scale is referred to the strongest hyperfine components, i.e. 226.874745 GHz for CN, and 88.631848 GHz for HCN
Prior to this paper, CN and HCN emission has been already detected in several T-Tauri and Herbig Ae stars (DM Tau, GG Tau; LkCa 15, HD 163296, MWC 480 and V4046 Sgr), but only with single-dish telescopes, hence at low spatial resolution (Dutrey et al., 1997; Thi et al., 2004; Kastner et al., 2008), except for the most nearby star TW Hya (Qi et al., 2008). A preliminary study of CN(2-1) and HCN(3-2) at resolution has been recently published by Öberg et al. (2010). The observations relevant to our sources are summarized in Table 2.
| Sν (Jy km s-1) | |||
|---|---|---|---|
| DM Tau | LkCa 15 | MWC 480 | |
| HCN J=1-0 | 0.4a | ||
| CN J=1-0 | 1.4a | - | - |
| CN J=2-1 | 8.7a/4.7c | 6.8c | 3.3c |
| HCN J=3-2 | 2.9c | 5.5c | 2.3c |
| CN J=3-2 | - | 12b | 5.3b |
| HCN J=4-3 | - | 4.6b | |
3 Method of analysis and results
Whereas the velocity-channel maps of Fig. 2 and 1) were produced from the dirty images via Clean-based deconvolution, the disk properties were derived directly from the observed visibilities through a model-fitting. For this, we used the disk model and hypothesis described in Piétu et al. (2007). We assume circular symmetry. The surface density of molecules follows in radius a power law of exponent ; perpendicularly to the plane of the disk, the density of molecules follows a Gaussian of half-width at 1/e intensity (scale height) . We further assume the population of each molecular species can be represented by a rotation temperature which depends only on and follows a power law of exponent . The disk is thus described by
| (1) | |||||
| (2) | |||||
| (3) |
plus a constant turbulent width and an inner and an outer radius. If the molecule is at LTE, is equal to the kinetic temperature.
3.1 Minimization technique
The minimization technique used to derive the disk parameters has been described by Piétu et al. (2007). The continuum emission was subtracted in the UV plane prior to the analysis, rather than being fitted simultaneously.
As explained by Piétu et al. (2007), temperature and surface densities can be derived by the minimization procedure from a single transition, even without hyperfine (hf) structure, under the assumption of power law distributions, provided the spatial resolution is high enough to partially resolve the optically thick core. This is because the shape of the radial dependence of the brightness changes when the line becomes optically thick, from in the optically thick region, to a function of surface density and temperature in the optically thin domain (e.g. at high temperatures). Lines with hf components yield additional information that may even allow to test the power law hypothesis.
Handling of the hf components in the modeling requires additional care. Under our assumption of common excitation temperature, the apparent hf intensity ratios should depend only on the line opacities. However, when comparing model and observations, limited spectral resolution and discrete velocity sampling may introduce a bias. First, the spectral backend delivers the flux integrated over a channel width, and not just sampled at the channel frequency. Second, the separation between the hf components is not an integer multiple of the velocity sampling. In the case of HCN, the intrinsic line widths are comparable to the channel resolution; then the difference between sampled and integrated values, combined with different sampling for each hf component, may change the predicted hf intensity ratios, which in turn leads to incorrect opacities and to erroneous temperatures and surface densities. We ensured that no such bias is introduced by comparing the results obtained directly from the disk model by using the same sampling in frequency as in the real data to those derived with a much higher sampling, followed by a smoothing that simulates the channel widths and center frequencies. We found almost no differences between the two sets of results, except for a very small (0.02 km.s-1) increase in the line width. The hf line intensity ratios were almost identical. In the case of CN, the intrinsic spectral resolution, 0.05 km.s-1, is small compared to the line widths.
In the minimization procedure, all HCN hf components were fitted together assuming a common excitation temperature. For CN, the hf components were used in the analysis in two ways: all together and the intrinsically strong and weak components separately. The 3 sets of results were then compared.
3.2 Analysis of CN and HCN lines
In a first step of the analysis, all geometric parameters of the disk were left free. The derived parameter values were in complete agreement with those derived by Piétu et al. (2007) from CO, but had a lower accuracy as the lines are weaker. Accordingly, we fixed the inclination and position angle of the disk, as well as the stellar mass and gas scale height using Piétu et al. (2007) values (see Table 3). For LkCa 15, we fix the internal radius to 38 AU, a compromise between the CO and dust inner radii from Piétu et al. (2006, 2007). In a second step only and (the value and exponent of the surface density law), , the outer radius, and (the value and exponent of the temperature law) and , the local line width of each molecule, were fitted.
In addition, as many chemical models predict all molecules should be frozen onto dust grains close to the disk mid-plane, we tested models in which the molecules are present only above the disk plane. We tested two different parameterizations. Parametrization (1) is a simple geometric constraint, in which molecules only exist above , with (the “depletion scale height”) being a free parameter, i.e. being the molecular abundance,
| (4) |
However, the chemical model of Aikawa & Nomura (2006) suggests that, in a given disk, molecular abundances depend essentially on the (molecular hydrogen) column density between the disk surface and the location in the disk. Thus, at large radii, molecules get closer to the disk plane than at smaller radii. As our measurements are most sensitive to the 150 – 400 AU region, assuming a constant as above may be inappropriate. We thus also considered a second option, where molecules are only present in the upper disk down a constant depth in (molecular hydrogen) column density, , the “depletion column density”, i.e.
| (5) |
which in the isothermal approximation yields
| (6) |
erfc being the complementary error function. This second option is likely to be more realistic, as it avoids placing molecules far off the plane at large distances. Note that corresponds to being large (equal to the H2 column density).
3.3 Results
| Source | Molecule | |||||||
|---|---|---|---|---|---|---|---|---|
| ( cm-2 ) | (AU) | (km s-1) | (K) | |||||
| MWC 480 | HCN 1-0 | [550] | [30] | [0] | ||||
| CN 2-1 (strong) | [0] | |||||||
| CN 2-1 (weak) | [0] | – | ||||||
| CN 2-1 (all) | [0] | – | ||||||
| LkCa 15 | HCN 1-0 | |||||||
| CN 2-1 (strong) | ||||||||
| CN 2-1 (weak) | – | |||||||
| CN 2-1 (all) | – | |||||||
| DM Tau | HCN 1-0 | |||||||
| CN 2-1 (strong) | ||||||||
| CN 2-1 (weak) | ||||||||
| CN 2-1 (all) |
The disks of the two T Tauri stars, DM Tau and LkCa 15, display very similar properties (see Table 4). Both show very low CN and HCN rotation temperatures, and their strongest hf line components have moderate optical depth around 100 to 300 AU. The fit to the weakest, optically thinner, CN hf components yields a nearly flat surface density distribution and the fit to the stronger hf components a much steeper one. As a consequence of our single power law hypothesis, the temperature distributions follow the opposite trend, i.e. the temperature decreases faster for increasing for the optically thin lines. Such a behavior may indicate that the single power law is not an appropriate representation of the CN distribution and that the density falls down faster in the outer parts of the disk (which are hardly detected in the weaker components) than in the inner parts. A close examination of the shape of the surface, as a function of the exponents and , indeed reveals for the strong hf components a broad, curved and relatively shallow global minimum, with two local minima that correspond to the two (flat and steep) solutions just described.
We attempted fitting all components with a model including two power laws (crossing at some radius ), but did not find any sensibly better results: in most cases, the fit converged towards one of the two single power laws already identified. The rotation temperatures derived when varying remained within the range of temperatures allowed by the single power-law fits as listed in Table 4.
Within the hypothesis where molecules are only in a surface layer, the depletion parameter can be constrained from the observations (see Semenov et al., 2008), the distribution of molecules being reasonably well described by two thin disks with slightly different inclinations, so that their projected kinematic patterns differ. We find ( for the more sensitive CN measurements – see Table 4), indicating that the detected molecules are most likely concentrated close to the disk plane.
For the second approach, we must provide the underlying H2 density profile. We assumed two different disk models for the H2 density based on the analysis of the millimeter continuum emission performed by Guilloteau et al. (2011). The first is a power law distribution; however, although the millimeter continuum emission indicates outer radii of 200-300 AU, we extrapolate the H2 surface density up to 800 AU, which leads to a model with unlikely high densities at large radii. The second one uses the exponentially tapered solution of self-similar viscous evolution. Both solutions have similar surface densities near 100 AU, but differ in the outer parts, i.e. beyond 200-250 AU. The H2 surface density is about cm-2 near 100 AU. It decreases as for the power law model, while the exponential taper leads to much steeper decline beyond 300 AU. For CN, the derived “depletion column density”, is somewhat dependent on the disk model. For DM Tau, we find cm-2 for the power law, and cm-2 for the viscous model. In the former case, the error is highly asymmetric: the 3 and 4 lower limits are : and cm-2 respectively.
For the Herbig star (MWC 480), the sensitivity of our observations is not good enough to derive both and . Nevertheless, assuming a slope , a value of K is fitted for the CN emission. That is in accordance with the expected kinetic temperature of the molecular layer in the theoretical models. Using instead results in a temperature K, but affects neither the derived surface density (by less than 5%), nor the exponent (by less than 0.1). This is because in the 10 - 30 K temperature range, the CN J=2-1 line brightness is weakly dependent on the temperature (see Dartois et al., 2003, their Fig. 4, given for CO but also applicable to CN). For HCN, which has low signal-to-noise ratio, we assumed the same temperature (, K) and outer radius than derived from CN. Although arbitrary, this choice is justified by the results found for DM Tau and LkCa 15, where CN and HCN display similar rotation temperatures and outer radii.
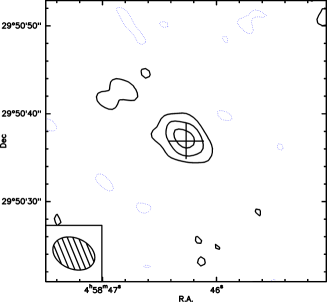
The detection of HCN in MWC 480 is not easily illustrated, because the line intensity is spread over the three hyperfine components of the J=1-0 line. The best fit profile is shown in Fig. 4. Fig. 5 shows a signal-to-noise image obtained using the optimal filtering as described by Dutrey et al. (2007), i.e. weighting each channel by its modeled integrated intensity prior to averaging in velocity. There, the peak signal-to-noise is around 6, and clearly points toward the MWC 480 star, thereby showing unequivocally the reality of the line emission from HCN.
All temperatures may be increased by 10% to account for the calibration issues mentioned in Sec.2. An effect of similar magnitude, although not as linear as for the temperature, is expected on the molecular surface densities. However, the calibration uncertainties do not affect , , , or , which depend only the shape of the brightness distribution.
4 Chemistry modeling
| Element | abundance |
|---|---|
| C | |
| O | |
| N | |
| Mg | |
| S | |
| Si | |
| Fe |
Generic chemical models of circumstellar disks have been published by Aikawa & Herbst (1999); Willacy & Langer (2000); Aikawa et al. (2002); van Zadelhoff et al. (2003); Aikawa & Nomura (2006); Willacy et al. (2006); Fogel et al. (2011). Each of these works introduce a different degree of complexity. Aikawa & Herbst (1999) consider gas phase chemistry, plus sticking and desorption, and assumed a vertically isothermal disk model following the ”Minimum Mass Solar Nebula” extended to 800 AU. The study from Willacy & Langer (2000) uses the thermal structure derived from the Chiang & Goldreich (1997) two-layer approximation, as well as enhanced photodesorption yields following Westley et al. (1995). Aikawa et al. (2002) used a D’Alessio disk model including vertical temperature gradients and self-consistently variable flaring, although dust and gas are assumed to be fully thermally coupled. All three models used a 1+1D approximation for radiative transfer, in which the stellar UV is attenuated along the line of sight to the star, while the ISRF impacts isotropically on the disk surface. van Zadelhoff et al. (2003) improved the UV treatment, by using a 2-D radiative transfer code to solve for the UV field inside the disk, as Fogel et al. (2011). Shielding by H2 is treated in an approximate way, however. Aikawa & Nomura (2006) further expanded the models by considering the effect of grain growth and Fogel et al. (2011) investigate the effects of dust settling following the prescription by D’Alessio et al. (2006). With the exception of Fogel et al. (2011) and Willacy et al. (2006), none of these models include any grain surface chemistry, which may be important in such environments. However, all of them predict that CN is constrained to a warm molecular layer, sometimes well above the disk plane, and that molecules are depleted in the disk plane. The column densities of CN and HCN do not vary much with radius. For a more direct comparison with with our results, we fitted the column densities predicted by the chemical models by power laws as function of radius, i.e. we derived and .
The model from Willacy et al. (2006) is somewhat different, as it also includes turbulent diffusion, and will be discussed later. A more elaborate set of grain surface chemistry has been included by Walsh et al. (2010), who also find similar layered structure.
Existing chemical models are not necessarily tailored to the sources we have observed. To better understand the impact of some unknown properties of the observed disks (e.g. UV flux, mass, dust size), we performed new chemical network calculations. The objective of these calculations is not to find an appropriate model for each of the observed disks, but to illustrate common properties of disk chemical models, and pinpoint the dependency between the disk parameters and the predicted molecular column densities. We focus here on CN, which is predicted to be formed mainly in the “warm” photo-dissociation layer, where chemical reactions are fast. This allows us to use a time-independent chemical model, rather than a more computer-intensive time dependent one, as would be needed for molecules formed deeper in the disk.
4.1 PDR code
We use the PDR code from the Meudon group (Le Bourlot et al., 1993; Le Petit et al., 2006) modified to account for a non uniform grain size distribution (see Chapillon et al., 2008). The chemical model assumes a one-dimensional stationary plane-parallel slab of gas and dust illuminated by an ultraviolet (UV) radiation field. The radiative transfer in the UV takes into account self and mutual shielding of H, H2 and CO lines and absorption and diffusion of the continuum radiation by dust grains in a 1-D geometry. Molecular abundances and, optionally, thermal balance of the dust grains and the gas are calculated iteratively at each point in the cloud. The chemical network is similar to that of Goicoechea et al. (2006). The chemical model does not consider the freeze-out of atoms and molecules onto grains and surface chemistry reactions, to the notable exception of those leading to the formation of H2.
The assumed grain size distribution is a standard power-law , where and are the maximum and minimum cutoff radii, respectively. The introduction of a range of grain sizes affects the UV extinction curve, the rate of H2 formation and the thermal balance of the gas. The resulting extinction curve is calculated using the Mie theory for homogeneous isotropic spherical particles. The composition of the dust is 50% silicate and 50% graphite. We assume (the value observed in nearby interstellar clouds) and nm in all calculations. This minimum grain radius nm is chosen small enough to properly account for the photoelectric heating process, the UV extinction, and the formation of H2.
Keeping the dust mass constant, we have simulated grain growth by varying the maximum radius (0.3m – 0.1mm) while keeping the exponent constant for the sake of simplicity. The amount of small grains therefore is reduced to the benefit of large grains, modifying accordingly the extinction curve. With kept constant, the UV opacity scales as for m (see Chapillon et al., 2008).
The chemistry code is one-dimensional and calculates the temperature, radiation field and molecular abundances in the direction perpendicular to the surface, that we assume here perpendicular to the disk plane. The justification for such an approach is that small dust grains in the upper disk atmosphere scatter (half of) the incident UV flux towards the disk. We mimic the second dimension by resuming the calculation at different disk radii (12 to 15 different radii from 50 AU to the external radius Rout), the output being a 1+1D model (see Chapillon et al., 2008, for more details).
4.2 Set of PDR models
We explore a range of parameters to understand the effects of UV field intensity, grain size and cosmic ray ionization rate. Three basic disk models (with different density and temperature structure) are used to represent the 3 sources DM Tau, LkCa 15 and MCW 480. The input disk structure is similar to those of D’Alessio et al. (1999). The density and (dust) temperature distributions were computed self-consistently from the disk masses and stellar properties of each source by D.Wiebe & D.Semenov (private communication) assuming uniform grain size of 0.1m; the disk models display a vertical temperature gradient, the temperature increasing with height (e.g. Chiang & Goldreich, 1997). Except when otherwise noted, we assumed the gas temperature to be equal to the dust temperature. The elemental abundances used are given in Table 5.
 |
 |
|
 |
 |
|
 |
 |
|
 |
 |
|
 |
 |
 |
 |
|
 |
 |
|
 |
 |
|
 |
 |
|
 |
 |
For each disk, we vary several parameters.
Grain distribution: We have simulated grain growth by varying the maximum radius : in the “big grains” case =0.1 mm, in the “small grains” case =0.3 m.
The incident UV field Illuminating the disk surface is the sum of the interstellar UV field (ISRF, due mainly to the surrounding massive stars) and the stellar UV field coming from the central star. T-Tauri spectra present strong UV excess due to shock accretion of material onto the star. This UV field is assumed to follow the shape of an ISRF Draine field with an intensity scaling factor at 100 AU. The UV field decreases with increasing radius as . According to Herbig & Goodrich (1986) is appropriate, but Bergin et al. (2003) find a much lower value, . Using the measurements from Bergin et al. (2003), Henning et al. (2010) derived UV fluxes for DM Tau (), LkCa 15 () and MWC 480 () (see their Table 1). Accordingly we explore the range and run also some additional models with to see the impact of the stellar UV field intensity on the CN/HCN chemistry.
In addition, a couple of models were run for DM Tau with the photodissociation rates calculated without UV excess, but for a black body at 4000 K using rates from van Dishoeck et al. (2006). Results are presented only in Fig. 8.
The Cosmic Ray ionisation rate (CR): We performed calculations with the standard value of s-1 and with an increased rate of s.-1.
Physical structure: In addition to the values intrinsic to the basic disk models, we vary the density (by a factor of 3) and the temperature (by %) around those values. In the later case, the scale height is not recomputed, but kept equal to that of the basic model.
The thermal balance was computed only at R=300 AU in a few models (those presented on Fig. 10), the incident UV field being the main energy source. The dust temperature was derived following Burton et al. (1990) and used to compute the energy exchange between the gas and the grains, as described in Burke & Hollenbach (1983). The gas temperature is then calculated, taking into account heating and cooling processes (see Le Petit et al., 2006, for more details). Again, the scale height is that of the basic model and is not modified consistently.
Ly line: Bergin et al. (2003) pointed out the possible importance of the Ly line on the chemistry. Essentially, HCN can be photo-dissociated by Ly radiation while CN cannot. As the Ly line can be very strong in the spectra of T-Tauri (carrying up to a few 10% of the UV energy), this affects the photodissociation rate, and thus the CN/HCN chemistry. To test the influence of Ly radiation, we implemented its impact on the chemistry following van Dishoeck et al. (2006), and ran a few models in which the Ly line represents 1/3rd of the total UV luminosity.
Unless otherwise specified, the model parameter values are as follows: =0.3m (i.e. small grains), a ISRF UV field with and no Ly included, CR=s-1, nominal density and temperature and no thermal balance calculated.
4.3 PDR modeling results
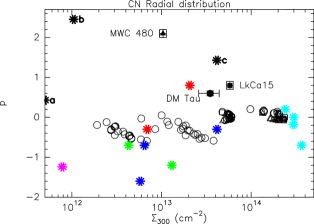
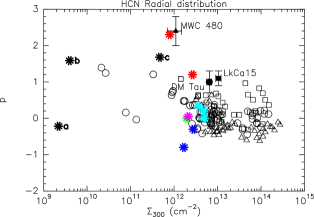
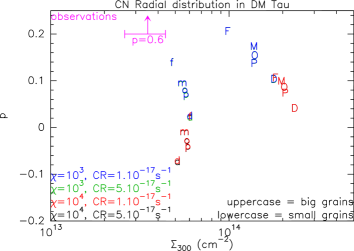
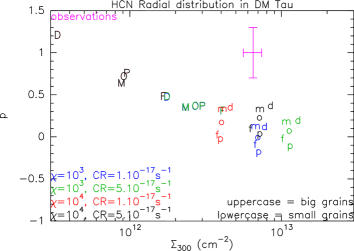
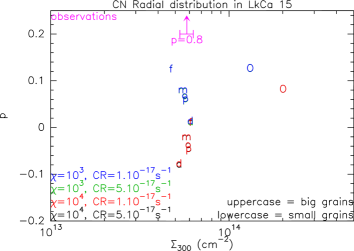
The column densities predicted by the chemical model are fitted by power laws as functions of radius, and are thus characterized by the values of the and , like for the observations. Power laws offer fairly good approximations to the resulting distribution of column densities.
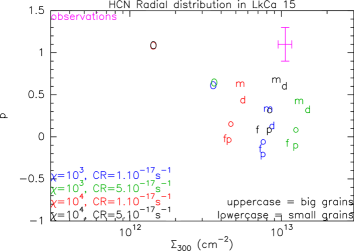
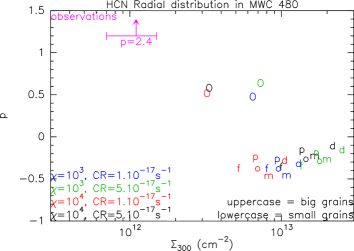
The calculated and as a function of the various input parameters are illustrated for DM Tau in Fig. 6 for CN and Fig. 7 for HCN. The impact of the model parameters is shown in a more compact form for all sources in Fig. 19. A comparison with other chemical models, fitted in the same way, is displayed in Fig. 8 together with the observed values.
The main results are:
- The calculated column densities (at 300 AU) match reasonably well the
observed values (within a factor of a few for the best set of parameters), but the radial
dependence (see parameter ) is weaker in the models ().
- The most influential parameters are the UV flux and the grain sizes. These two parameters control the
photodissociation process.
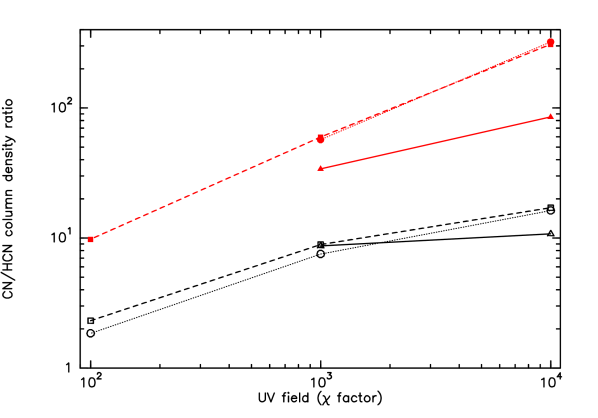
- As a consequence a high CN/HCN ratio is observed for large grains.
- A modification of the CR influences the HCN/CN chemistry only in the case of
small grains, i.e. when UV penetration is efficiently blocked.
- Despite the lack of molecule freeze out and grain chemistry, our PDR code results for
CN and HCN are in broad agreement (flat radial distribution and similar value of column densities within a factor of a few)
with published results of models that take these processes into account (see
Aikawa & Herbst (1999, Fig. 7–9), Aikawa et al. (2002, Fig. 3), van Zadelhoff et al. (2003, Fig. 5
and 8), Aikawa & Nomura (2006, Fig. 9)). This suggests that the freeze-out of molecules onto grains, as implemented in these works, does not affect significantly HCN and especially CN, which remain
dominated by photo-chemistry in these models. Note, however, that Walsh et al. (2010) find out the
grain surface chemistry decreases the HCN column density, but only mildly affect CN.
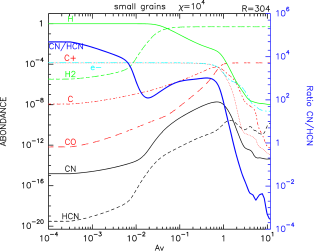
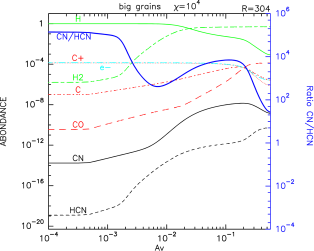
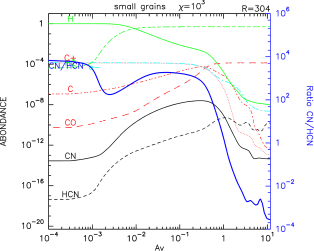
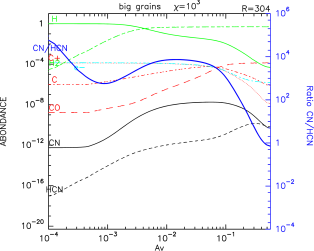
As in the other chemical studies, the CN molecule is located within a narrow layer close to the surface (A0.1 corresponding to z AU (ncm-3) in the small grain case and z AU (ncm-3) in the big grain case) whereas HCN is buried more deeply inside the disk. The vertical distribution of molecules at AU are presented in Fig. 20 for small and big grains and two different values of the incident UV field. As we do not include sticking onto grains, HCN remains fairly abundant in the mid-plane contrary to models including sticking onto grains where HCN is not present under 0.1 (e.g., Aikawa & Nomura, 2006).
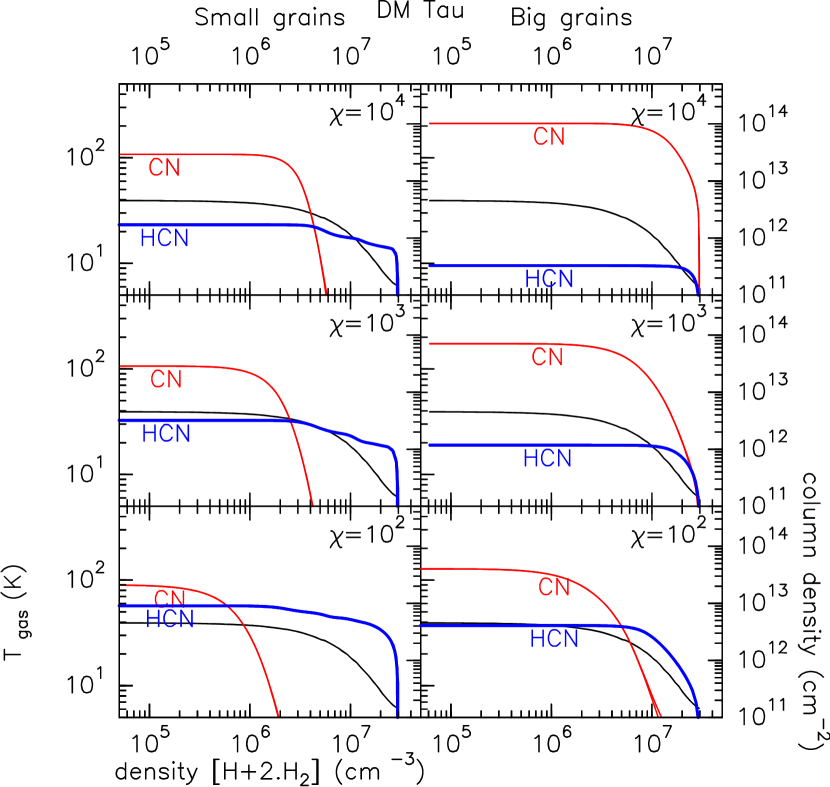
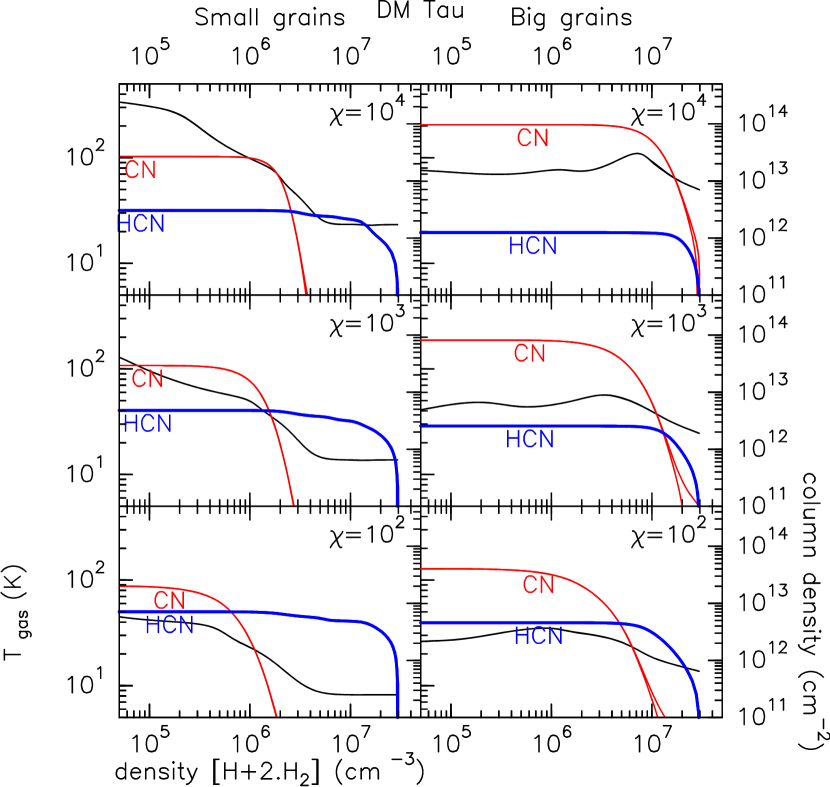
Relative abundances can be a misleading indicator of the location of the bulk of molecules, because of the strong vertical density gradient. To better indicate where molecules appear, we trace in Fig. 9 the cumulative column density from the disk mid-plane to the surface as a function of the gas density. The latter can be converted into height above the disk mid-plane using the vertical distribution. The temperature (which, in this model, applies equally to gas and dust) is also displayed. Fig. 9 shows the temperatures and densities at which the bulk of the column density is built up, allowing to predict what is the average line excitation temperature. For essentially all models the CN column density is mostly build up in a region where the kinetic temperature is 30 K and at a density , the only exception being the small grains, low UV () case, where only half of the CN column density is in these conditions.
Similar results are obtained in models for which the gas and dust thermal balance is computed: the vertical distributions of CN and HCN abundances are not significantly affected, although the gas temperature is in general somewhat higher in this case (Fig. 10). The chemistry is not significantly affected because most reactions depend weakly on the temperature in this temperature range.
5 Discussion
The results from our power law model fitting of the observations of the T-Tauri stars DM Tau and LkCa 15 appear to contradict the chemical model predictions on several aspects.
-
1.
While 12CO indicates temperatures in the range 20 to 30 K at 100 AU for the upper layers (Piétu et al., 2007), the derived CN and HCN rotation temperatures, which apply mainly to radii 100-300 AU, where our observations are the most sensitive, are very low (8 to 12 K, including calibration errors).
-
2.
In addition, the constraint on (equivalent to large ) suggests that CN molecules appear closer to the disk than expected. This is coherent with a low temperature but in apparent contradiction with the location of the predicted molecular layers.
-
3.
Most models predict slopes which are much lower than observed; the main exception being the results of Aikawa & Herbst (1999) for CN.
For the Herbig star (MWC 480), the temperature may be adequate, but the slope problem remains. This leads to several open questions :
-
1.
Do we understand the basic physical structure (density, temperature) of protoplanetary disks correctly ?
-
2.
How a misleading structure can affect the line formation ?
-
3.
Do we understand the chemistry, in particular that of CN well enough ?
5.1 Excitation conditions
CN is not the only photo-dissociation sensitive molecule displaying surprising low excitation temperatures. From a spatially resolved, two-transition study, Henning et al. (2010) found that C2H display the very same behavior, which cannot be represented with current chemical models. While for CN the debate remains possible, the chemistry of C2H is relatively well known, so the coincidence points towards a general problem to retain molecules at low temperatures in proto-planetary disks.
In all chemical models, HCN is formed closer to the mid-plane than CN, at densities largely sufficient to thermalize the HCN J=1-0 transition ( cm-3, Guilloteau & Baudry (1981); Monteiro & Stutzki (1986)) The HCN excitation temperature derived from our observations is then expected to reflect the kinetic temperature of the disk mid-plane in the region where the J=1-0 line is optically thick, that is up to about 150 AU in DM Tau and LkCa 15. The values derived from the observations are K for DM Tau and K for LkCa 15, the excitation temperature for MWC 480 remaining unconstrained. CN, on the other hand, is expected to be mainly formed (at least largely formed) in the upper layer, close to the disk surface. Although the overall finding that CNHCN in both sources is in qualitative agreement with this expectation, the observed values are surprisingly low.
From Fig. 9, for all models with small grains, 80 % of the CN column density builds up in a region where the kinetic temperature is 30 K. Furthermore, 50 % of this column density originates from regions where the density is at least , and CN is not present at all for densities exceeding about , i.e. below 2 scale heights. This is in contradiction with the observations which indicate that the bulk of CN is near the disk plane ( at the level).
While all published disk chemical models clearly have high CN abundances only at large heights, deriving the densities and temperatures at which the bulk of the CN column density is built is often not possible, as most studies focussed more on the general behavior of the chemistry than on detailed line emission prediction. Nevertheless, we note that Walsh et al. (2010) only have substantial amount of CN for K and cm-2, at rather large z/r, as in our model.
The comparison with other transitions, CN(1-0) and CN(3-2) show that for MWC 480, our model predict a stronger CN(3-2) line (9.0 Jy.km/s) than observed. This can be ascribed to partial sub-thermal excitation for this transition, as its critical density is cm-3. For DM Tau, our predictions for the CN J=1-0 agree with the observations of Dutrey et al. (1997), but there is no published data on the CN(3-2) line. For the disk of LkCa15, our best fit model underestimates by 30 % the line flux of the CN(3-2) line. Raising the rotation temperature to about 25 K brings the predicted line flux in better agreement for this transition. This suggests that a fraction of the CN molecules lie in a warmer (and dense enough) temperature region. However, although the exact collision rates for CN with H2 are unknown, the densities are high enough to be close to thermalization for the observed lines, and it is likely that , so explaining temperatures below 15 K by significant sub-thermal excitation appears difficult.
5.2 Surface densities of CN and HCN
A general prediction of all chemical models is that the surface densities of CN and HCN are nearly constant as a function of radius . The observed slopes are larger, , and the separate hyperfine CN analysis even suggests a steepening of the surface density distribution at larger radii. Furthermore, changing the model disk mass to 1/3rd or 3 times the nominal value only changes the surface density of CN and HCN by about 10-20 % (see Fig. 6, 7 and 19).
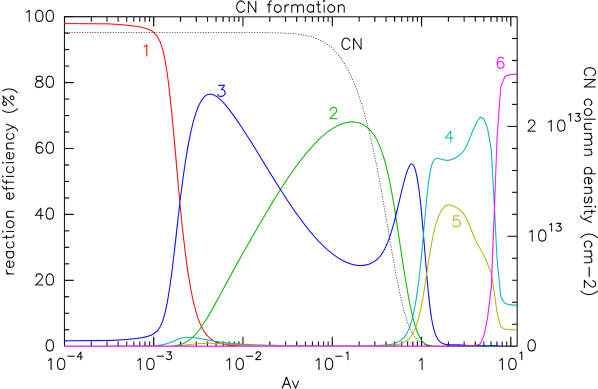
Bergin et al. (2003) showed that Ly radiation significantly affects the relative photodissociation rates of HCN and CN. In our model, the impact of the Ly line on CN is quite small. This is because the direct production of CN from the photodissociation of HCN () is not in general the main production path of CN. Figure 12 presents the main chemical reaction leading to the formation of CN at a radius of 304 AU. Photodissociation of HCN is the most efficient CN production mechanism only in a small region with high HCN abundance. Upwards in the disk, the main CN formation reactions are and , so that the overall abundance of CN is controlled by the abundance of atomic Nitrogen. However, HCN decreases with Ly intensity, so that the CN/HCN ratio depends on the Ly flux (as also found by Fogel et al., 2011). We find however that the effect is very small when dust is composed of small dust grains. With large grains, the HCN column density is divided by a factor for a Ly line contributing to 1/3rd of the UV luminosity. This is consistent with the Fogel et al. (2011) results where the effect is of Ly is visible only for settled grain models (i.e. models with a reduced UV extinction in the upper layers, as for large grains).
Finally, PDR models also predict that the CN/HCN ratio increases with grain size because large grains allow UV flux to penetrate deeper in the disk. This effect is illustrated in Fig. 11. The high CN/HCN ratio (4 to 10 at 300 AU) in the three sources is in agreement with the presence of large grains in the three disks. On the other hand, Aikawa & Nomura (2006) results suggest a rather weak dependency of the CN/HCN ratio on the grain sizes. However, this study explored much bigger grain sizes than we do here, but the differences between their 10 m and 1 mm case is similar to our findings. Walsh et al. (2010) also found that the CN/HCN ratio increases when surface chemistry is included, as Nitrogen can be incorporated into larger molecules in the disk mid-plane.
5.3 Toward a cold molecular Layer ?
We investigate here mechanisms which would partially provide cold molecular material close to the mid-plane.
5.3.1 Large grains
Grain growth can bring molecules closer to the disk mid-plane, by allowing UV radiation to penetrate deeper in the disk structure. Fig. 9 also indicates that the only case in which CN is produced in sufficient quantities at low temperatures is the high UV (), big grains mm case, where 50% of the CN column density builds up at temperatures below 10 K, and the rest between 10 and 20 K. However, neglecting freeze-out and surface chemistry in this case is unlikely to be valid. Moreover, in this case, the disk temperature and density structure was imposed a priori, and is not consistent with the impinging UV field and its attenuation. If, using the same density structure, we compute the thermal balance assuming the incident UV field is the only heating source, the picture changes completely (Fig. 10). The whole gaseous disk becomes warm, the minimum temperature being 60 K. Furthermore, 90 % of the CN column density is build up at densities above 106 cm-3, thus sub-thermal excitation becomes also unlikely.
Enhanced photo-desorption would bring larger amounts of (cold) CN, HCN and C2H near the disk mid-plane. Willacy & Langer (2000) checked this possibility using moderate grain growth but it does not provide enough cold gas. Doing the same calculation within larger grains appears however as an interesting clue to partially reconcile observations and models.
5.3.2 Turbulent mixing
Turbulent transport could bring CN and C2H formed in the warm upper layers down to the disk mid-plane, where they would cool very quickly. The main difficulty is to avoid sticking onto cold dust grains. Hersant et al. (2009) explored this for CO molecules, and found that turbulent diffusion does not affect much the total amount of CO, but could bring a small fraction of it to low temperatures. Willacy et al. (2006) managed to get a substantial amount of CN towards the disk plane, but only using a large diffusion coefficient, cm2.s-1, which is 10 times larger than expected from our current estimates of the viscosity ( viscosity parameter below 0.01) in disks. We note however that the model predictions are (at least for CN) not too far from the observed column densities. The low mixing efficiency, which is a result of dilution (the gas density in the upper layer being small in comparison with the disk mid-plane, see also Semenov et al., 2006)) may thus not be a major problem, as we only want to bring the existing CN molecules to low temperature regions, but not to increase significantly the total amount of CN.
5.3.3 Lowering the gas-to-dust ratio
In our resolved observations, is actually geometrically constrained by measuring the height above the disk mid-plane where the molecules are located; it is expressed as a column density by simply scaling to the total disk surface density (see Eq.6). When assuming cm2.g-1 (of dust) and a canonical gas-to-dust ratio of 100, the measured “depletion” column density, , appears – 10 times larger than predicted from chemical models (see in particular Aikawa & Nomura, 2006). Aikawa & Nomura (2006) also show that does not strongly depend on the grain size: so what controls the location of the CN layer (and those of other molecules) is essentially the column density of hydrogen towards the disk surface. Lowering the gas-to-dust ratio to 20 (or reducing the hydrogen surface density by a factor 5), we bring to first order the observed in rough agreement with the model prediction. In such a case, CN would be present in regions where the density is low enough (a few cm-3) to lead to substantial sub-thermal excitation.
We checked this possibility by using our PDR and radiative transfer codes in a disk 6 times less massive than our nominal assumption. The excitation is computed using the modified LVG approximation as described in Pavlyuchenkov et al. (2007) who also show that this is a reasonably accurate solution for the radiative transfer in disks. The collision rates for CN were assumed identical to those of HCN with He (Green & Thaddeus, 1974). For DM Tau, using the tapered edge surface density profile, we indeed find out cm-2, and a kinetic temperature of 15 - 20 K. Given the uncertainties on the collision rates, such a solution appears compatible with the expected temperature range in the molecular rich region. Such a low gas-to-dust ratio would also provide an appropriate explanation for the low temperatures also derived from C2H by Henning et al. (2010).
Unfortunately, with our chemical model, such low disk masses result in predicted HCN and CN column densities which are substantially lower than observed, so that this mechanism is not fully satisfactory to explain the observations. Imaging higher lying transitions, which have higher critical densities than the J=2-1 line observed here, could give more accurate constraints.
Note that, rather than changing the gas-to-dust ratio, raising the mm wave dust absorption coefficient by a similar factor is also a strictly equivalent alternative, and leads to the same low disk masses ( for DM Tau). However, our assumed value of cm2.g-1 (of dust) already appears large (see e.g. Draine, 2006, and references therein).
5.3.4 Low temperature chemistry
Finally, Hily-Blant et al. (2008) have observed very cold 13CN in the nuclei of a few dense cores of known temperature and density (T K, ), which present temperature and densities relatively similar to those encountered in the mid-planes of TTauri disks. They find that CN is not strongly depleted in the nuclei of the cores, contrary to CO, and can be a fair column density tracer in these extreme conditions. However, Hily-Blant et al. (2010) were unable to account for the near constancy of the CN/HCN ratio in their chemical models. These observations lead also open the possibility that cold chemistry is not fully understood at least for CN. Hily-Blant et al. (2010) conclude that our knowledge of the low temperature chemistry of CN is limited by the extrapolation of the rate coefficients measured at high temperatures to the 10 K regime for many of the important reactions, including those mentioned in Sec.5.2 (Pineau des Forets et al., 1990; Boger & Sternberg, 2005). However, at such low temperatures and high densities, chemistry also depends on reactions on the grain surfaces, as shown by Walsh et al. (2010) in particular for HCN. Hence, another viable alternative would be inappropriate knowledge of the grain surface chemistry.
6 Summary
We present sensitive, high spatial and spectral resolution observations of HCN J=1-0 and CN J=2-1 in 2 T Tauri disks (DM Tau and LkCa 15) and one Herbig Ae (MWC 480). Column densities and excitation conditions are recovered through a minimization scheme which utilizes all the information provided by the hyperfine structure of the observed transitions. Although we find out as expected from a layered disk structure, the analysis indicates that the location of CN and its apparent excitation temperature appears incompatible with the expectations from current chemical models. Lowering the gas-to-dust ratio might partially solve the conflict on temperature and localization of the molecules, but may not produce large enough quantities of CN and HCN. The observations thus suggest that a substantial fraction of the molecules are created in the disk plane at low temperatures, perhaps by surface chemistry. Sensitive, spatially resolved images of higher excitation lines of CN and HCN would be required to provide a complete diagnostic to determine the excitation conditions in disks allowing us to decide between the possible options.
Acknowledgements.
We acknowledge all the Plateau de Bure IRAM staff for their help during the observations. We thank Pierre Hily-Blant for his modifications of a previous version of the PDR code. We also acknowledge Franck Le Petit for many fruitful discussions about the PDR code. This research was supported by the program PCMI from INSU/CNRS.References
- Aikawa (2007) Aikawa, Y. 2007, ApJ, 656, L93
- Aikawa & Herbst (1999) Aikawa, Y. & Herbst, E. 1999, A&A, 351, 233
- Aikawa et al. (2003) Aikawa, Y., Momose, M., Thi, W.-F., et al. 2003, PASJ, 55, 11
- Aikawa & Nomura (2006) Aikawa, Y. & Nomura, H. 2006, ApJ, 642, 1152
- Aikawa et al. (2002) Aikawa, Y., van Zadelhoff, G. J., van Dishoeck, E. F., & Herbst, E. 2002, A&A, 386, 622
- Bergin et al. (2003) Bergin, E., Calvet, N., D’Alessio, P., & Herczeg, G. J. 2003, ApJ, 591, L159
- Bergin et al. (2007) Bergin, E. A., Aikawa, Y., Blake, G. A., & van Dishoeck, E. F. 2007, in Protostars and Planets V, ed. B. Reipurth, D. Jewitt, & K. Keil, 751–766
- Boger & Sternberg (2005) Boger, G. I. & Sternberg, A. 2005, ApJ, 632, 302
- Burke & Hollenbach (1983) Burke, J. R. & Hollenbach, D. J. 1983, ApJ, 265, 223
- Burton et al. (1990) Burton, M. G., Hollenbach, D. J., & Tielens, A. G. G. M. 1990, ApJ, 365, 620
- Chapillon et al. (2008) Chapillon, E., Guilloteau, S., Dutrey, A., & Piétu, V. 2008, A&A, 488, 565
- Chiang & Goldreich (1997) Chiang, E. I. & Goldreich, P. 1997, ApJ, 490, 368
- D’Alessio et al. (2006) D’Alessio, P., Calvet, N., Hartmann, L., Franco-Hernández, R., & Servín, H. 2006, ApJ, 638, 314
- D’Alessio et al. (1999) D’Alessio, P., Calvet, N., Hartmann, L., Lizano, S., & Cantó, J. 1999, ApJ, 527, 893
- Dartois et al. (2003) Dartois, E., Dutrey, A., & Guilloteau, S. 2003, A&A, 399, 773
- Draine (2006) Draine, B. T. 2006, ApJ, 636, 1114
- Dutrey et al. (1997) Dutrey, A., Guilloteau, S., & Guelin, M. 1997, A&A, 317, L55
- Dutrey et al. (2007) Dutrey, A., Henning, T., Guilloteau, S., et al. 2007, A&A, 464, 615
- Fogel et al. (2011) Fogel, J. K. J., Bethell, T. J., Bergin, E. A., Calvet, N., & Semenov, D. 2011, ApJ, 726, 29
- Goicoechea et al. (2006) Goicoechea, J. R., Pety, J., Gerin, M., et al. 2006, A&A, 456, 565
- Green & Thaddeus (1974) Green, S. & Thaddeus, P. 1974, ApJ, 191, 653
- Guilloteau & Baudry (1981) Guilloteau, S. & Baudry, A. 1981, A&A, 97, 213
- Guilloteau & Dutrey (1998) Guilloteau, S. & Dutrey, A. 1998, A&A, 339, 467
- Guilloteau et al. (2011) Guilloteau, S., Dutrey, A., Piétu, V., & Boehler, Y. 2011, A&A, submitted
- Henning et al. (2010) Henning, T., Semenov, D., Guilloteau, S., et al. 2010, ApJ, 714, 1511
- Herbig & Goodrich (1986) Herbig, G. H. & Goodrich, R. W. 1986, ApJ, 309, 294
- Hersant et al. (2009) Hersant, F., Wakelam, V., Dutrey, A., Guilloteau, S., & Herbst, E. 2009, A&A, 493, L49
- Hily-Blant et al. (2008) Hily-Blant, P., Walmsley, M., Pineau Des Forêts, G., & Flower, D. 2008, A&A, 480, L5
- Hily-Blant et al. (2010) Hily-Blant, P., Walmsley, M., Pineau Des Forêts, G., & Flower, D. 2010, A&A, 513, A41+
- Kastner et al. (2008) Kastner, J. H., Zuckerman, B., Hily-Blant, P., & Forveille, T. 2008, A&A, 492, 469
- Kastner et al. (1997) Kastner, J. H., Zuckerman, B., Weintraub, D. A., & Forveille, T. 1997, Science, 277, 67
- Le Bourlot et al. (1993) Le Bourlot, J., Pineau Des Forets, G., Roueff, E., & Flower, D. R. 1993, A&A, 267, 233
- Le Petit et al. (2006) Le Petit, F., Nehmé, C., Le Bourlot, J., & Roueff, E. 2006, ApJS, 164, 506
- Mannings et al. (1997) Mannings, V., Koerner, D. W., & Sargent, A. I. 1997, Nature, 388, 555
- Monteiro & Stutzki (1986) Monteiro, T. S. & Stutzki, J. 1986, MNRAS, 221, 33P
- Öberg et al. (2010) Öberg, K. I., Qi, C., Fogel, J. K. J., et al. 2010, ApJ, 720, 480
- Pavlyuchenkov et al. (2007) Pavlyuchenkov, Y., Semenov, D., Henning, T., et al. 2007, ApJ, 669, 1262
- Pety (2005) Pety, J. 2005, in SF2A-2005: Semaine de l’Astrophysique Francaise, ed. F. Casoli, T. Contini, J. M. Hameury, & L. Pagani, 721–+
- Piétu et al. (2007) Piétu, V., Dutrey, A., & Guilloteau, S. 2007, A&A, 467, 163
- Piétu et al. (2006) Piétu, V., Dutrey, A., Guilloteau, S., Chapillon, E., & Pety, J. 2006, A&A, 460, L43
- Pineau des Forets et al. (1990) Pineau des Forets, G., Roueff, E., & Flower, D. R. 1990, MNRAS, 244, 668
- Qi et al. (2004) Qi, C., Ho, P. T. P., Wilner, D. J., et al. 2004, ApJ, 616, L11
- Qi et al. (2008) Qi, C., Wilner, D. J., Aikawa, Y., Blake, G. A., & Hogerheijde, M. R. 2008, ApJ, 681, 1396
- Schreyer et al. (2008) Schreyer, K., Guilloteau, S., Semenov, D., et al. 2008, A&A, 491, 821
- Semenov et al. (2008) Semenov, D., Pavlyuchenkov, Y., Henning, T., Wolf, S., & Launhardt, R. 2008, ApJ, 673, L195
- Semenov et al. (2006) Semenov, D., Wiebe, D., & Henning, T. 2006, ApJ, 647, L57
- Simon et al. (2000) Simon, M., Dutrey, A., & Guilloteau, S. 2000, ApJ, 545, 1034
- Thi et al. (2004) Thi, W.-F., van Zadelhoff, G.-J., & van Dishoeck, E. F. 2004, A&A, 425, 955
- van Dishoeck et al. (2006) van Dishoeck, E. F., Jonkheid, B., & van Hemert, M. C. 2006, Faraday Discuss., 133, 231
- van Zadelhoff et al. (2003) van Zadelhoff, G.-J., Aikawa, Y., Hogerheijde, M. R., & van Dishoeck, E. F. 2003, A&A, 397, 789
- van Zadelhoff et al. (2001) van Zadelhoff, G.-J., van Dishoeck, E. F., Thi, W.-F., & Blake, G. A. 2001, A&A, 377, 566
- Walsh et al. (2010) Walsh, C., Millar, T. J., & Nomura, H. 2010, ApJ, 722, 1607
- Westley et al. (1995) Westley, M. S., Baragiola, R. A., Johnson, R. E., & Baratta, G. A. 1995, Nature, 373, 405
- Willacy et al. (2006) Willacy, K., Langer, W., Allen, M., & Bryden, G. 2006, ApJ, 644, 1202
- Willacy & Langer (2000) Willacy, K. & Langer, W. D. 2000, ApJ, 544, 903
Appendix A Channel maps
Appendix B Chemical model results
| DM Tau |
|
| LkCa 15 |
|
| MWC 480 |

|
| small grains | big grains | |
|---|---|---|
 |
 |
|
 |
 |