The Relationships Among Compact Stellar Systems:
A Fresh View of Ultra Compact Dwarfs
Abstract
We use a combined imaging and spectroscopic survey of the nearby central cluster galaxy, M87, to assemble a sample of 34 confirmed ultra compact dwarfs (UCDs) with half-light radii of 10 pc measured from Hubble Space Telescope images. This doubles the existing sample in M87, making it the largest such sample for any galaxy, while extending the detection of UCDs to unprecedentedly low luminosities (). With this expanded sample, we find no correlation between size and luminosity, in contrast to previous suggestions, and no general correlation between size and galactocentric distance.
We explore the relationships between UCDs, less luminous extended clusters (including faint fuzzies), globular clusters (GCs), as well as early-type galaxies and their nuclei, assembling an extensive new catalog of sizes and luminosities for stellar systems. Most of the M87 UCDs follow a tight color-magnitude relation, offset from the metal-poor GCs. This, along with kinematical differences, demonstrates that most UCDs are a distinct population from normal GCs, and not simply a continuation to larger sizes and higher luminosities. The UCD color-magnitude trend couples closely with that for Virgo dwarf elliptical nuclei. We conclude that the M87 UCDs are predominantly stripped nuclei. The brightest and reddest UCDs may be the remnant nuclei of more massive galaxies while a subset of the faintest UCDs may be tidally limited and related to more compact star clusters. In the broader context of galaxy assembly, blue UCDs may trace halo build-up by accretion of low-mass satellites, while red UCDs may be markers of metal-rich bulge formation in larger galaxies.
Subject headings:
globular clusters: general — galaxies: star clusters — galaxies: individual (M87)1. Introduction
There is ongoing debate about the existence of a genuine boundary between massive star clusters and compact galaxies (e.g., Gilmore et al. 2007; Forbes & Kroupa 2011). In the decade or so since the discovery (Hilker et al., 1999; Drinkwater et al., 2000) and naming (Phillipps et al., 2001) of Ultra Compact Dwarfs (UCDs), numerous observational studies have sought to understand where these curious objects fit in the multi-dimensional parameter space for hot (dispersion-supported) stellar systems that encompass massive and dwarf galaxies as well as compact and extended star clusters (Dabringhausen et al., 2008; Forbes et al., 2008).
The UCDs studied to date have typical luminosities of and projected half-light radii of 20 pc. Such high luminosities and large sizes differ dramatically from classical globular clusters (GCs) with 2–3 pc and . UCDs were first identified in galaxy clusters but have since also been found in low-density environments (e.g., Hau et al. 2009; Norris & Kannappan 2011).
The formation mechanism for UCDs remains unclear. One possibility is that some dwarf galaxies in dense environments become stripped down to their nuclei, which then appear either as normal GCs or as objects of intermediate size (e.g., Bassino et al. 1994; Bekki et al. 2001).
Alternatively, UCDs may be a species of GC whose large sizes are the result of star cluster mergers (Kroupa 1998; Fellhauer & Kroupa 2002; Kissler-Patig et al. 2006), or of a change in cluster formation physics at high masses (Murray, 2009).
An alternative term for UCDs, “dwarf-globular transition objects” (coined by Haşegan et al. 2005), underlines the uncertainty in their identification as either the most massive star clusters or the least massive compact galaxies. In fact, there are indications that no single formation mechanism is responsible for all UCDs (e.g., Mieske et al. 2006a; Hilker 2009; Taylor et al. 2010; Norris & Kannappan 2011; Da Rocha et al. 2011; Chilingarian et al. 2011). The challenge is to discover which subsamples of UCDs correspond to which formational channels and to understand the determining factors (mass, environment, orbit, etc).
The stripped dwarf galaxy scenario has received support from several pieces of observational evidence, including mass-to-light ratios, and size-luminosity and color-magnitude trends. In some (but not all) cases, UCDs apparently have elevated dynamical mass-to-light ratios that could imply non-baryonic dark matter (e.g., Haşegan et al. 2005; Baumgardt & Mieske 2008). There have been reports of a strong size-luminosity correlation that differs dramatically from the nearly constant size of classical GCs (e.g., Rejkuba et al. 2007; Evstigneeva et al. 2008; Dabringhausen et al. 2008; Norris & Kannappan 2011; Madrid 2011). This trend seemed to bear a rough resemblance to the size-luminosity relations of dwarf elliptical (dE) nuclei (e.g., Côté et al. 2006).
Other similarities were noted between UCDs and nuclei in color-magnitude space (Côté et al., 2006; Evstigneeva et al., 2008; Norris & Kannappan, 2011). However, the limited range of UCD luminosities in these studies made such comparisons difficult to interpret and, as we report in this paper, re-evaluation is required once the sample is expanded to include fainter UCDs.
In parallel to the expanding recognition of UCDs, a menagerie of very faint, extended clusters have been discovered around various galaxies (e.g., Larsen & Brodie 2000; Huxor et al. 2005; Peng et al. 2006). These objects seem to have a nature and origin distinct from compact GCs, and could instead be more closely related to UCDs (e.g., Brüns et al. 2011), a theme that we explore further in this paper.
In order to orient the analysis that follows, we need a clear observational definition for UCDs, which has varied significantly in the literature. We adopt the provisional criteria that 10–100 pc and (), with no upper limit on luminosity. These are not intended to be hard boundaries that enclose all UCDs, and only UCDs, but rather provide a useful outline of their primary domain. The unusual aspect of our definition is the extension to lower-luminosity objects than have previously been considered as UCDs. One of our goals in this paper is an empirical refinement of the boundaries between UCDs and star clusters in size-luminosity space.
Given these criteria, identifying UCDs beyond the Milky Way requires both high-resolution imaging to determine sizes accurately (generally from the Hubble Space Telescope [HST]), and distance measurements to verify sample membership (typically from spectroscopic redshifts). In the past, UCD selection has often had to rely on one or the other; rarely have both critical criteria been in play to generate a large sample.
In this spirit, we revisit the population of UCDs around the giant elliptical galaxy M87, at the center of the Virgo cluster. The new comprehensive survey of this system, as described below, has allowed us to double the sample of confirmed M87 UCDs and study their scaling relations at lower luminosities than ever before. This is the largest and most complete UCD sample for any galaxy studied to date, and the homogeneous distance and environment permit an unprecedentedly accurate characterization of true UCD properties.
Our observational results are presented in Section 2. We analyze size trends with luminosity and galactocentric distance in Sections 3 and 4, respectively. We consider color, age, metallicity, and velocity trends in Sections 5 and 6, and discuss UCDs in a wider context in Section 7. Our summary and conclusions are in Section 8. Appendix A presents an extensive new catalog of sizes and luminosities for nearby stellar systems, using our own data and information from the literature.
2. Observations
The UCDs were drawn from a large spectroscopic and photometric survey of GCs in M87, described in detail in Strader et al. (2011, hereafter S+11). Here we give a brief summary of the relevant points.
Multi-color wide-field photometry was obtained with Subaru/Suprime-Cam and CFHT/Megacam, and follow-up spectroscopy with LRIS and DEIMOS on Keck, as well as with Hectospec on the MMT. These data yielded a new catalog of precise radial velocities for 451 compact stellar systems, which was combined with existing data from the literature to create a comprehensive spectroscopic compilation of 737 objects associated with M87 (extending out to a projected galactocentric radius of 200 kpc, for an adopted distance of 16.5 Mpc).
Previous studies have identified 16 objects around M87 that fit our criteria for UCDs (Haşegan et al., 2005; Jones et al., 2006; Haşegan, 2007; Evstigneeva et al., 2007, 2008). We refer to this as the sample of “old” (prior to this work) UCDs in M87111Although some of these objects have been called “Virgo” UCDs, they all have positions ( 140 kpc) and velocities that are consistent with being bound to M87. Also, as discussed in S+11, there is evidence that some of the older, lower-resolution spectra of objects around M87 had “catastrophic” velocity measurement errors of up to 1200 km s-1. However, given the brightness of the UCDs, it seems unlikely that this would have led to any complete misclassifications of background galaxies as Virgo objects.. There are another dozen bright, spectroscopically-confirmed objects (with ) that undoubtedly include some bona fide UCDs, but they do not yet have size measurements, so we exclude them from our confirmed sample222These objects are H18539, H60812, H62525, VUCD8, VUCD10, S348, S784, S804, S1370, S1538, S1584, and S1617 (Huchra & Brodie 1987; Mould et al. 1987; Cohen & Ryzhov 1997; Hanes et al. 2001; Haşegan et al. 2005; Jones et al. 2006; Firth et al. 2008; Paudel et al. 2010; S+11). There is also a bright intergalactic UCD candidate, IGC1285, at a projected distance of 740 kpc from M87 (Firth et al., 2008, 2009). Additional objects of potential interest are S923, which has a very high velocity relative to M87 and exhibits a peculiar asymmetric, multi-component structure; and S7023, which may have a very low velocity and shows a core plus halo structure (see S+11)..
For all of the objects in the spectroscopic catalog without published HST-based half-light radii in the literature, we searched for appropriate HST archival images that were sufficiently deep for size measurements. ACS, WFPC2, and STIS images in reasonable optical bands (from essentially to -equivalent) were used. Sizes were measured using ishape (Larsen, 1999), adopting a King model with a fixed concentration of 30.
It is known that some of the Virgo UCDs are not well fitted by King models, or else have concentrations that are lower than 30, but that in many cases the inferred sizes are only modestly affected by the model choice (Evstigneeva et al., 2008). Most of the objects we analyze do not have the very high imaging required to fit for more than one free density-profile shape parameter (Carlson & Holtzman, 2001), so we must unavoidably adopt a simple, consistent model for all of the objects. We also re-analyze the fainter UCDs from the Haşegan samples, rather than using those authors’ reported values that were based on more general models. In a few cases our UCD size measurements are significantly () larger, underscoring the fact that is a model dependent quantity.
| ID | R.A. | Decl. | |||||||
|---|---|---|---|---|---|---|---|---|---|
| [J2000] | [J2000] | [kpc] | [ km s-1] | [pc] | |||||
| Old confirmed: | |||||||||
| VUCD7 | 187.97040 | 12.26641 | 82.62 | 0.95 | 100.6 | 0.087 | |||
| S547 | 187.73910 | 12.42903 | 14.36 | 1.15 | 21.6 | 0.063 | |||
| VUCD5 | 187.79950 | 12.68364 | 88.25 | 1.06 | 19.2 | 0.018 | |||
| VUCD1 | 187.53155 | 12.60861 | 79.54 | 0.89 | 12.1 | 0.013 | |||
| VUCD2 | 187.70085 | 12.58636 | 56.24 | 0.87 | 14.1 | 0.019 | |||
| VUCD4 | 187.76865 | 11.94347 | 130.12 | 0.90 | 25.1 | 0.020 | |||
| VUCD6 | 187.86816 | 12.41766 | 46.26 | 0.90 | 18.8 | 0.031 | |||
| S417 | 187.75616 | 12.32351 | 24.06 | 1.00 | 14.7 | 0.039 | |||
| H55930 | 187.63929 | 12.49845 | 36.14 | 0.84 | 28.9 | 0.059 | |||
| VUCD9 | 188.06074 | 12.05149 | 139.78 | 0.91 | 25.4 | 0.021 | |||
| S928 | 187.69875 | 12.40845 | 5.38 | 0.80 | 36.3 | 0.30 | |||
| H36612 | 187.48603 | 12.32538 | 64.69 | 0.84 | 14.5 | 0.024 | |||
| S5065 | 187.70854 | 12.40248 | 3.35 | 0.86 | 26.1 | 0.32 | |||
| S999 | 187.69130 | 12.41709 | 8.53 | 0.81 | 33.7 | 0.23 | |||
| S8006 | 187.69436 | 12.40616 | 5.41 | 0.81 | 31.7 | 0.32 | |||
| S8005 | 187.69252 | 12.40641 | 5.80 | 0.81 | 36.9 | 0.36 | |||
| New confirmed: | |||||||||
| S477 | 187.74961 | 12.30030 | 28.90 | 0.74 | 33.5 | 0.10 | |||
| S1629 | 187.61066 | 12.34572 | 29.82 | 0.79 | 26.4 | 0.082 | |||
| H30772 | 187.74191 | 12.26728 | 37.07 | 0.91 | 9.9 | 0.027 | |||
| S686 | 187.72421 | 12.47187 | 23.81 | 0.78 | 21.2 | 0.080 | |||
| S796 | 187.71563 | 12.34815 | 12.67 | 0.79 | 15.3 | 0.092 | |||
| S672 | 187.72804 | 12.36065 | 10.76 | 0.78 | 25.9 | 0.18 | |||
| S887 | 187.70389 | 12.36544 | 7.42 | 0.86 | 10.0 | 0.093 | |||
| S731 | 187.72452 | 12.28682 | 30.49 | 0.86 | 24.8 | 0.091 | |||
| H27916 | 187.71521 | 12.23610 | 44.72 | 0.76 | 13.7 | 0.040 | |||
| S1201 | 187.67423 | 12.39478 | 8.98 | 0.71 | 29.9 | 0.26 | |||
| S682 | 187.72775 | 12.33962 | 16.05 | 0.71 | 23.7 | 0.15 | |||
| S6004 | 187.79259 | 12.26697 | 43.28 | 0.79 | 40.3 | 0.13 | |||
| H30401 | 187.82795 | 12.26247 | 50.51 | 0.75 | 10.7 | 0.033 | |||
| S825 | 187.71263 | 12.35542 | 10.46 | 0.76 | 13.3 | 0.12 | |||
| S723 | 187.72399 | 12.33940 | 15.74 | 0.77 | 16.9 | 0.12 | |||
| H44905 | 187.73785 | 12.39440 | 9.03 | 0.77 | 40.0 | 0.43 | |||
| S1508 | 187.63087 | 12.42356 | 23.08 | 0.74 | 42.4 | 0.27 | |||
| H39168 | 188.15205 | 12.34920 | 126.07 | 0.74 | 11.0 | 0.029 | |||
| New candidates: | |||||||||
| H46823 | 187.73054 | 12.41109 | 9.00 | 0.82 | 17.0 | 0.13 | |||
| H46017 | 187.72083 | 12.40476 | 5.74 | 0.71 | 31.5 | 0.46 | |||
| H42003 | 187.74030 | 12.37334 | 10.93 | 0.82 | 34.3 | 0.34 | |||
| H46484 | 187.69745 | 12.40857 | 5.56 | 0.79 | 39.1 | 0.62 | |||
| H41821 | 187.69752 | 12.37159 | 6.10 | 0.99 | 29.4 | 0.45 | |||
| B1 | 187.70503 | 12.40549 | 4.15 | 0.8 | 34.0 | 0.87 |
Note. — The confirmed UCDs are grouped in “old” and “new” subsets depending on whether they were explicitly confirmed by earlier work (via distance and size measurements) or are new to this paper. Within each grouping, the objects are ordered by magnitude . See Section 4 for derivation of the estimated tidal radii .
Uncertainties are difficult to estimate for our size measurements due to the range in instruments, depth, and filters, but random errors of 15% for 150 are reasonable. This is supported by cross-checks using different instrument set-ups and with other authors’ size measurements (see S+11 for more details).
A combined sample of 344 spectroscopically-confirmed M87 objects with measured sizes is reported and tabulated in S+11, which also contains further details about their properties and the analysis methods. With our current criteria of 10–100 pc, we identify 34 UCDs associated with M87 and provide their details in Table 1. Of these 34, 18 are “new” in the sense that they have not been identified as UCDs in previous works, and are of relatively low luminosity. 15 of the 18 are completely new identifications, with the first published sizes in S+11; four also had no previous spectroscopy. Of the remaining three objects, two (S887 and H30772) have sizes from Jordán et al. (2009); the last (S672) has a size from Madrid et al. (2009) but no previous redshift.
As we will discuss later, there are indications from colors and kinematics that the UCD population of M87 extends to much smaller sizes than the conventional 10 pc boundary. For now, we designate objects in the 5–10 pc range as “intermediate” objects, and smaller objects ( 5 pc) as GCs333These are not absolute limits for all objects. E.g., some bona fide GCs could have evolved from originally compact sizes to be larger than 5 pc. However, for the relatively massive objects in M87 that will be our primary focus, the two-body relaxation timescales are too long for the GCs to have expanded to 10 pc..
An important component to any size analysis is understanding the sample selection effects. The main, unavoidable, selection in our spectroscopic sample is by target magnitude. Due to the composite nature of the sample drawn from several different surveys, the magnitude limits have a complex dependency on galactocentric distance (see figure 10 of S+11). In brief, the spectroscopic sample with sizes available has a magnitude limit of (, ) at 8–25 kpc, and (, ) at 25–45 kpc. At larger distances, the sample is strongly skewed to the very bright end () owing to an HST program that targeted such objects (Evstigneeva et al., 2008).
This magnitude-limit variability could potentially impact some inferences about the relations between distance, luminosity, and size that we will examine later. However, an important point here is that the sizes were all measured after spectroscopic confirmation, so there should be no inherent size bias (at a given luminosity and distance).
The one caveat here is that a size criterion of FWHM from the Megacam imaging was used to select the spectroscopic targets and exclude background galaxies. This imaging had seeing of 0.7′′, and any UCDs in the 50–100 pc regime may have been selected against. Our preliminary analysis of the ground-based imaging indicates that there are very few viable candidates of this nature, as nearly all objects above this size cut have colors or morphologies that suggest background galaxies. However, it should be kept it mind that this is an area of parameter space in need of more exploration to find rare but interesting objects.
Although our sample represents a major improvement over previous M87 UCD surveys that reached (see references above), it is still highly incomplete. To estimate the total numbers of UCDs, we assume that they follow the spatial distribution of the “blue” GCs around M87 (because the vast majority of the UCDs have blue colors). We estimate 300 bright blue “GCs” to be in the magnitude range of to and in the distance range 10–200 kpc (S+11). We have found that 15% of such objects are UCDs and therefore, after allowing for UCDs with red colors and other magnitudes and distances, we expect that there are easily another 50 M87 UCDs awaiting discovery.
We will also be comparing our spectroscopically-confirmed sample to a larger sample of photometrically-identified GCs from a central ACS pointing on M87 (Jordán et al., 2009). This allows us to increase the luminosity range surveyed, and to compare to a relatively unbiased sample. This GC catalog is thought to have a very low level of contamination from foreground stars and background galaxies, but it deliberately omitted any objects with pc and . An analysis of the same dataset by Haşegan et al. (2005, figure 6) shows that there are a handful of larger objects that have not been yet reported explicitly, and which could be UCDs.
To find these objects, we carry out aperture difference photometry on all pointlike objects in the ACS images (which are in bands equivalent to and ), to a faint-magnitude limit of (our approximate spectroscopic limit). We find seven extended objects whose colors are consistent with the known M87 UCDs and which are not visually identifiable as obvious background galaxies. One of these, H41729, was already found from a surface brightness fluctuation analysis to be a background galaxy (Haşegan et al., 2005, object 1316_1). It may be part of a cluster of galaxies behind M87 at (Huchra & Brodie, 1984), and provides a warning about the purity of UCD selection without distance confirmation.
The properties of the remaining six central UCD candidates are reported at the end of Table 1. One of them, H41821, has an unusually red color and appears to be fairly near to both H41729 (which is also red) and a very large background galaxy. We therefore assume it to be another background object and omit it from all of our plots. This leaves 5 viable UCD candidates that merit spectroscopic follow-up.
3. Size vs. luminosity
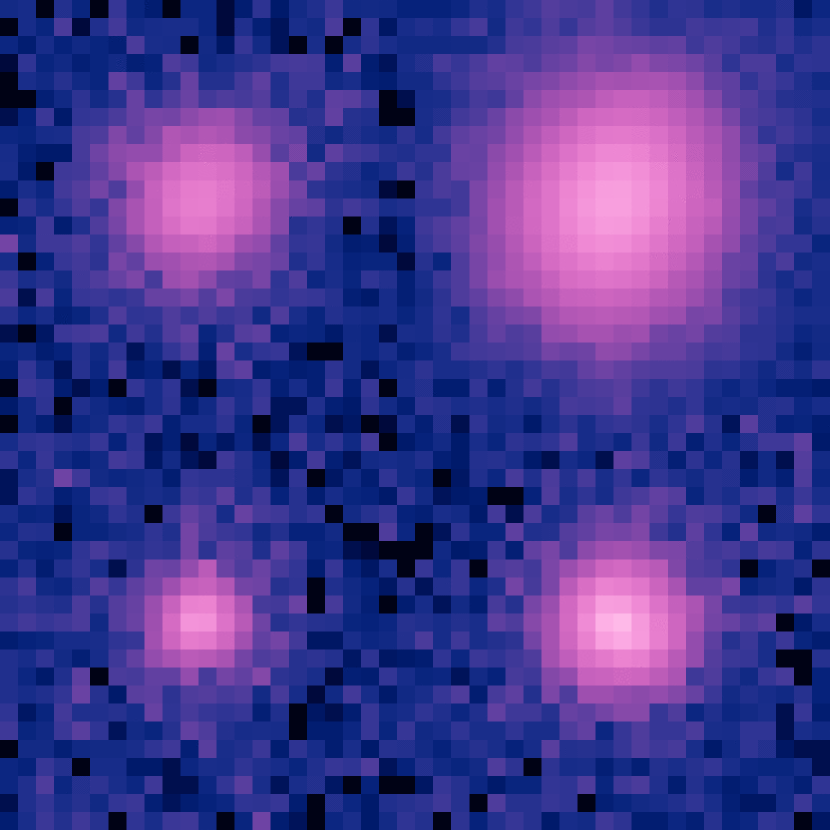
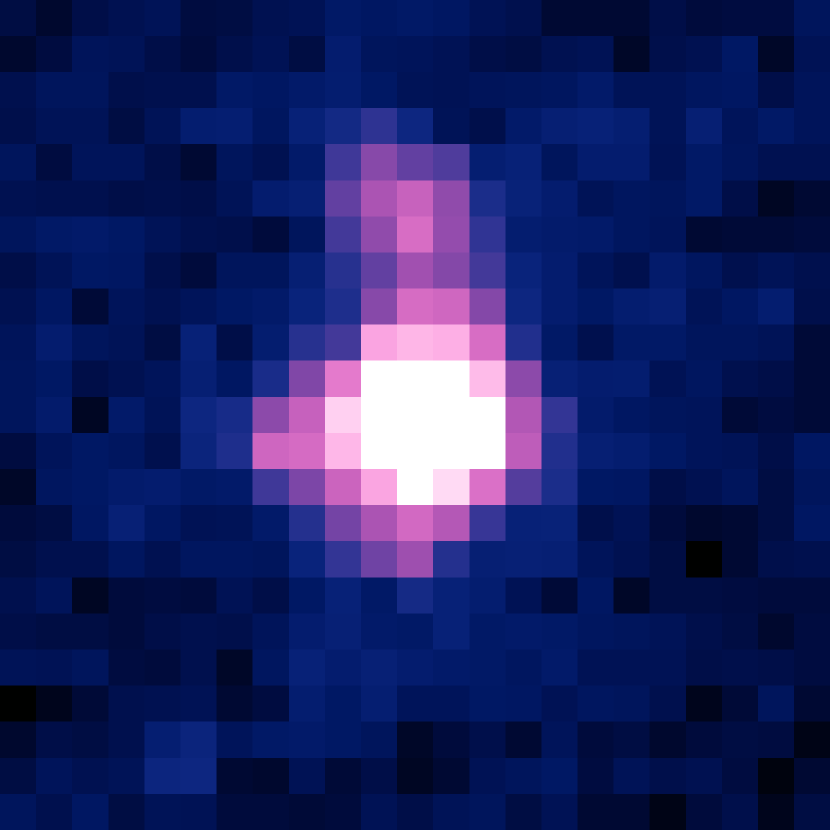
Most of the 18 newly identified UCDs are fainter than specified in conventional definitions (, ), and we have thus discovered a new area of size-luminosity parameter space that is inhabited by UCDs444Similarly low luminosity UCD candidates were identified in the core of the Coma cluster by Madrid et al. (2010) but have not been spectroscopically confirmed. Many other spectroscopic studies of “GCs” around other galaxies are bound to include some fainter UCDs (e.g., Firth et al. 2007), but these await confirmation via size measurements. The only previously confirmed examples from this area of parameter space are NGC 2419 from the Milky Way, and 90:12 from Fornax (Richtler et al., 2005). Several other objects also previously appeared to have somewhat unusually large sizes relative to UCD size vs. mass expectations, including the M87 UCD S8005, as noticed by Haşegan et al. (2005).. Two of the objects, H44905 and S1508, are by far the lowest surface brightness UCDs confirmed to date, with mag arcsec-2 within the half-light radius. Some example images are shown in Figure 1.
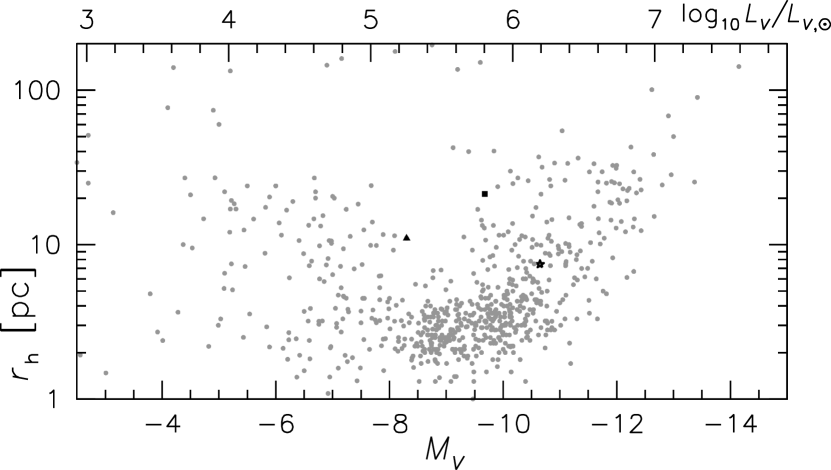
We show the size and magnitude data for our full sample of M87 GCs and UCDs in Figure 2, including for context the photometric sample of central GC and UCD candidates as discussed in the previous section. The addition of the new spectroscopic sample now reveals that UCDs in M87 follow no clear overall size–luminosity relation. In fact, the three largest UCDs in the entire sample (with 40 pc) are some of the faintest ones (other than the peculiar, largest object VUCD7 which may be in a category of its own). Curiously, there are several additional photometric UCD candidates clumped in the same area of parameter space.
Previous claims of a strong positive size-luminosity correlation (Haşegan et al., 2005; Evstigneeva et al., 2008; Mieske et al., 2008) were influenced by the apparent joining of the brightest UCDs and GCs. Such a correlation was formerly linked to similar trends reported for dwarf and massive galaxy nuclei at the brighter levels (Lotz et al., 2004; Côté et al., 2006; Norris & Kannappan, 2011) and was cited in support of the threshed nuclei origin for UCDs (Evstigneeva et al., 2008). We will discuss this point further in Section 5.
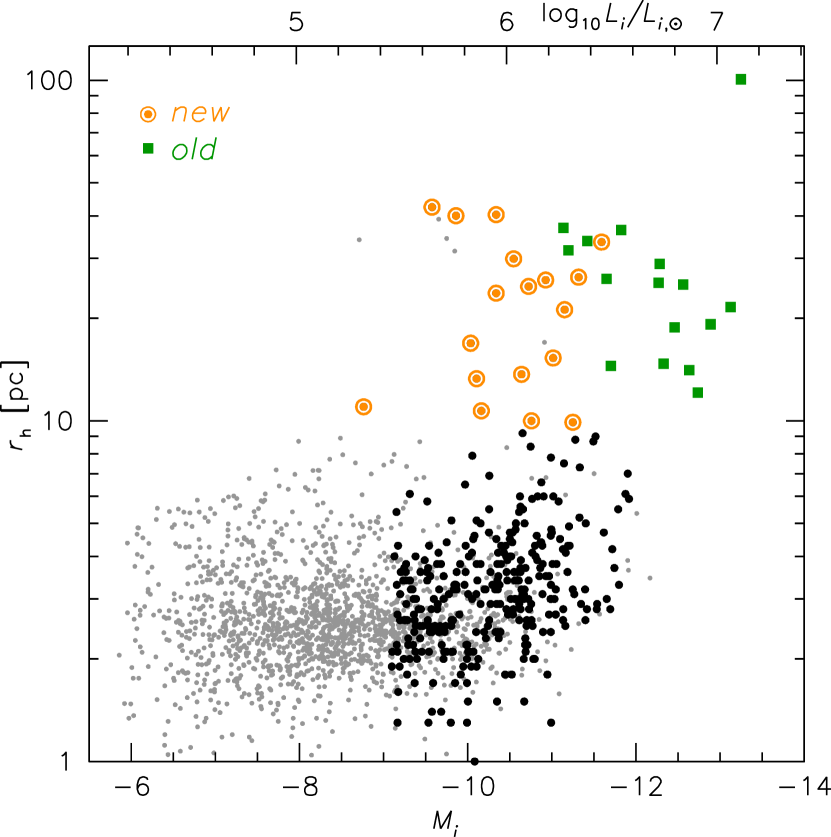
The data now suggest that the UCDs and GCs occupy two separate domains in size, neither of which has a strong luminosity dependence. The GCs are generally smaller than 5 pc, with a mild systematic size increase at the bright end (also noted in other galaxies: Spitler et al. 2006; Barmby et al. 2007; Harris 2009a).
The GC and UCD luminosities overlap over a large range of absolute magnitude, with compact GCs of sizes 2–3 pc found all the way up to (corresponding to and stellar masses of ). This demonstrates that identifications of UCDs by luminosity alone risk conflating two distinct classes of objects, except for the very brightest cases where only extended objects are so far found.
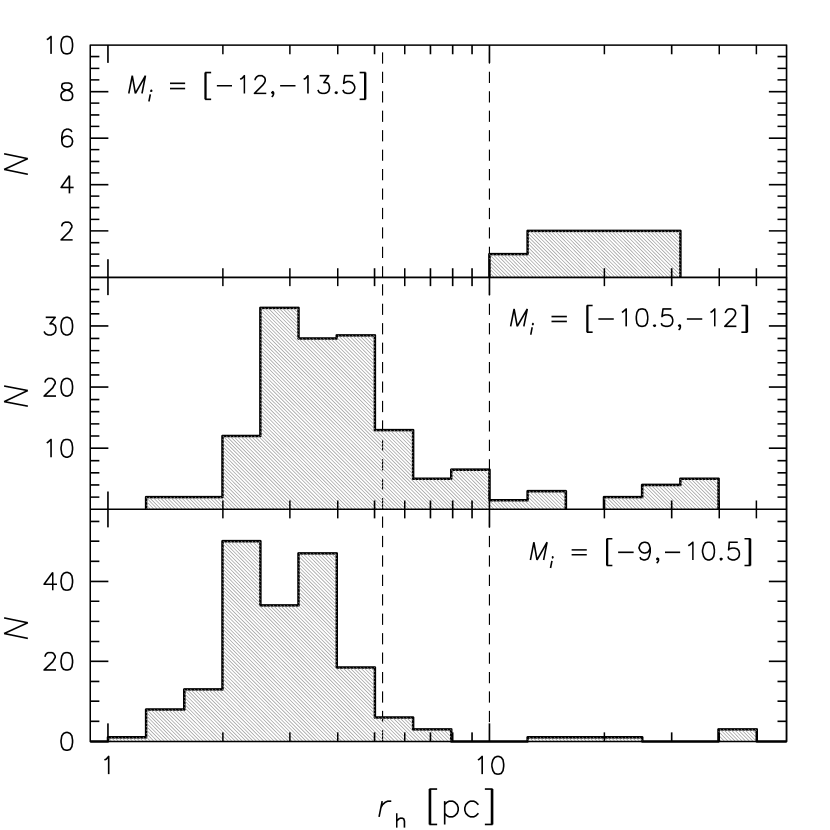
Another way to summarize these results is as histograms of sizes in luminosity bins, shown in Figure 3. With the caveat that there may be hidden correlations with color or distance in these histograms, we note the following provisional points (referring also to Figure 2). There is a clear ridgeline of compact GCs around 2–4 pc, while any peak for the UCDs is less well defined (so we continue with our 10–100 pc UCD definition). The peak GC size increases mildly with luminosity (by 1 pc over a 3 magnitude range), while the median UCD size stays roughly constant. The fraction of UCDs varies strongly with luminosity: 3%, 10%, and 100% at , , and , respectively.
4. Size vs. distance
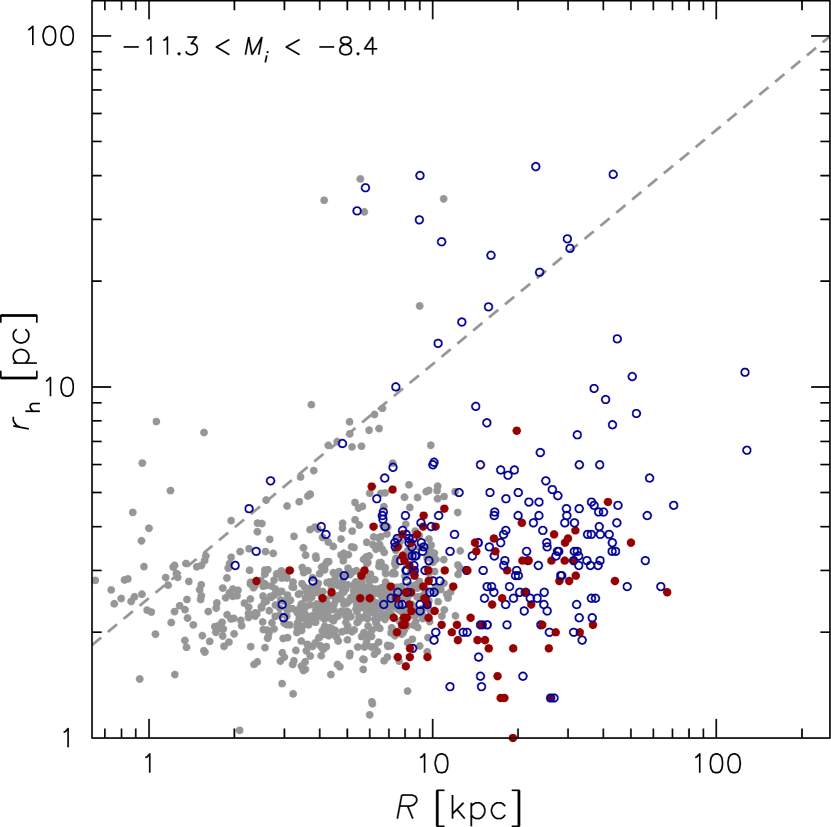
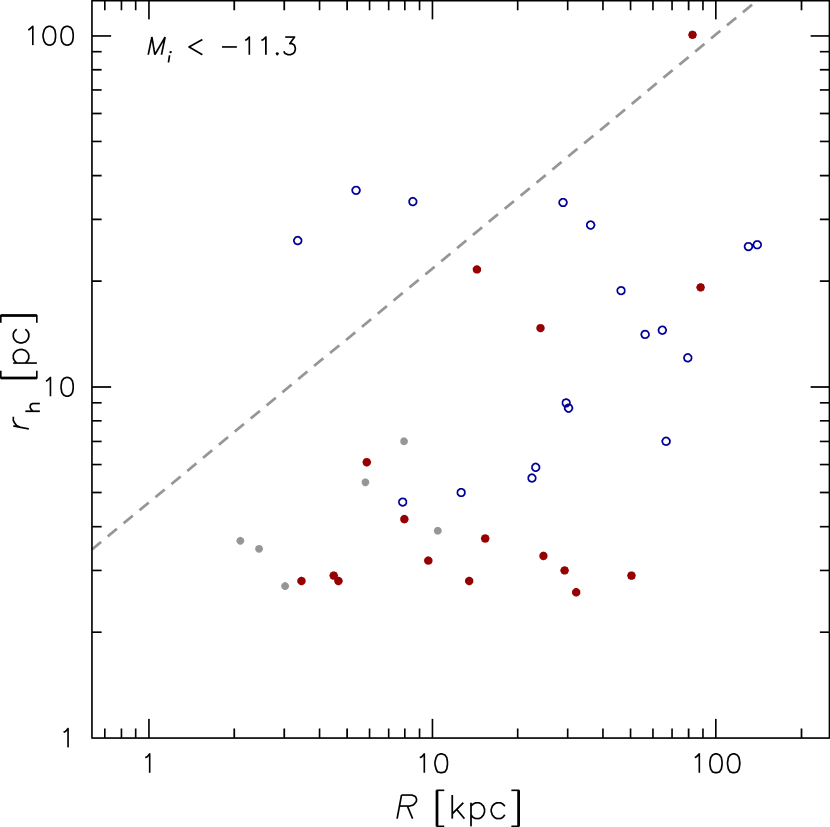
Our wide-field catalog of M87 objects allows us also to explore the dependencies of size on galactocentric distance, . We plot vs. in Figure 4, where the blue and red colors correspond to the metal poor and metal rich subpopulations well-established for GCs (e.g., Brodie & Strader 2006), while left and right panels show faint and bright objects. Note that is a projected distance, while the more fundamental quantity is the 3-D distance. Also, is a measurement of the distance at a random point in each object’s orbit, while the more relevant parameter may be the pericentric distance. Both aspects will add observational scatter to any true correlations with distance.
Figure 4 shows a remarkable similarity to Figure 2 in that compact GCs and UCDs again coexist in parallel sequences, over a wide range of distances ( 5–100 kpc). Within each subpopulation, there is no clear correlation between size and distance except that the fainter GCs seem to show a mild size increase with distance, from a typical 2.5 pc inside 10 kpc, to 4 pc at 50 kpc.
Such a trend for the M87 GCs was noticed previously in the central regions (Larsen & Brodie, 2003; Harris, 2009b; Madrid et al., 2009), and our data now indicate that it extends much farther out; beyond 40 kpc, no GCs more compact than pc are found. There are some tantalizing similarities to size-distance trends found in other galaxies (Sharina et al., 2005; Spitler et al., 2006; Barmby et al., 2007; Cantiello et al., 2007; Harris, 2009a; Paolillo et al., 2011; Hwang et al., 2011), and to the absence of compact GCs in the Milky Way halo beyond 25 kpc (Mackey & van den Bergh, 2005).
Unfortunately, the reality of the distance trends in M87 is difficult to establish because our sample selects for brighter objects in the outer regions. A mild size-luminosity correlation could cause an apparent size-distance trend, and vice-versa. In an attempt to reveal genuine trends, we analyze the four-dimensional space of size, luminosity, projected distance, and metallicity, adopting a power-law model for the GCs and UCDs as follows:
| (1) |
where we use the color as a proxy for the logarithm of metallicity . We carry out a least-squares fit to the data for the GCs and UCDs separately (considering the spectroscopic sample only, and ignoring the intermediate objects with 5–10 pc), and estimate the uncertainties using bootstrap simulations. We find (, , ) for the GCs, and (, ) for the UCDs (where the color diversity is not enough to fit for ; forcing to the GCs for comparison does not significantly change their results for and ).
These fits imply that the sizes of M87 GCs are more likely to be connected to luminosity and metallicity than to distance555Jordán et al. (2005) and Masters et al. (2010) found near zero for GCs in a large sample of early-type galaxies in Virgo and Fornax, including M87. Our analysis applies to a relatively bright spectroscopic sample, while for the fainter GCs we agree that appears to be close to zero.. The GCs have fairly constant with distance at a fixed luminosity (particularly if the blue or red GCs are considered separately), and the compact objects beyond 40 kpc may be missing simply because only very bright objects (which have large sizes) were sampled. The M87 UCDs show no significant overall correlation of size with luminosity, and a mild anti-correlation with distance666This anti-correlation may be sensitive to how the concentrations are handled in the size-fitting, but in any case a significant positive correlation appears to be ruled out..
We next consider the proposition that GCs or UCDs around a galaxy are tidally limited, i.e., they fill their tidal radius . We assume that they have fairly homologous luminosity profiles, so that the value of is roughly the same for every GC/UCD. The latter proposition has some support from theory (Küpper et al., 2008; Hurley & Mackey, 2010) and from observations of extended clusters (ECs) in the Milky Way halo (Baumgardt et al., 2010).
Following Baumgardt et al. (2010), the predicted , or Jacobi radius (which is not necessarily the same as the tidal radius from a King model fit), is:
| (2) |
where is the circular velocity of the host galaxy and is the total mass of the satellite object. We have substituted the projected distance as a rough proxy for the 3-D distance, after multiplying by to account for a median viewing angle of . If is nearly constant with distance (as suggested by the dynamical analysis of S+11), and scales closely with , then the tidal limitation scenario predicts the size scaling exponents and .
This tidal model may explain the observed size-distance relation of Milky Way halo clusters, with 0.4–0.5 (van den Bergh et al. 1991; McLaughlin 2000; Larsen & Brodie 2003; Mackey & van den Bergh 2005; Baumgardt et al. 2010; cf Gieles et al. 2011). However, the overall GCs and UCDs around M87 are inconsistent with this Milky Way finding, with the fits suggesting little or no distance dependence. This implies that the M87 objects’ sizes are in general not strongly influenced by tides777Projection effects will dilute any genuine dependence of size on 3-D distance. We have not attempted to model such effects for M87, but previous work in this galaxy’s central regions suggests that may be approximately halved in projection (Jordán et al., 2005). In this case, a tidal model is still strongly excluded for the M87 GCs..
Examining the luminosity trends in more detail, there may be an interesting pattern emerging for the lower-luminosity objects (with between and ). In the left panel of Figure 4, some of the GCs and UCDs appear to coincide on a narrow diagonal track extending from 4 pc at 2.5 kpc to 25 pc at 30 kpc. This track is mainly driven by the ACS photometric sample of GCs, which should be complete and unbiased. The slope of is remarkably similar to the tidal-limitation prediction. Attempting to model this track using Equation 2, we adopt 500 km s-1, a typical mass of , and then adjust the tidal to half-light radius ratio to match the data: .
The statistical robustness of this finding is unclear (e.g., we have somewhat arbitrarily chosen the magnitude limits), but we mention it to motivate future investigation and to provide a tentative clue that some of the fainter UCDs may be related to more compact GCs. As we discuss below, the existence of such a subpopulation would be consistent with the notion of a distinct mode of diffuse star cluster formation, producing objects whose sizes are tidally limited.
No such relationship would be inferred from consideration of the bright UCDs alone, although a few of these could be roughly consistent with the “tidal trend” of the faint UCDs, after rescaling for mass (see right panel of Figure 4). We also provide estimated values for all of the UCDs individually in Table 1, using Equation (2) as before, with an assumed mass-to-light ratio of in solar units. Note that projection effects will scatter objects around a genuine tidal trend, but there may be too many faint UCDs scattered leftwards. Some of these (e.g., H44905 and S8005 with ) would be worth more detailed follow-up to look for indications of dark matter or ongoing disruption888Two-body relaxation should not be driving large sizes for any of the UCDs, as the timescales are at least 10 Gyr for all of the objects.. At very small distances ( 1–3 kpc), there are no compact objects larger than 8 pc, suggesting that any extended objects in these central regions are disrupted very quickly.
Overall, there may be a population of UCDs following the scaling relations recently suggested for ECs, namely (Hurley & Mackey, 2010, after accounting for a difference between 2-D and 3-D radii). Ultimately, though, most of the UCDs (at all luminosities) have sizes 4 times smaller than this, while still being much larger than compact GCs. This would apparently argue against a diffuse, tidally-limited mode of star cluster formation as the origin of these UCDs. There is, potentially, also a problem for the stripped nuclei scenario, since these are by definition tidally-limited objects. However, the scaling relations discussed above may not apply to these objects because of their initial two-component structures (nucleus plus envelope).
5. Color-magnitude diagram and comparisons with dwarf elliptical nuclei
In addition to direct size-related analyses of the M87 UCDs, we may survey their other properties for commonalities with star clusters and galaxy nuclei that could reveal shared heredity or physical influences. These properties include color, age, and metallicity information; and kinematics (in the next Section).
5.1. Color-magnitude diagram
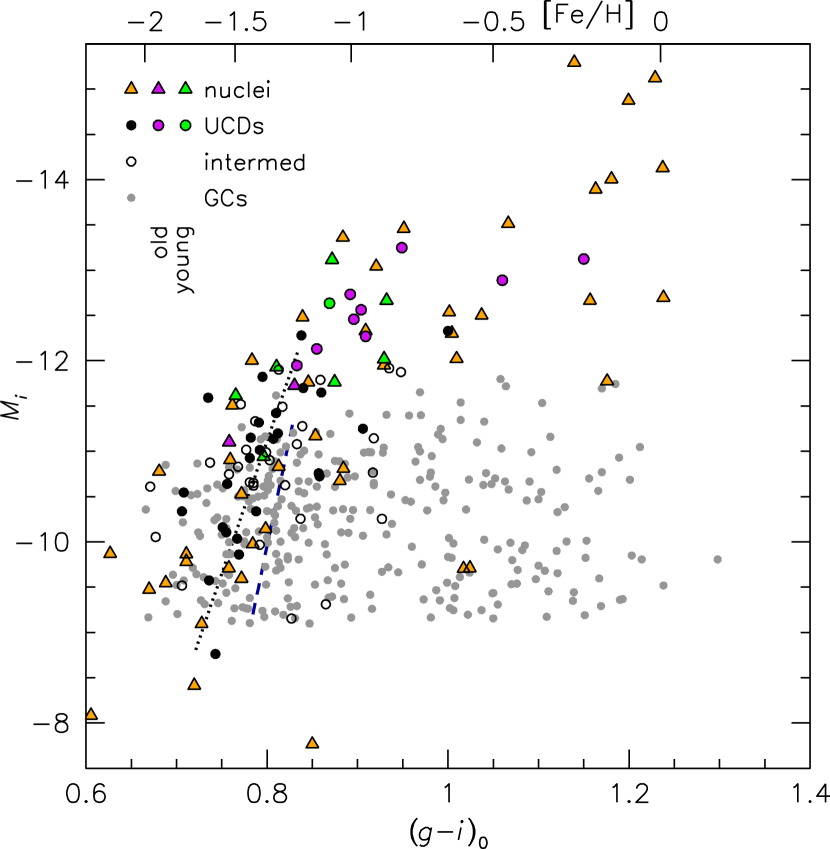
In Figure 5 we present the color-magnitude diagram (CMD) of M87 GCs and UCDs (those with spectroscopy and measured sizes). For magnitudes fainter than , the UCDs have a remarkably narrow range of colors, compared to the overall GC population, or even to the blue GC subpopulation. The faint UCD colors are slightly bluer than the blue GC peak, and follow a “blue tilt” of redder colors with increasing luminosities. Among GCs, the blue tilt has been interpreted in terms of self-enrichment (e.g., Harris et al. 2006; Strader et al. 2006; Mieske et al. 2006b; Strader & Smith 2008; Bailin & Harris 2009). At the brightest magnitudes, a few UCDs scatter to the red and it is initially tempting to associate these with a different UCD formation channel.
Also marked in Figure 5 are intermediate-size objects ( 5–10 pc). Many of these lie close to the blue color sequence established by the more extended objects, suggesting a close relationship. A revision of the UCD boundary to sizes smaller than 10 pc may be warranted (we will return to this point later).
We also plot the data for nuclei from a sample of early-type Virgo galaxies (Côté et al., 2006). The color trend for these nuclei tracks that of the UCDs closely, including both the narrow blue locus and the sharp transition to red colors at bright magnitudes. This was noticed before (e.g., Evstigneeva et al. 2008; Norris & Kannappan 2011) for bright objects, and we now find that the close coincidence extends to the new low-luminosity area of parameter space for UCDs.
A general implication is that the UCDs and nuclei have experienced very similar self enrichment processes. A long-standing suggestion also becomes more probable, that UCDs have their origins as nuclei that have since been stripped by tidal forces. The bend in the UCD color distribution could then be due to a transition from dwarf early-type (dE) to giant early-type progenitors (e.g., Norris & Kannappan 2011). Note, though, that apart from one extremely red object that is very large ( 100 pc), there is no particular tendency for these red objects to be larger than the average UCD.
A narrow color spread for the blue GCs would normally imply that they are a coeval population. Surprisingly, the spectroscopic age estimates for a very limited subset of these M87 UCDs and dwarf nuclei (based on Lick indices; Paudel et al. 2010, 2011) suggest that both young and old objects in both categories conform to the same color-magnitude trends (Figure 5). It is a puzzling coincidence that young and old nuclei can have the same colors at a given luminosity. Accurate age determinations are notoriously difficult and the sample of objects with age estimates is small, but this intriguing result should motivate extending age studies to larger samples of both UCDs and dwarf nuclei. Nonetheless, the color offset between the UCDs and the blue GCs underscores a distinction between these two populations and again argues against a UCD origin from star clusters, or mergers of star clusters, that were analogous to the GCs that survive today.
In the right panel of Figure 5 we compare the size-luminosity parameter space for the same objects that were plotted in the left panel. Overall, the dE nuclei are systematically brighter at a given size than the UCDs. If the brighter nuclei are found to be young, this luminosity offset might be simply explained as a result of fading (by 2 mags). This would imply that some of the compact “GCs” are really “UCDs” in the sense that they are stripped nuclei (e.g., Freeman 1993).
An alternative way to view the data is that the UCDs are larger than nuclei at a given luminosity, which could then be interpreted as post-stripping expansion (e.g., Evstigneeva et al. 2008). It may be that the nuclei both expand and fade after stripping, although one might then wonder why more of the bright UCDs have not been found with sizes in the 30–100 pc range.
Again, a larger number of accurate age estimates would clarify the situation. To this end, we have carried out a preliminary analysis using environmental density as a proxy for age, since there appears to be a strong correlation between density and nucleus age (Paudel et al., 2010, 2011). We find indications that the “older” nuclei may have faded by only 1 mag, leaving expansion as a requirement to match the UCD sizes.
In more detail, the brighter nuclei () show a strong size-luminosity correlation, which flattens out at lower luminosities. Whether or not the UCDs and GCs follow the same type of trend (with a luminosity offset) is not clear, particularly with the luminosity-dependent selection effects in the current sample. Even with ideal data, the interpretation would be complicated by the current theoretical uncertainty about the size evolution of nuclei after stripping. Therefore it is difficult at this point to draw firm conclusions about the UCD origins from size-luminosity trends.
Figure 5 also provides a useful point of comparison with the joint size-luminosity and color-magnitude analyses of several GC/UCD systems carried out by Norris & Kannappan (2011). They claimed a transition luminosity or “scaling onset mass” in both parameter spaces, above which strong blue-tilt and size-luminosity relations set in (similar transitions have been found in metallicities, velocity dispersions, and mass-to-light ratios; e.g., Haşegan et al. 2005; Mieske et al. 2006a, 2008; Rejkuba et al. 2007). This luminosity of corresponds to in our plots, where we see no evidence of such a transition in M87. It could be that this luminosity is where the proportion of UCDs and GCs varies rapidly (Figure 3), with neither population on its own having strong trends in size-luminosity, etc. It is also an open question as to whether or not a significant population of UCDs exists at magnitudes fainter than .
5.2. Age and metallicity relations
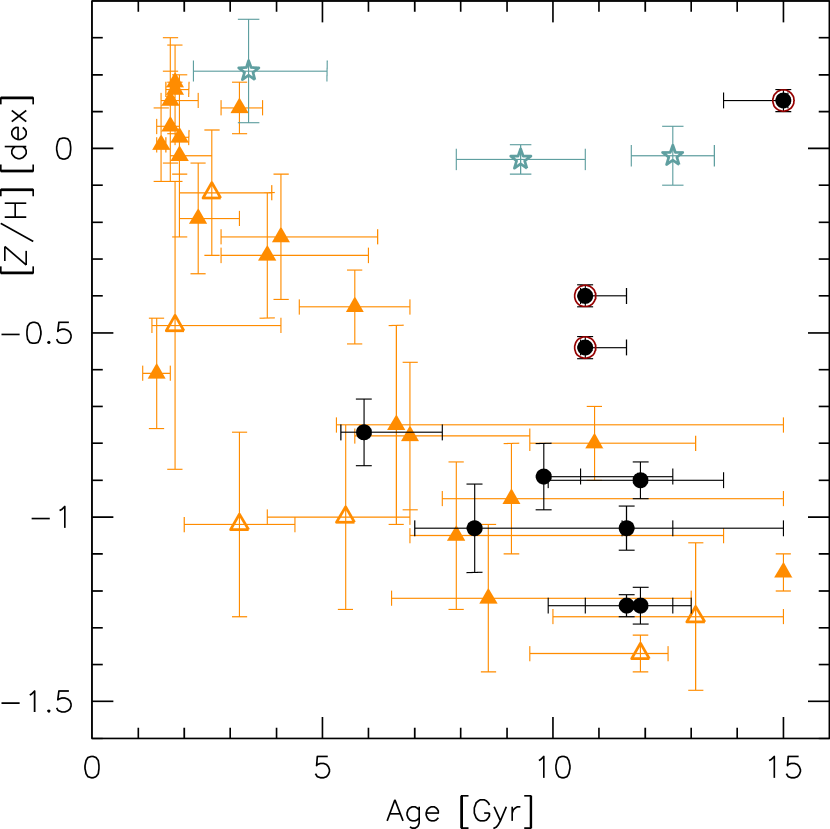
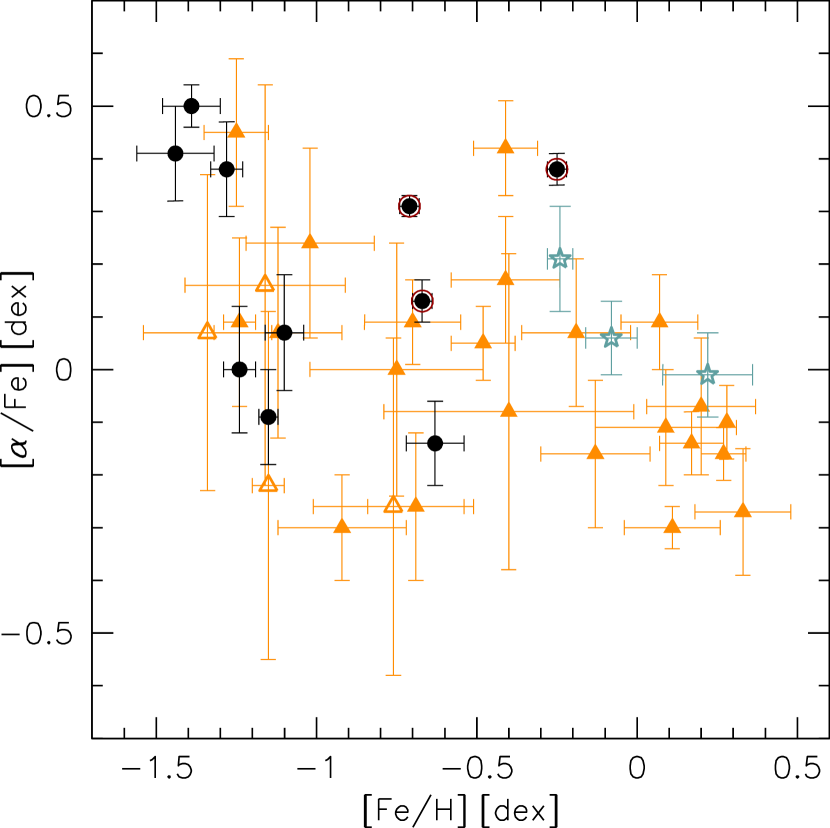
Moving on to another area of parameter space, Figure 6 shows the spectroscopy-based stellar populations analysis of M87 UCDs and Virgo dE nuclei from Paudel et al. (2010, 2011). Before comparing these objects, it should be kept in mind that these UCDs are all found in the high-density surroundings of M87, while the nuclei are drawn from a broad range of environmental densities within Virgo. Given the age-density correlation already mentioned for nuclei, the fairest point of comparison is between the UCDs and the older nuclei.
After taking this aspect into account, and keeping in mind that the luminosity-weighting in such spectroscopic analyses makes comparisons difficult to interpret, we notice a broad correspondence between the UCDs and dE nuclei in their age-metallicity relations (AMRs) and -element abundance distributions (as a function of mean metallicity). The AMR for the UCDs and dE nuclei somehow conspires to result in a narrow color-magnitude track for both classes of object (Figure 5, left panel).
These comparisons reinforce the suggestion from the CMD that most of the UCDs originate from dE nuclei. Notice, though, the three separately tagged UCDs in Figure 6. These correspond to the bright, red UCDs that we linked earlier to the stripped remnants of more massive galaxies; they are again quite distinct from the general run of dE nuclei and UCDs.
Another intriguing result from Figure 6 is that the AMRs of the faint and bright dE nuclei may be systematically different in the sense that the faint nuclei have lower metallicity at a given age (equivalent to a mass-metallicity correlation at each age) and lower [/Fe] at a given metallicity. The trends for the UCDs are not clear from the existing data. Spectroscopic analyses are needed in particular for the new class of low-luminosity object, as well as for ordinary compact GCs around M87.
Further discussion of the stellar populations implications in a wider context will be provided in Section 7.
6. Kinematics
Understanding the origins of UCDs will ultimately require information in addition to size, luminosity, age, and metallicity trends. Two additional discriminators are their spatial and velocity distributions (which are both projections of an underlying orbital distribution). UCDs that are tidally stripped nuclei may be expected to reside on preferentially radial orbits that result in a centrally-concentrated number density distribution, a projected velocity dispersion profile that declines strongly with distance, and a peaky, broad-winged shape to their line-of-sight velocity distribution (see Bassino et al. 1994; Bekki et al. 2003; Bekki 2007; Goerdt et al. 2008; Thomas et al. 2008). Alternatively, UCDs that formed as extended star clusters might show an increasing dispersion profile and a flat-topped velocity distribution999These predictions are discussed in more detail in S+11. Note that on the mass and distance scales involved here, dynamical friction should not be a significant effect, and any kinematical peculiarities should instead be related to orbital dependencies of the formation process..
The density distribution of the M87 UCDs will require further analysis that carefully considers selection effects, but their kinematics have been analyzed in detail in S+11 and add to the indications from the color-magnitude diagram that the UCDs are distinct from the general GC population, and not simply a tail of the GCs to large sizes101010A similar conclusion was reached by Gregg et al. (2009), based on differences (although in the opposite sense to those found here) in mean velocity and velocity dispersion between bright and faint GCs and UCDs around NGC 1399 (no size information was used)..
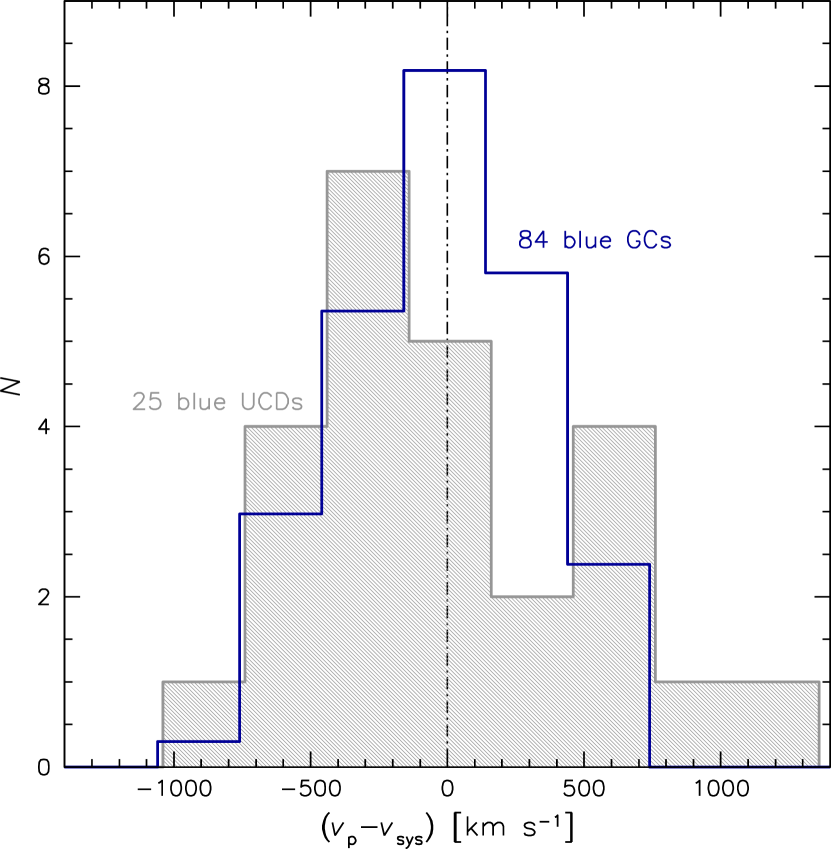
Briefly, over the distance range of 10–35 kpc (where the data are available for both UCDs and compact GCs), the UCDs and intermediate-size objects show a broader, flatter distribution of recession velocities than the GCs (considering only the blue GC subpopulation for a fair comparison).
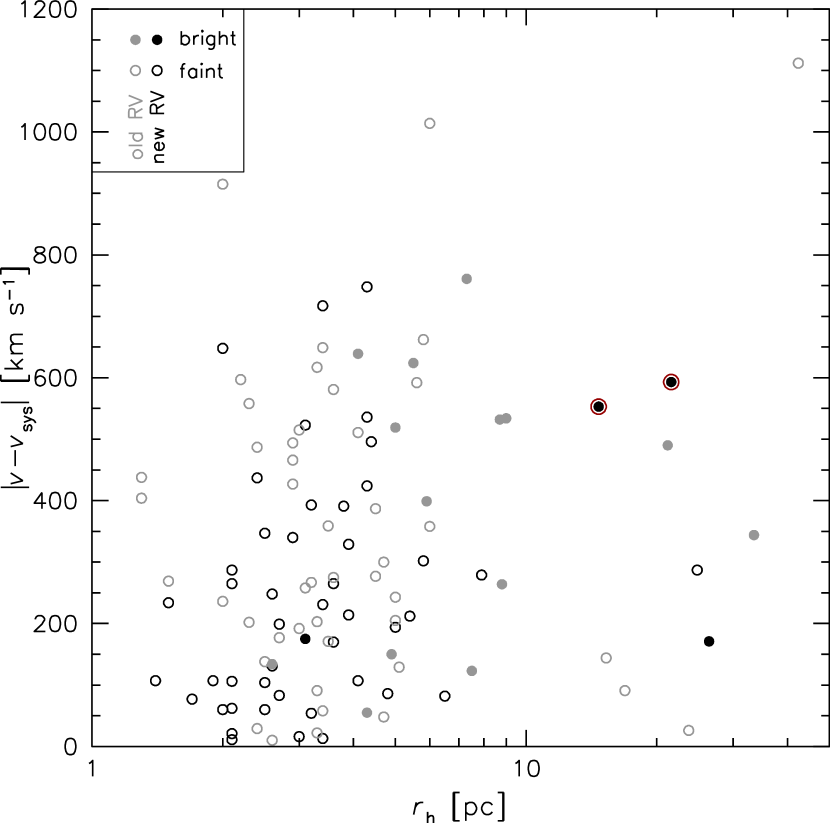
To illustrate this point further, we plot velocity vs. size in Figure 7, where the UCDs, intermediate-size objects, blue GCs are shown together. The velocity distribution of compact objects appears to have the expected Gaussian distribution, but the larger objects show a tendency to avoid the systemic velocity. This behavior seems to set in for 5 pc, supporting our suggestion from color considerations (Section 5.1) that many of the intermediate-size objects should be identified as small UCDs.
With 5 pc as the GC-UCD boundary, the velocity dispersions of the GCs and the UCDs are km s-1 and km s-1, respectively. A Kolmogorov-Smirnov test finds that the velocity distributions are different at the 70% confidence level.
S+11 discussed the M87 UCD velocities in more detail, including the trends with distance and luminosity. The UCD velocity dispersion profile remains constant, and the shape of the velocity distribution changes in a complicated way, neither of which is uniquely and straightforwardly explained by either of the formation scenarios under consideration. It is possible that the blue UCDs comprise a mix of two different populations, with objects of dE nuclei and star-cluster origins becoming more dominant at the bright and faint ends of the luminosity range, respectively. Further theoretical work and better statistics are needed to draw firmer conclusions about UCD origins from kinematics.
7. Discussion
Up to this point, we have focused on the M87 GC/UCD system as a high-quality, well-characterized, homogeneous dataset from a single environment. Now we seek to understand UCDs in a broader context, using literature data and results from other systems. We start by examining basic trends in size and luminosity, and then attempt to survey a broad range of their properties in order to converge on an integrated view of their formational histories.
To orient the discussion, we consider a basic though non-exhaustive set of four formation scenarios for UCDs. The first is that they are “giant GCs”, an extension of the normal GC population to very high masses, which naturally lead to large sizes owing to mass-dependencies of formation or internal evolution (e.g., Murray 2009; Gieles et al. 2010). The second is that they are produced by normal star clusters that have collided (e.g., Fellhauer & Kroupa 2002). We refer to these as merged GCs. The third is that they pertain to an independent mode of diffuse star cluster formation that includes the lower luminosity ECs (e.g., Brüns et al. 2011). The fourth is that they are stripped galactic nuclei (e.g., Bekki et al. 2001; Goerdt et al. 2008).
Two “smoking guns” provide direct evidence that UCDs can form in at least two distinct ways: W3 is likely a merged GC (Maraston et al., 2004; Fellhauer & Kroupa, 2005), and NGC 4546 UD1 is likely a stripped nucleus (Norris & Kannappan, 2011). Below, as we review the sundry properties of UCDs, we will comment at each stage on the compatibility of the data with these different formation scenarios, and then try to tie together the various lines of evidence into an integrated picture of UCD origins.
7.1. Size and Luminosity Comparisons
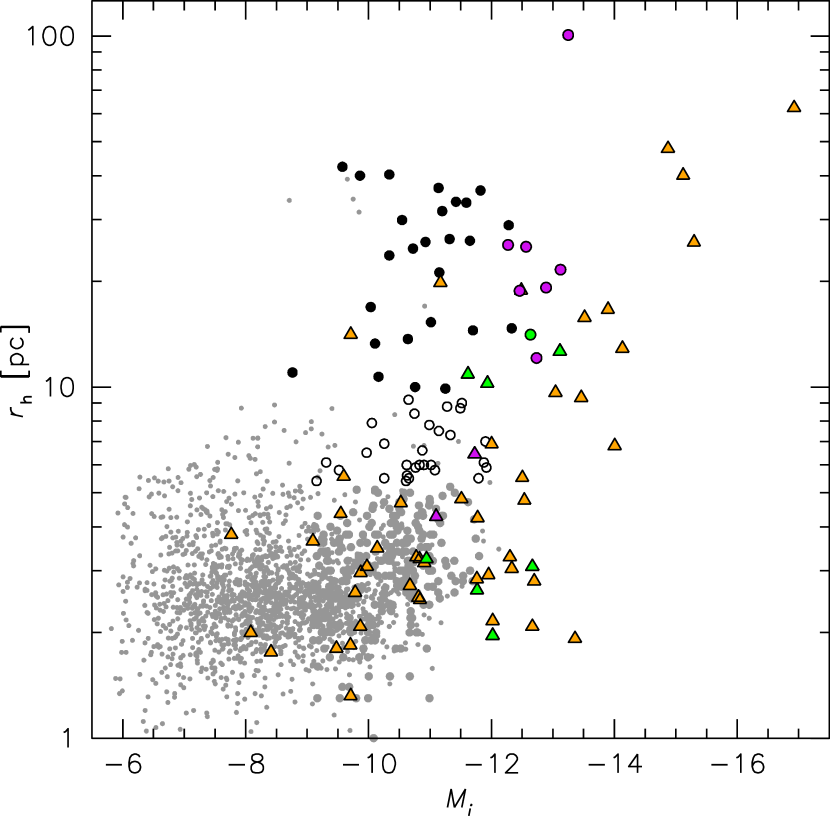
We assemble from the literature a compilation of the sizes and luminosities of hot stellar systems, from the largest galaxies to the smallest GCs. We restrict the sample to objects with distances confirmed either by spectroscopy, surface brightness fluctuations, or resolved stellar populations. In order to not complicate the analysis with large stellar mass-to-light ratio variations, we also include only old objects (ages 5 Gyr) where possible, e.g., excluding some young, extended clusters that are known in the LMC and beyond. The results are plotted in Figure 8, with the details, references, and full data table provided in Appendix A.
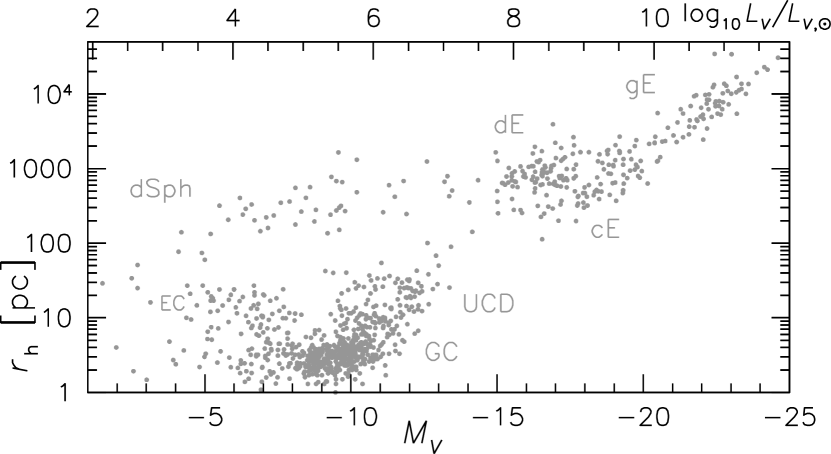
There are various interesting features in the size-luminosity parameter space. The most compact objects include the classical population of GCs with 2–4 pc, the UCDs which extend up to 50 pc, and the fainter ECs up to 25 pc, which comprise not only extended clusters (Huxor et al., 2005, 2008, 2009, 2011a; Mackey et al., 2006; Stonkutė et al., 2008; Mouhcine et al., 2010; Cockcroft et al., 2011; Hwang et al., 2011), but also faint fuzzies (Larsen & Brodie, 2000; Brodie & Larsen, 2002; Sharina et al., 2005; Hwang & Lee, 2006, 2008; Chies-Santos et al., 2007; Scheepmaker et al., 2007), “diffuse star clusters” (Peng et al., 2006), and the Palomar clusters in the Milky Way halo.
There is then an apparent gap between galaxies and star clusters, which is now seen to be a diagonal region rather than a simple size gap (cf the “Shapley line” of van den Bergh 2008; and also Gilmore et al. 2007; Forbes et al. 2008; Tolstoy et al. 2009; Misgeld & Hilker 2011). This gap corresponds roughly to a line of constant surface brightness, , so there may be a selection effect at work here, with deeper imaging and spectroscopic surveys needed. There are a few, possibly rare, “bridging” objects between the UCDs and the cEs, which as we discuss below, may imply that star clusters and galaxies are not completely distinct populations.
Considering the UCDs and noting the typical strong selection biases against objects fainter than , we see that the data suggest a nearly flat size trend that parallels the compact GCs. The previous paradigm of a strong size-luminosity trend for UCDs is trumped by the new discoveries of low-luminosity UCDs, mostly from around M87 but also from a few other galaxies. This includes the Milky Way where the halo cluster NGC 2419 was long thought to be a unique object, while it can now be seen as a harbinger of the new class of UCDs (see black square in the lower panel Figure 8).
We thus see that standard identifications of UCDs by luminosity alone are inadvisable, as they coexist with compact GCs over a factor of 15 range in luminosity. The best that can be done in the absence of direct size information is to estimate the probability of a given object being a UCD or a GC (cf Figure 3), with objects more luminous than fairly safely designated as UCDs.
Interestingly, both giant GCs and stripped nuclei are expected to follow strong size-luminosity (-) relations and yet we find no such relation for the M87 UCDs. Upon closer scrutiny over the full range of luminosities, the - relation for nuclei is not particularly strong (see Section 5.1). The lack of an - relation for UCDs is, however, a stronger discriminant against the giant GC formation scenario. Here theory predicts that an - relation will be imprinted by the physics of massive cluster formation. For merged GCs, a range of sizes are possible at a given luminosity (Brüns et al., 2011).
Another observation from Figure 8 is a hint of a gap in the UCD size distribution at 15–20 pc (see also middle panel of Figure 3), which was previously noticed for the UCDs near the center of a galaxy cluster by Blakeslee & Barber DeGraaff (2008). Such a feature might imply different modes of UCD formation, and will merit further examination with larger samples.
There also appears to be a magnitude gap between UCDs and ECs from to (also called the “avoidance zone” by Hwang et al. 2011). Since NGC 2419 has often been proposed as an accreted nucleus (e.g., Mackey & van den Bergh 2005; Cohen et al. 2010), and ECs are normally seen as bona fide star clusters, it is natural to interpret this as a real gap between nuclei and clusters. In this case, H39168 from our sample would be the most luminous EC ever confirmed (), and S1508 would be the least luminous UCD ().
It is also possible that there is a continuum of extended objects, from ECs to UCDs (where NGC 2419 has alternatively been viewed as a star cluster), and that the gap is an area of parameter space that has simply been inadequately surveyed around nearby galaxies (cf Richtler 2006). While ECs in the Milky Way halo have often been identified as ordinary GCs in a late expansion stage of their evolution (e.g., Gieles et al. 2010), there is also an emerging picture of two universal modes of star cluster formation, compact and extended (Elmegreen, 2008; Pfalzner, 2009; Da Costa et al., 2009; Baumgardt et al., 2010). Given such a scenario, it is plausible that at least some of the ECs and UCDs share a similar origin (e.g., Brüns et al. 2011).
The mix of UCD origins may change with luminosity, as we have found hints that some of the fainter objects are star clusters (see also Haşegan et al. 2005) that may be linked to the even fainter class of ECs. Many of these objects may have formed around dwarf galaxies that were later accreted and stripped by larger galaxies.
Note, though, that ECs may themselves not be a homogeneous class. They include, for example, faint fuzzies that are very metal-rich and -enhanced, and could be associated with mergers of either galaxies or young star clusters (Larsen & Brodie, 2002; Burkert et al., 2005; Brüns et al., 2009). On the other hand, the M87 objects that may be tidally-limited (Section 4) are generally metal-poor (blue), as is the local faint-UCD analog, NGC 2419.
Focused study on objects bordering the current EC-UCD luminosity gap may reveal whether or not they are related. E.g., is H39168 (black triangle in Figure 8) around M87 the brightest of the fuzzies or the “wimpiest” of the UCDs? Other fairly nearby candidate bright-fuzzies/wimpy-UCDs, besides those around M87, include NGC 2419, NGC 361 in the SMC, 90:12 around NGC 1399 (Richtler et al., 2005), and C1 around NGC 5128 (Woodley & Gómez, 2010).
7.2. Age and Metallicity Comparisons
Resolving the questions of UCD connections and origins will require bringing together more information than just size and luminosity. Previously, high [/Fe] values measured for UCDs and intermediate-size objects around various galaxies suggested early, rapid formation, and similarities to normal GCs rather than to nuclei, which were thought to have more extended star formation histories (Mieske et al., 2007; Evstigneeva et al., 2007; Firth et al., 2009; Taylor et al., 2010; Da Rocha et al., 2011). However, we have seen in Section 5.2 that both M87 UCDs and Virgo nuclei can have a range of [/Fe] values, which is further supported by data for three other UCDs from the literature (plotted in Figure 6, right). This is also the case for normal GCs (e.g., Pritzl et al. 2005; Woodley et al. 2010a), so the [/Fe] implications are not yet clear.
Our examination of the age-metallicity relation suggests two types of UCDs: one type with a similar trend to dE nuclei, and another that is offset to higher metallicities (Figure 6, left; see also Chilingarian et al. 2008). In Virgo/M87, the UCD color-magnitude relation tracks that of the nuclei remarkably well, including a rapid transition to redder colors at high luminosity. Similarly, Chiboucas et al. (2011) found that UCDs in the Coma cluster include a population of red objects with similar ages and metallicities to elliptical galaxies, as well as blue objects more similar to dE nuclei.
Such distinctions are reminiscent of the inner and outer halo GCs of the Milky Way (e.g., Forbes & Bridges 2010; Dotter et al. 2011), and suggest that there may be generically two populations of UCDs: one associated with massive (and therefore metal-rich) bulge formation, and another with dwarf galaxy accretion. Galaxy-to-galaxy variations in the prevalence of these two populations (e.g., NGC 1399 vs. M87; Mieske et al. 2006a) might then reveal differences in star formation history and galaxy assembly (cf Johnston et al. 2008). It is worth noting that an association with massive bulge formation could encompass UCDs as remnant nuclei of massive galaxies and/or as products of star cluster collisions during bulge formation.
7.3. Orbital Dynamics
Another fundamental but relatively unexplored line of evidence for UCD origins is their orbital dynamics, as encoded in their positions, velocities, and sizes. We have carried out the first ever detailed analysis of size-distance trends in a UCD system using our M87 dataset, finding that most of the UCDs show little evidence of following standard expectations from tidal limitation. A comparably weak size-distance trend was also found for luminous UCDs in the core of Coma (Chiboucas et al., 2011). Although more theoretical work is needed, these findings may favor a giant GC formation scenario, rather than ECs, merged star clusters, or stripped nuclei which might be expected to show tidal trends (e.g., Brüns et al. 2011). The exception is the subset of low-luminosity M87 UCDs that appear to join up with some of the more compact objects to define a tidally-limited size-distance trend, suggesting that they are a family of ECs.
In M87, there is a significant kinematical difference between blue GCs and blue UCDs (including intermediate-size objects for the sake of useful statistics), such that the UCDs have a broader distribution of velocities. This finding strengthens the conclusion that UCDs are a population that is distinct from compact GCs. However, EC or stripped nuclei origins are not yet clearly distinguished by the kinematics, possibly because there is more than one class of UCD (Section 6). The conclusions are also limited by the lack of clear theoretical predictions for kinematics.
In other galaxies, higher velocity dispersions and more flat-topped velocity distributions have been found for the brighter “GCs”, which is similar to the trends in M87 if the brighter “GCs” with unmeasured sizes are assumed to be mostly UCDs (Romanowsky et al., 2009; Schuberth et al., 2010; Woodley et al., 2010b). The “UCD” system of NGC 1399, the central massive elliptical in the Fornax cluster, has been studied in some detail. Here the UCDs’ compact spatial distribution and low projected velocity dispersion toward the galaxy center are suggestive of star cluster origins, with further work still needed to consider trends with color, luminosity, and size (Thomas et al. 2008; Gregg et al. 2009; cf also Wehner & Harris 2007; Misgeld et al. 2011).
7.4. Other Clues to be Explored
More detailed analyses of associations in kinematic/metallicity/size/luminosity/position phase-space may provide insight into the origins and interconnections of UCDs, GCs, nuclei, and ECs. For instance, UCDs that were formerly galactic nuclei might be accompanied by their original satellite GCs; or UCDs that formed as star clusters from a discrete star-forming event along with other GCs, would be expected to form a phase-space group with their associated star clusters. A related prediction is that in a star cluster scenario, eventually more than one UCD will be found in a phase-space “group”, while this should never happen in the nuclei scenario. In M87, there are indications of phase-space associations (S+11) that motivate more effort in this area.
The internal dynamics of UCDs is another standard but challenging approach for deciphering their origins. Measurements of velocity dispersion can be used to map out fundamental-plane type relations with other stellar systems, and to test for mass-to-light ratio variations, including those due to any remaining dark matter accompanying threshed galaxy nuclei (e.g., Martini & Ho 2004; Haşegan et al. 2005; Evstigneeva et al. 2007; Collins et al. 2009; Taylor et al. 2010; Tollerud et al. 2011; Chilingarian et al. 2011; Forbes et al. 2011; Frank et al. 2011). So far, some UCDs have been found to have elevated mass-to-light ratios that may imply nuclei origins, and some have not. It is possible that multiple UCD types are again implied, and more work is needed to connect mass-to-light ratio trends with size, luminosity, metallicity, etc. In particular, velocity dispersion measurements of the new class of low-luminosity UCDs would be invaluable.
Other properties of UCDs that should also reflect their origins include their ellipticities and internal color gradients. However, due to the observational challenges, these aspects have not yet been examined sufficiently to provide strong evidence for any particular formational mechanism (e.g., Evstigneeva et al. 2008).
7.5. The Stripping Scenario
If nuclei are stripped to form UCDs, then we should occasionally see transition objects, typically with relatively high luminosities, large sizes, and signs of residual stellar material. Many “two-component” objects with extended stellar envelopes have indeed been found, both around M87 (VUCD7, S7023) and other galaxies (e.g., Drinkwater et al. 2003; Haşegan et al. 2005; Chilingarian & Mamon 2008; Chiboucas et al. 2011). Other more irregular objects with asymmetric extensions have also been found around M87 (S923; see Figure 9) and NGC 1399 (78:12; Richtler et al. 2005).
Many nuclei are observed to be compact, and the M87 intermediate-size ( 5–10 pc) objects have similar kinematical and color-magnitude behavior to the UCDs. These facts, along with the indications in the Local Group that objects like Cen, M54, and G1 (with 3–7 pc) are stripped nuclei (e.g., Mackey & van den Bergh 2005), all suggest that many intermediate-size objects could be considered as stripped-nucleus UCDs.
The general correspondence of many UCDs with galaxy nuclei in parameter spaces involving color, luminosity, age, metallicity, -element enhancement, and size (after possible evolution) supports a connection between these objects. Most of the metal-poor and metal-rich UCDs would then originate in the nuclei of dEs and more massive galaxies, respectively, with a subset of tidally limited faint objects that may be more closely related to star clusters.
These interpretations can be connected to a broad framework for different modes of galaxy assembly (e.g., Carollo et al. 2007; Zolotov et al. 2009; Forbes & Bridges 2010; Forbes et al. 2011; Oser et al. 2010; Arnold et al. 2011; Font et al. 2011). The blue UCDs formed from stripped nuclei can be considered part of the outer halo build-up by accretion of low-mass infalling satellites at relatively late epochs, depositing accompanying GCs and field stars as well. The red UCDs could be associated with metal-rich bulge formation in the context of larger galaxies whose nuclei, or satellite extended clusters, became these UCDs.
8. Summary and Conclusions
We have used HST imaging, and spectroscopy from Keck and the MMT, to double the sample of UCDs around M87. These 34 UCDs form the largest such confirmed sample around any galaxy. Assisted by precise size measurements and deep spectroscopy, we have been able to explore a new region of the size-luminosity parameter space and have discovered objects with large sizes but low luminosities – a new type of UCD. Their inclusion erases the size–luminosity relation that was formerly thought to exist for, and even define, UCDs. The new sample includes the lowest surface brightness cases confirmed to date.
This unprecedentedly large, wide-ranging, and homogeneous sample informs our exploration of the origins of these extended star systems that we have attempted to generalize in the context of the “zoo” of galaxies and star clusters. After initially defining UCDs as objects in the 10–100 pc size range, we find the following results of note:
-
•
The new class of low surface brightness UCD identified in M87 has a few counterparts in other systems, including NGC 2419 in the Milky Way halo.
-
•
Another 50 UCDs can probably be found around M87 through further HST and spectroscopic surveys. Special attention is warranted for four candidate low-surface brightness UCDs identified in the central regions.
-
•
The GC sizes in M87 correlate with luminosity and color but not with galactocentric distance. The lack of a distance trend argues against the GC sizes being driven by tidal limitations.
-
•
The UCD sizes in M87 show a weak overall anti-correlation with distance, and no overall luminosity dependence. Again, tidal effects are not apparent.
-
•
A subset of lower luminosity GCs and UCDs near the central regions of M87 appear to show a tight size-distance trend that may imply tidal effects for these objects.
-
•
The region of size-luminosity parameter space occupied by the M87 UCDs does not match up well with Virgo galaxy nuclei, unless age differences and UCD expansion are invoked.
-
•
In M87, most of the UCDs are blue and show a tight color-magnitude relation with a small “tilt”, offset from the trend for the blue GCs. A small subset of the UCDs extends to red colors and high luminosities.
-
•
Based on spectroscopic studies from the literature, both in M87 and elsewhere, UCDs are generally old and have a range of -enhancement. They may split into two subpopulations following tracks in age and metallicity space that are analogous to inner and outer halo GCs in the Milky Way. It is not clear whether this is a true bimodality, or part of a continuous trend with metallicity or luminosity.
-
•
The Virgo dE nuclei show remarkable coincidence with M87’s blue UCDs in color-magnitude and age-metallicity space. These similarities may strengthen when only nuclei in denser environments are considered. The red UCDs may likewise coincide with the nuclei of more massive galaxies.
-
•
The M87 UCDs have a higher line-of-sight velocity dispersion, and less peaked velocity distribution, than the blue GCs. There are hints that this effect is driven by the brighter UCDs.
-
•
M87 objects in the 5–10 pc intermediate-size range show similarities to the larger objects in their kinematics and in the color-magnitude diagram. It may therefore be appropriate to empirically revise the size boundary between UCDs and bright GCs to 5 pc, which would encompass objects like Cen.
-
•
There is a diagonal gap between galaxies and compact stellar systems in size-luminosity space. The presence of a few bridging objects between UCDs and compact ellipticals suggests that at least some of the more luminous UCDs are related to galaxies.
-
•
There is a hint of a size gap among the UCDs at 15–20 pc, which might imply the existence of UCD subpopulations.
-
•
There is a zone of avoidance between UCDs and ECs that might be a product of observational selection effects, requiring investigation through more systematic surveys.
-
•
Two peculiar compact objects are identified that could be UCDs in the process of forming, and that merit additional study.
We synthesize this novel set of empirical constraints into implications for UCD formation in the context of four scenarios: giant GCs, merged clusters, luminous ECs, and stripped nuclei. The giant GC scenario appears to be strongly disfavored as a major contributor to the UCD population in M87, where we find differences between UCDs and blue GCs in kinematics and in color-magnitude space, and do not find the expected strong size-luminosity relation at the bright end. The color-magnitude finding also appears to argue against a merged GC scenario.
We propose that UCDs, both in M87 and in general, consist of three generic subpopulations that overlap in size-luminosity parameter space, requiring the joint study of other parameters to tease out the distinctions. The majority of the blue UCDs are identified with the threshed nuclei of dwarf ellipticals. The bright, red UCDs may be associated with the remnants of more massive, metal-rich galaxies. It is not yet clear if these would represent the actual nuclei (in which case this subpopulation is contiguous with the blue UCDs), or would be associated with merged clusters. Some of the less luminous, blue UCDs may be bona-fide star clusters. Whether these are equivalent to bright ECs, or have originated by merging, may be settled by determining whether or not the zone of avoidance is a real gap.
Each of these scenarios requires further theoretical analyses of dynamics and stellar populations to see if these can reproduce the observational results on orbital properties and the relations between size, luminosity, age, and metallicity. It will also be essential to increase the UCD sample size by pushing to lower luminosities in other galaxies, to consider carefully the observational selection effects, and to make more detailed studies of ages and metallicities in UCDs and galaxy nuclei. Such inquiries will provide new insight into both the formation of star clusters and the assembly of galaxy halos.
References
- Arnold et al. (2011) Arnold, J. A., Romanowsky, A. J., Brodie, J. P., Chomiuk, L., Spitler, L. R., Strader, J., Benson, A. J., & Forbes, D. A. 2011, ApJ, 736, L26
- Bailin & Harris (2009) Bailin, J., & Harris, W. E. 2009, ApJ, 695, 1082
- Barmby et al. (2007) Barmby, P., McLaughlin, D. E., Harris, W. E., Harris, G. L. H., & Forbes, D. A. 2007, AJ, 133, 2764
- Bassino et al. (1994) Bassino, L. P., Muzzio, J. C., & Rabolli, M. 1994, ApJ, 431, 634
- Baumgardt & Mieske (2008) Baumgardt, H., & Mieske, S. 2008, MNRAS, 391, 942
- Baumgardt et al. (2010) Baumgardt, H., Parmentier, G., Gieles, M., & Vesperini, E. 2010, MNRAS, 401, 1832
- Bekki et al. (2001) Bekki, K., Couch, W. J., & Drinkwater, M. J. 2001, ApJ, 552, L105
- Bekki et al. (2003) Bekki, K., Couch, W. J., Drinkwater, M. J., & Shioya, Y. 2003, MNRAS, 344, 399
- Bekki (2007) Bekki, K. 2007, MNRAS, 380, 1177
- Blakeslee & Barber DeGraaff (2008) Blakeslee, J. P., & Barber DeGraaff, R. 2008, AJ, 136, 2295
- Brasseur et al. (2011) Brasseur, C. M., Martin, N. F., Macciò, A. V., Rix, H.-W., & Kang, X. 2011, ApJ, submitted, arXiv:1106.5500
- Brodie & Larsen (2002) Brodie, J. P., & Larsen, S. S. 2002, AJ, 124, 1410
- Brüns et al. (2009) Brüns, R. C., Kroupa, P., & Fellhauer, M. 2009, ApJ, 702, 1268
- Brüns et al. (2011) Brüns, R. C., Kroupa, P., Fellhauer, M., Metz, M., & Assmann, P. 2011, A&A, 529, A138
- Burkert et al. (2005) Burkert, A., Brodie, J., & Larsen, S. 2005, ApJ, 628, 231
- Cantiello et al. (2007) Cantiello, M., Blakeslee, J. P., & Raimondo, G. 2007, ApJ, 668, 209
- Carlson & Holtzman (2001) Carlson, M. N., & Holtzman, J. A. 2001, PASP, 113, 1522
- Carollo et al. (2007) Carollo, D., et al. 2007, Nature, 450, 1020
- Chiboucas et al. (2011) Chiboucas, K., Tully, R. B., Marzke, R. O., et al. 2011, ApJ, 737, 86
- Chies-Santos et al. (2007) Chies-Santos, A. L., Santiago, B. X., & Pastoriza, M. G. 2007, A&A, 467, 1003
- Chilingarian & Mamon (2008) Chilingarian, I. V., & Mamon, G. A. 2008, MNRAS, 385, L83
- Chilingarian et al. (2008) Chilingarian, I. V., Cayatte, V., & Bergond, G. 2008, MNRAS, 390, 906
- Chilingarian et al. (2009) Chilingarian, I., Cayatte, V., Revaz, Y., Dodonov, S., Durand, D., Durret, F., Micol, A., & Slezak, E. 2009, Science, 326, 1379
- Chilingarian et al. (2011) Chilingarian, I. V., Mieske, S., Hilker, M., & Infante, L. 2011, MNRAS, 412, 1627
- Cockcroft et al. (2011) Cockcroft, R., et al. 2011, ApJ, 730, 112
- Cohen & Ryzhov (1997) Cohen, J. G., & Ryzhov, A. 1997, ApJ, 486, 230
- Cohen et al. (2010) Cohen, J. G., Kirby, E. N., Simon, J. D., & Geha, M. 2010, ApJ, 725, 288
- Collins et al. (2009) Collins, M. L. M., et al. 2009, MNRAS, 396, 1619 al. 2009, MNRAS, 396, 1619
- Côté et al. (2006) Côté, P., et al. 2006, ApJS, 165, 57
- Dabringhausen et al. (2008) Dabringhausen, J., Hilker, M., & Kroupa, P. 2008, MNRAS, 386, 864
- Da Costa et al. (2009) Da Costa, G. S., Grebel, E. K., Jerjen, H., Rejkuba, M., & Sharina, M. E. 2009, AJ, 137, 4361
- Da Rocha et al. (2011) Da Rocha, C., Mieske, S., Georgiev, I. Y., Hilker, M., Ziegler, B. L., & Mendes de Oliveira, C. 2011, A&A, 525, A86
- Dotter et al. (2011) Dotter, A., Sarajedini, A., & Anderson, J. 2011, ApJ, 738, 74
- Drinkwater et al. (2000) Drinkwater, M. J., Jones, J. B., Gregg, M. D., & Phillipps, S. 2000, PASA, 17, 227
- Drinkwater et al. (2003) Drinkwater, M. J., Gregg, M. D., Hilker, M., Bekki, K., Couch, W. J., Ferguson, H. C., Jones, J. B., & Phillipps, S. 2003, Nature, 423, 519
- Elmegreen (2008) Elmegreen, B. G. 2008, ApJ, 672, 1006
- Evstigneeva et al. (2007) Evstigneeva, E. A., Gregg, M. D., Drinkwater, M. J., & Hilker, M. 2007, AJ, 133, 1722
- Evstigneeva et al. (2008) Evstigneeva, E. A., et al. 2008, AJ, 136, 461
- Faber (1973) Faber, S. M. 1973, ApJ, 179, 423
- Fadely et al. (2011) Fadely, R., Willman, B., Geha, M., et al. 2011, AJ, 142, 88
- Fellhauer & Kroupa (2002) Fellhauer, M., & Kroupa, P. 2002, MNRAS, 330, 642
- Fellhauer & Kroupa (2005) Fellhauer, M., & Kroupa, P. 2005, MNRAS, 359, 223
- Firth et al. (2007) Firth, P., Drinkwater, M. J., Evstigneeva, E. A., et al. 2007, MNRAS, 382, 1342
- Firth et al. (2008) Firth, P., Drinkwater, M. J., & Karick, A. M. 2008, MNRAS, 389, 1539
- Firth et al. (2009) Firth, P., Evstigneeva, E. A., & Drinkwater, M. J. 2009, MNRAS, 394, 1801
- Font et al. (2011) Font, A. S., McCarthy, I. G., Crain, R. A., et al. 2011, MNRAS, 416, 2802
- Forbes et al. (2008) Forbes, D. A., Lasky, P., Graham, A. W., & Spitler, L. 2008, MNRAS, 389, 1924
- Forbes & Bridges (2010) Forbes, D. A., & Bridges, T. 2010, MNRAS, 404, 1203
- Forbes & Kroupa (2011) Forbes, D. A., & Kroupa, P. 2011, PASA, 28, 77
- Forbes et al. (2011) Forbes, D. A., Spitler, L. R., Graham, A. W., Foster, C., Hau, G. K. T., & Benson, A. 2011, MNRAS, 413, 2665
- Foster et al. (2011) Foster, C., Spitler, L. R., Romanowsky, A. J., et al. 2011, MNRAS, 415, 3393
- Frank et al. (2011) Frank, M. J., Hilker, M., Mieske, S., Baumgardt, H., Grebel, E. K., & Infante, L. 2011, MNRAS, 414, L70
- Freeman (1993) Freeman, K. C. 1993, The Globular Cluster-Galaxy Connection, 48, 608
- Geha et al. (2003) Geha, M., Guhathakurta, P., & van der Marel, R. P. 2003, AJ, 126, 1794
- Gieles et al. (2010) Gieles, M., Baumgardt, H., Heggie, D. C., & Lamers, H. J. G. L. M. 2010, MNRAS, 408, L16
- Gieles et al. (2011) Gieles, M., Heggie, D. C., & Zhao, H. 2011, MNRAS, 413, 2509
- Gilmore et al. (2007) Gilmore, G., Wilkinson, M. I., Wyse, R. F. G., Kleyna, J. T., Koch, A., Evans, N. W., & Grebel, E. K. 2007, ApJ, 663, 948
- Goerdt et al. (2008) Goerdt, T., Moore, B., Kazantzidis, S., Kaufmann, T., Macciò, A. V., & Stadel, J. 2008, MNRAS, 385, 2136
- Gregg et al. (2009) Gregg, M. D., et al. 2009, AJ, 137, 498
- Haşegan et al. (2005) Haşegan, M., et al. 2005, ApJ, 627, 203
- Haşegan (2007) Haşegan, I. M. 2007, Ph.D. Thesis, Rutgers Univ.
- Hanes et al. (2001) Hanes, D. A., Côté, P., Bridges, T. J., McLaughlin, D. E., Geisler, D., Harris, G. L. H., Hesser, J. E., & Lee, M. G. 2001, ApJ, 559, 812
- Harris et al. (2006) Harris, W. E., Whitmore, B. C., Karakla, D., Okoń, W., Baum, W. A., Hanes, D. A., & Kavelaars, J. J. 2006, ApJ, 636, 90
- Harris (2009a) Harris, W. E. 2009a, ApJ, 699, 254
- Harris (2009b) Harris, W. E. 2009b, ApJ, 703, 939
- Harris (2010) Harris, W. E. 2010, arXiv:1012.3224
- Hau et al. (2009) Hau, G. K. T., Spitler, L. R., Forbes, D. A., Proctor, R. N., Strader, J., Mendel, J. T., Brodie, J. P., & Harris, W. E. 2009, MNRAS, 394, L97
- Hilker et al. (1999) Hilker, M., Infante, L., Vieira, G., Kissler-Patig, M., & Richtler, T. 1999, A&AS, 134, 75
- Hilker (2009) Hilker, M. 2009, in Globular Clusters - Guides to Galaxies, 51
- Hopkins et al. (2010) Hopkins, P. F., Murray, N., Quataert, E., & Thompson, T. A. 2010, MNRAS, 401, L19
- Huchra & Brodie (1984) Huchra, J., & Brodie, J. 1984, ApJ, 280, 547
- Huchra & Brodie (1987) Huchra, J., & Brodie, J. 1987, AJ, 93, 779
- Hurley & Mackey (2010) Hurley, J. R., & Mackey, A. D. 2010, MNRAS, 408, 2353
- Huxor et al. (2005) Huxor, A. P., Tanvir, N. R., Irwin, M. J., Ibata, R., Collett, J. L., Ferguson, A. M. N., Bridges, T., & Lewis, G. F. 2005, MNRAS, 360, 1007
- Huxor et al. (2008) Huxor, A. P., Tanvir, N. R., Ferguson, A. M. N., Irwin, M. J., Ibata, R., Bridges, T., & Lewis, G. F. 2008, MNRAS, 385, 1989
- Huxor et al. (2009) Huxor, A., Ferguson, A. M. N., Barker, M. K., Tanvir, N. R., Irwin, M. J., Chapman, S. C., Ibata, R., & Lewis, G. 2009, ApJ, 698, L77
- Huxor et al. (2011a) Huxor, A. P., et al. 2011a, MNRAS, 414, 770
- Huxor et al. (2011b) Huxor, A. P., Phillipps, S., Price, J., & Harniman, R. 2011b, MNRAS, 414, 3557
- Hwang & Lee (2006) Hwang, N., & Lee, M. G. 2006, ApJ, 638, L79
- Hwang & Lee (2008) Hwang, N., & Lee, M. G. 2008, AJ, 135, 1567
- Hwang et al. (2011) Hwang, N., Lee, M. G., Lee, J. C., et al. 2011, ApJ, 738, 58
- Johnston et al. (2008) Johnston, K. V., Bullock, J. S., Sharma, S., Font, A., Robertson, B. E., & Leitner, S. N. 2008, ApJ, 689, 936
- Jones et al. (2006) Jones, J. B., et al. 2006, AJ, 131, 312
- Jordán et al. (2005) Jordán, A., et al. 2005, ApJ, 634, 1002
- Jordán et al. (2009) Jordán, A., et al. 2009, ApJS, 180, 54
- Kissler-Patig et al. (2006) Kissler-Patig, M., Jordán, A., & Bastian, N. 2006, A&A, 448, 1031
- Kroupa (1998) Kroupa, P. 1998, MNRAS, 300, 200
- Küpper et al. (2008) Küpper, A. H. W., Kroupa, P., & Baumgardt, H. 2008, MNRAS, 389, 889
- Larsen (1999) Larsen, S. S. 1999, A&AS, 139, 393
- Larsen & Brodie (2000) Larsen, S. S., & Brodie, J. P. 2000, AJ, 120, 2938
- Larsen & Brodie (2002) Larsen, S. S., & Brodie, J. P. 2002, AJ, 123, 1488
- Larsen & Brodie (2003) Larsen, S. S., & Brodie, J. P. 2003, ApJ, 593, 340
- Lotz et al. (2004) Lotz, J. M., Miller, B. W., & Ferguson, H. C. 2004, ApJ, 613, 262
- Mackey & van den Bergh (2005) Mackey, A. D., & van den Bergh, S. 2005, MNRAS, 360, 631
- Mackey et al. (2006) Mackey, A. D., et al. 2006, ApJ, 653, L105
- Madrid et al. (2009) Madrid, J. P., Harris, W. E., Blakeslee, J. P., & Gómez, M. 2009, ApJ, 705, 237
- Madrid et al. (2010) Madrid, J. P., et al. 2010, ApJ, 722, 1707
- Madrid (2011) Madrid, J. P. 2011, ApJ, 737, L13
- Maraston et al. (2004) Maraston, C., Bastian, N., Saglia, R. P., et al. 2004, A&A, 416, 467
- Martin et al. (2008) Martin, N. F., de Jong, J. T. A., & Rix, H.-W. 2008, ApJ, 684, 1075
- Martini & Ho (2004) Martini, P., & Ho, L. C. 2004, ApJ, 610, 233
- Masters et al. (2010) Masters, K. L., et al. 2010, ApJ, 715, 1419
- McLaughlin (2000) McLaughlin, D. E. 2000, ApJ, 539, 618
- Mieske et al. (2006a) Mieske, S., Hilker, M., Infante, L., & Jordán, A. 2006a, AJ, 131, 2442
- Mieske et al. (2006b) Mieske, S., et al. 2006b, ApJ, 653, 193
- Mieske et al. (2007) Mieske, S., Hilker, M., Jordán, A., Infante, L., & Kissler-Patig, M. 2007, A&A, 472, 111
- Mieske et al. (2008) Mieske, S., et al. 2008, A&A, 487, 921
- Misgeld et al. (2011) Misgeld, I., Mieske, S., Hilker, M., Richtler, T., Georgiev, I. Y., & Schuberth, Y. 2011, A&A, 531, A4
- Misgeld & Hilker (2011) Misgeld, I., & Hilker, M. 2011, MNRAS, 414, 3699
- Mouhcine et al. (2010) Mouhcine, M., Harris, W. E., Ibata, R., & Rejkuba, M. 2010, MNRAS, 404, 1157
- Mould et al. (1987) Mould, J. R., Oke, J. B., & Nemec, J. M. 1987, AJ, 93, 53
- Murray (2009) Murray, N. 2009, ApJ, 691, 946
- Norris & Kannappan (2011) Norris, M. A., & Kannappan, S. J. 2011, MNRAS, 414, 739
- Oser et al. (2010) Oser, L., Ostriker, J. P., Naab, T., Johansson, P. H., & Burkert, A. 2010, ApJ, 725, 2312
- Paolillo et al. (2011) Paolillo, M., Puzia, T. H., Goudfrooij, P., et al. 2011, ApJ, 736, 90
- Paudel et al. (2010) Paudel, S., Lisker, T., & Janz, J. 2010, ApJ, 724, L64
- Paudel et al. (2011) Paudel, S., Lisker, T., & Kuntschner, H. 2011, MNRAS, 413, 1764
- Peng et al. (2006) Peng, E. W., et al. 2006, ApJ, 639, 838
- Pfalzner (2009) Pfalzner, S. 2009, A&A, 498, L37
- Phillipps et al. (2001) Phillipps, S., Drinkwater, M. J., Gregg, M. D., & Jones, J. B. 2001, ApJ, 560, 201
- Pritzl et al. (2005) Pritzl, B. J., Venn, K. A., & Irwin, M. 2005, AJ, 130, 2140
- Rejkuba et al. (2007) Rejkuba, M., Dubath, P., Minniti, D., & Meylan, G. 2007, A&A, 469, 147
- Richardson & Green (1997) Richardson, S., & Green, P. 1997, J. R. Statistical Soc. B, 59, 731
- Richtler et al. (2005) Richtler, T., Dirsch, B., Larsen, S., Hilker, M., & Infante, L. 2005, A&A, 439, 533
- Richtler (2006) Richtler, T. 2006, Bulletin of the Astronomical Society of India, 34, 83
- Romanowsky et al. (2009) Romanowsky, A. J., Strader, J., Spitler, L. R., Johnson, R., Brodie, J. P., Forbes, D. A., & Ponman, T. 2009, AJ, 137, 4956
- Scheepmaker et al. (2007) Scheepmaker, R. A., Haas, M. R., Gieles, M., Bastian, N., Larsen, S. S., & Lamers, H. J. G. L. M. 2007, A&A, 469, 925
- Schuberth et al. (2010) Schuberth, Y., Richtler, T., Hilker, M., Dirsch, B., Bassino, L. P., Romanowsky, A. J., & Infante, L. 2010, A&A, 513, A52
- Sharina et al. (2005) Sharina, M. E., Puzia, T. H., & Makarov, D. I. 2005, A&A, 442, 85
- Sinnott et al. (2010) Sinnott, B., Hou, A., Anderson, R., Harris, W. E., & Woodley, K. A. 2010, AJ, 140, 2101
- Smith Castelli et al. (2008) Smith Castelli, A. V., Faifer, F. R., Richtler, T., & Bassino, L. P. 2008, MNRAS, 391, 685
- Spitler et al. (2006) Spitler, L. R., Larsen, S. S., Strader, J., Brodie, J. P., Forbes, D. A., & Beasley, M. A. 2006, AJ, 132, 1593
- Stonkutė et al. (2008) Stonkutė, R., et al. 2008, AJ, 135, 1482
- Strader et al. (2006) Strader, J., Brodie, J. P., Spitler, L., & Beasley, M. A. 2006, AJ, 132, 2333
- Strader & Smith (2008) Strader, J., & Smith, G. H. 2008, AJ, 136, 1828
- Strader et al. (2011) Strader, J., et al. 2011, ApJS, submitted (S+11)
- Taylor et al. (2010) Taylor, M. A., Puzia, T. H., Harris, G. L., Harris, W. E., Kissler-Patig, M., & Hilker, M. 2010, ApJ, 712, 1191
- Thomas et al. (2008) Thomas, P. A., Drinkwater, M. J., & Evstigneeva, E. 2008, MNRAS, 389, 102
- Tollerud et al. (2011) Tollerud, E. J., Bullock, J. S., Graves, G. J., & Wolf, J. 2011, ApJ, 726, 108
- Tolstoy et al. (2009) Tolstoy, E., Hill, V., & Tosi, M. 2009, ARA&A, 47, 371
- Trentham & Tully (2002) Trentham, N., & Tully, R. B. 2002, MNRAS, 335, 712
- van den Bergh et al. (1991) van den Bergh, S., Morbey, C., & Pazder, J. 1991, ApJ, 375, 594
- van den Bergh (1995) van den Bergh, S. 1995, AJ, 110, 1171
- van den Bergh & Mackey (2004) van den Bergh, S., & Mackey, A. D. 2004, MNRAS, 354, 713
- van den Bergh (2008) van den Bergh, S. 2008, MNRAS, 390, L51
- Wehner & Harris (2007) Wehner, E. M. H., & Harris, W. E. 2007, ApJ, 668, L35
- Woodley et al. (2010a) Woodley, K. A., Harris, W. E., Puzia, T. H., Gómez, M., Harris, G. L. H., & Geisler, D. 2010a, ApJ, 708, 1335
- Woodley et al. (2010b) Woodley, K. A., Gómez, M., Harris, W. E., Geisler, D., & Harris, G. L. H. 2010b, AJ, 139, 1871
- Woodley & Gómez (2010) Woodley, K. A., & Gómez, M. 2010, PASA, 27, 379
- Zolotov et al. (2009) Zolotov, A., Willman, B., Brooks, A. M., Governato, F., Brook, C. B., Hogg, D. W., Quinn, T., & Stinson, G. 2009, ApJ, 702, 1058
Appendix A A. Extended database of sizes and luminosities
Here we present a new dataset of sizes and luminosities for stellar systems of a broad range of types in the nearby Universe, from tiny star clusters and dwarf galaxies, to giant elliptical galaxies. Many of the datasets assembled in recent years have been oriented around the inclusion of velocity dispersion estimates (e.g., Mieske et al. 2008; Tollerud et al. 2011, but focusing on the simple parameters of size and luminosity permits the assembly of a larger sample that also includes many fainter objects. Such a database was published by Misgeld & Hilker (2011), and serves as one of our major sources of data. We update it as described below, both by incorporating additional data and by excluding objects with uncertain properties.
Because of our interest in rare objects with unusual properties, it is important to include only data with well-constrained measurements. The basic parameters are the -band absolute magnitude , and the half-light radius in physical units, which means that an object’s distance must be fairly well established. Otherwise, a fuzzy object that appears compact on the sky might be a relatively nearby GC or a dwarf galaxy, or alternatively a more distant giant galaxy. In many cases, distances are established via spectroscopic redshifts, while the most nearby objects may be recognized because they can be resolved, at least partially, into individual stars.
A related concern is to avoid objects with large, and potentially uncertain, degrees of reddening from dust obscuration. This applies to the Milky Way and to M31, where we include only those objects with inferred extinction values of mag. Where possible, we also restrict our sample to those objects with overall ages of 5 Gyr in order to minimize the scatter in luminosity that can result from stellar mass-to-light ratio variations. This means omitting spiral galaxies and interesting extended objects like Hodge 4 and W3, while we also exclude sub-components of galaxies like bulges and nuclei.
We begin with the M87 GCs and UCDs presented here and in Strader et al. (2011), and add in objects culled from the literature that meet our criteria. Two of our largest sources of data are the catalog of Milky Way GCs from Harris (2010), and the compilation of galaxies and star clusters from Misgeld & Hilker (2011). The other sources are listed in the Table notes; in some cases these are not the original sources for the measurements, but provide compilations of previous data from the literature.
In general, we have not attempted to correct for variations in distance scales between different studies. Many of the objects did not have -band magnitudes reported, and we have had to estimate these through approximate color transformations. For one dataset (Geha et al., 2003), we converted the tabulated semi-major axis effective radii to circularized half-light radii based on the ellipticities; the dSph catalog of Brasseur et al. (2011) ought to be corrected in the same way, but we do not have the ellipticities available.
In order to avoid biasing the categorization of these objects (as star clusters, dwarf galaxies, etc.), we have not added any such classifiers, but only applied some suggestive labels to broad areas of parameter space in Figure 8. Very roughly, using preliminary classifications as discussed in this paper, the extended database of 970 objects includes 400 GCs, 100 ECs, 50 intermediate objects, 100 UCDs, 50 dSphs, 100 dEs and cEs, and 100 gEs.
The datatable is also available on the SAGES webpage: http://sages.ucolick.org/spectral_database.html .
| ID | Host / Environment | Reference | ||
|---|---|---|---|---|
| [pc] | ||||
| Segue III | Milky Way | 0.06 | 0.342 | F+11c |
| SDSS J1058+2843 | Milky Way | 0.2 | 1.342 | M+08 |
| Koposov 2 | Milky Way | 0.61 | 0.324 | H10 |
| Segue I | Milky Way | 1.5 | 1.462 | MH11 |
| AM 4 | Milky Way | 1.97 | 0.603 | H10 |
| Segue II | Milky Way | 2.5 | 1.531 | MH11 |
| Whiting 1 | Milky Way | 2.56 | 0.285 | H10 |
| Boötes II | Milky Way | 2.7 | 1.708 | MH11 |
| Willman I | Milky Way | 2.7 | 1.398 | MH11 |
| Pal 1 | Milky Way | 3.01 | 0.169 | H10 |
| Pal 4 | Milky Way | 3.14 | 1.207 | H10 |
| M33-D | M33 | 3.79 | 0.681 | C+11a |
| Pal 13 | Milky Way | 3.92 | 0.434 | H10 |
| BH24 | M31 | 4.01 | 0.379 | B+07 |
| Coma Berenices | Milky Way | 4.1 | 1.886 | MH11 |
| Ursa Major II | Milky Way | 4.2 | 2.146 | MH11 |
| Koposov 1 | Milky Way | 4.28 | 0.562 | H10 |
| ESO121-SC03 | LMC | 4.37 | 1.000 | VM04 |
| HEC13 | M31 | 4.4 | 1.431 | H+11a |
| HEC3 | M31 | 4.5 | 1.322 | H+11a |
| Pal 12 | Milky Way | 4.53 | 0.978 | H10 |
| AM 1 | Milky Way | 4.73 | 1.167 | H10 |
| BH11 | M31 | 4.82 | 0.341 | B+07 |
| Canes Venatici II | Milky Way | 4.9 | 1.869 | MH11 |
| Pal 14 | Milky Way | 4.93 | 1.432 | H10 |
| BH04 | M31 | 4.99 | 0.477 | B+07 |
| Pisces II | Milky Way | 5.0 | 1.778 | MH11 |
| BH29 | M31 | 5.03 | 0.518 | B+07 |
| M33-E | M33 | 5.09 | 0.716 | C+11a |
| ESO-SC06 | Milky Way | 5.10 | 0.814 | H10 |
| HEC8 | M31 | 5.1 | 1.342 | H+11a |
| Eridanus | Milky Way | 5.19 | 1.080 | H10 |
| GC0606 | NGC 5128 | 5.2 | 1.230 | M+10 |
| Leo V | Milky Way | 5.2 | 2.124 | MH11 |
| Reticulum | LMC | 5.22 | 1.286 | VM04 |
| NGC 6822 C3 | NGC 6822 | 5.22 | 0.875 | H+11b |
| Terzan 7 | Milky Way | 5.24 | 0.707 | H10 |
| Pal 5 | Milky Way | 5.27 | 1.264 | H10 |
| HEC2 | M31 | 5.3 | 1.230 | H+11a |
| DAO38 | M31 | 5.43 | 0.399 | B+07 |
| Fornax 1 | Fornax | 5.44 | 1.094 | MH11 |
| Terzan 8 | Milky Way | 5.46 | 0.858 | H10 |
| Ursa Major I | Milky Way | 5.5 | 2.502 | MH11 |
| HEC6 | M31 | 5.5 | 1.380 | H+11a |
| M091 | M31 | 5.54 | 0.550 | B+07 |
| Arp 2 | Milky Way | 5.61 | 1.165 | H10 |
| Leo IV | Milky Way | 5.8 | 2.314 | MH11 |
| NGC 7492 | Milky Way | 5.81 | 0.944 | H10 |
| Pal 3 | Milky Way | 5.82 | 1.241 | H10 |
| B333 | M31 | 5.84 | 0.467 | B+07 |
| B056D | M31 | 5.89 | 0.337 | B+07 |
| M33-A | M33 | 5.89 | 1.308 | C+11a |
| HEC9 | M31 | 6.0 | 1.380 | H+11a |
| HEC1 | M31 | 6.0 | 1.380 | H+11a |
| NGC 6822 C4 | NGC 6822 | 6.06 | 1.140 | H+11b |
| NGC 6822 C2 | NGC 6822 | 6.10 | 1.061 | H+11b |
| B279 | M31 | 6.13 | 0.328 | B+07 |
| M33-S | M33 | 6.19 | 1.223 | C+11a |
| … |
Note. — Only a portion of this table is provided for the sake of illustration. The full table will be provided with the published paper and at: http://sages.ucolick.org/spectral_database.html . The data table is arranged in ascending order by luminosity. All magnitudes are extinction corrected. In many cases the precision of the size or magnitude measurements is higher than the actual measurement uncertainties, but the additional significant figures are kept in order to avoid discreteness effects in the plots. The reference abbreviations are as follows: B+07: Barmby et al. (2007); B+11: Brasseur et al. (2011); BL02: Brodie & Larsen (2002); C+09: Chilingarian et al. (2009); C+11a: Cockcroft et al. (2011); C+11b: Chiboucas et al. (2011); D+09: Da Costa et al. (2009); F+11a: Forbes et al. (2011); F+11b: Foster et al. (2011); F+11c: Fadely et al. (2011); G+03: Geha et al. (2003); H+05: Haşegan et al. (2005); H07: Haşegan (2007); H+09: Hau et al. (2009); H10: Harris (2010); H+11a: Huxor et al. (2011a); H+11b: Hwang et al. (2011); LB00: Larsen & Brodie (2000); M+07: Mieske et al. (2007); M+08: Martin et al. (2008); M+10: Mouhcine et al. (2010); M+11: Misgeld et al. (2011); MH04: Martini & Ho (2004); MH11: Misgeld & Hilker (2011); NK11: Norris & Kannappan (2011); R+05: Richtler et al. (2005); R+07: Rejkuba et al. (2007); R+09: Romanowsky et al. (2009); S+08: Smith Castelli et al. (2008); S+11: Strader et al. (2011); VM04: van den Bergh & Mackey (2004).