CID: Chemistry in disks
VI.sulfur-bearing molecules in the protoplanetary disks surrounding LkCa15, MWC480, DM Tau, and GO Tau
††thanks: Based on observations carried out with the IRAM
30m radiotelescope.
IRAM is supported by INSU/CNRS (France), MPG (Germany), and IGN
(Spain).
Abstract
Aims. We study the content in S-bearing molecules of protoplanetary disks around low-mass stars.
Methods. We used the new IRAM 30-m receiver EMIR to perform simultaneous observations of the line of H2S at 168.8 GHz and line of SO at 99.3 GHz. We compared the observational results with predictions coming from the astrochemical code NAUTILUS, which has been adapted to protoplanetary disks. The data were analyzed together with existing CS J=3-2 observations.
Results. We fail to detect the SO and H2S lines, although CS is detected in LkCa15, DM Tau, and GO Tau but not in MWC 480. However, our new upper limits are significantly better than previous ones and allow us to put some interesting constraints on the sulfur chemistry.
Conclusions. Our best modeling of disks is obtained for a C/O ratio of 1.2, starting from initial cloud conditions of H density of cm-3 and age of yr. The results agree with the CS data and are compatible with the SO upper limits, but fail to reproduce the H2S upper limits. The predicted H2S column densities are too high by at least one order of magnitude. H2S may remain locked onto grain surfaces and react with other species, thereby preventing the desorption of H2S.
Key Words.:
Stars: circumstellar matter – planetary systems: protoplanetary disks – individual: MWC480, LkCa15, DM Tau – Submillimeter:planetary systems1 Introduction
Understanding the evolution of gas and dust accretion disks around young stars is one of the prerequisites for handling the processes leading to planet formation. The temperature structure of disks is roughly understood (Chiang & Goldreich, 1997; Men’shchikov & Henning, 1997; D’Alessio et al., 1999), but very fundamental disk properties, such as the ionization degree and the dust and gas mass distribution, are poorly constrained. As no direct tracer exists, the derivation of the gas mass distribution requires in-depth knowledge of the disk structure and chemistry. Therefore, studying the chemistry becomes a necessary step, because molecular abundances and gas distribution are strongly coupled in both the modeling and analysis of observational data.
Vertically, the current paradigm of the chemistry of protoplanetary disks is a layered model (see for example van Zadelhoff et al., 2001). In the upper layer, the large incident UV flux from the central object results in a photodissociation-dominated layer (PDR) with a chemistry in equilibrium. The PDR size evolves with grain growth, since UV flux can penetrate deeper into the disk (Aikawa & Nomura, 2006; Chapillon et al., 2008; Vasyunin et al., 2011). Below the PDR, the molecules are expected to concentrate in a warm molecular layer. All chemical models published so far have produced similar results (Aikawa & Nomura, 2006; Semenov et al., 2005). Finally, because of the large extinction, the outer disk midplane is cold ( 10 K) and molecules are expected to stick onto dust grains. The chemistry is then rather similar to what is encountered in cold dense cores. Radially the “snowline”, which is defined by the radius where H2O molecules start to evaporate from the ice mantle of dust grains, delineates the zone where rocky planets can be formed. For a TTauri star similar to the young Sun, the “snowline” at midplane should typically be located around AU.
The ideal scenario presented above is loosely constrained. There are already several observational facts that reveal deficits in current chemical models for the outer disk that contains the reservoir of gas and dust mass ( R AU). Very recently, sensitive observations with Herschel/HIFI have revealed that the emission of H2O is significantly weaker than predicted (Bergin et al., 2010). Another example is given by our mm observations, which show “cold” molecules (at temperature lower than 10 K) such as CO (Dartois et al., 2003; Piétu et al., 2007), C2H (Henning et al., 2010), or CN and HCN (Chapillon et al., 2011). In the last cases, the disk density exceeds the critical density of the observed transitions and subthermal excitation cannot be invoked (Pavlyuchenkov et al., 2007). The usual explanation given is the role of turbulence. In theory, the vertical and radial mixing in the disk should allow a partial replenishment of the cold midplane layer (Semenov et al., 2006). However, this does not appear to be sufficient by itself (Hersant et al., 2009). The turbulent mixing efficiency actually depends on the photodesorption rates (Hersant et al., 2009) which may be much higher than originally thought (Öberg et al., 2009).
For inner disks, where planets should form ( R AU), some very interesting unresolved observations (mostly coming from the Spitzer satellite) begin to unveil the chemical content of planet-forming regions. These observations show that not only CO but also many other molecules such as H2O, HCN, CO2, C2H2, OH, etc…are present in inner disks (Carr & Najita, 2008). So far, there has been no H2S detection. Interestingly, a recent paper from Glassgold et al. (2009) suggests that there is no need for transport in the inner nebula to explain the presence of water vapor at the surface of the very inner disk. The disk irradiation by UV and X-rays may be sufficient to create water “in situ”, in the warm disk atmosphere. This model accounts roughly for the IR water vapor emission observed in TTauri disks by Carr & Najita (2008) and Salyk et al. (2008) without radial or vertical mixing in disks.
Recent models of solar nebula investigating the sulfur chemistry (Pasek et al., 2005) within the 20 central AU found that the main gas component of sulfur-bearing molecules would be H2S, while it should be in the form of FeS, MgS, or CaS in solid state (meteorites). The abundance of those species are expected to be variable with respect to the time evolution of the snowline and the water vapor content. Moreover, sulfur-bearing molecules such as H2S and CS (and SO to a lesser extent) are relatively abundant in comets. For example, in Hale-Bopp, the abundance of H2S is 10% that of CO. H2S is supposed to come from the evaporation of ices, while CS and SO are the daughters of CS2 and SO2, respectively (Bockelée-Morvan et al., 2004). Nonetheless, the only S-bearing molecule that is firmly detected in cold outer TTauri disks is CS.
Several transitions of CS, the most abundant S-bearing species in cold molecular cores (Dickens et al., 2000), were detected by Dutrey et al. (1997), who found an abundance (), about 30 times lower than in TMC1. Such a difference is not surprising since the gas and dust have evolved inside the disk compared to dense cores.
In this paper, we go one step further by studying other S-bearing molecules using the IRAM 30-m radiotelescope. The observations and results are described in S.2, the chemical modeling is presented in S.3, and we discuss in S.4 the implications of our non detections before we conclude in S.5.
2 Observations and results
| Source | Right Ascension | Declination | Spect.Type | Effective Temp. | Stellar Lum. | Stellar Mass | Age | UV flux |
|---|---|---|---|---|---|---|---|---|
| (o,,), (J2000.0) | (h,m,s) (J2000.0) | (K) | () | () | (Myr) | () | ||
| LkCa 15 | 04:39:17.78 | 22:21:03.34 | K5 | 4350 | 0.74 | 3-5 | 2550 | |
| DM Tau | 04:33:48.73 | 18:10:09.89 | M1 | 3720 | 0.25 | 5 | 410 | |
| MWC 480 | 04:58:46.26 | 29:50:36.87 | A4 | 8460 | 11.5 | 7 | 8500 | |
| GO Tau | 04:43:03.05 | 25:20:18.8 | M0 | 3850 | 0.37 | 0.5 | 3 | 410 |
2.1 Sample and observations
Many molecular lines have been observed around MWC 480, LkCa15, and DM Tau (Dutrey et al., 1997), and the disk structures are well known (Piétu et al., 2007). DM Tau and LkCa15 are TTauri stars of 0.5 and 1.0 , respectively, while MWC480 is an Herbig Ae star of 1.8 . The CO disk of GO Tau is reported in Schaefer et al. (2009). It appears to be a good candidate for a deep search of chemistry since it exhibits a large disk (CO outer radius R AU) that is very similar to that of DM Tau. Table 1 summarizes the stellar properties of the four stars.
The observations were performed using the new 30-m heterodyne receivers (EMIR) mid-May 2010 under good weather conditions. We used the wobbler switch mode with offsets of 60′′ since the sources are unresolved in the telescope beam, providing spatially integrated spectra. We observed the H2S line at 168.763 GHz simultaneously with the SO line at 99.299 GHz using the correlator VESPA with a spectral resolution of 20 KHz. Venus was regularly checked for pointing and focus corrections. The forward efficiency was set to 0.95 and 0.93 at 99 and 168 GHz, respectively. We used flux density conversion factors (Jy/T) of 6 Jy/K at 99 GHz and 6.5 Jy/K at 168 GHz. We took the values recommended by the IRAM staff (see http://www.iram.es/IRAMES/mainWiki/Iram30mEfficiencies).
The CS J=3-2 data of GO Tau were observed in 2009 at the IRAM 30-m radiotelescope using EMIR and reduced as described above. The CS J=3-2 data of MWC 480 and LkCa15 were obtained with the IRAM 30-m telescope in 2000 simultaneously with the DCO+ J=2-1 observations published in Guilloteau et al. (2006), using the same observational strategy as described in Dutrey et al. (1997). For DM Tau, CS J=3-2 was mapped with the IRAM array in the course of an imaging project (Guilloteau et al., 2011, in prep.) and we only present here the integrated spectrum (integrated over the CO outer radius).
All the 30-m data were reduced using CLASS. The DM Tau CS map was analyzed using CLIC and MAPPING and an integrated spectrum was produced.
2.2 Column density derivation and results
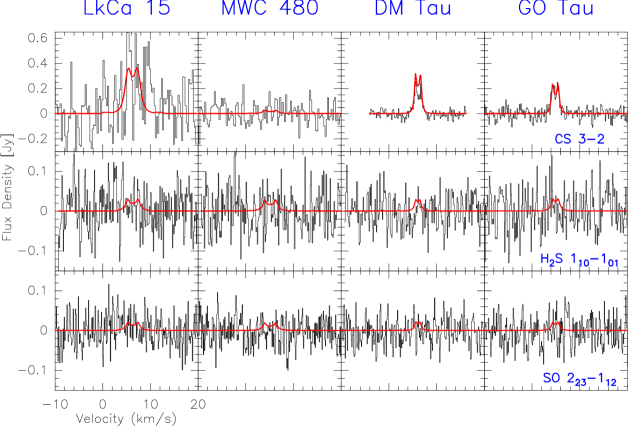
Figure 1 shows the integrated spectra obtained for all the sources. Neither H2S nor SO are detected but the observations provide for the first time meaningful upper limits, significantly better (by a factor ) than those quoted in Dutrey et al. (2000). CS J=3-2 is detected in three disks: GO Tau, LkCa15, and DM Tau, but not in MWC 480.
| Source | MWC 480 | LkCa 15 | DM Tau | GO Tau |
|---|---|---|---|---|
| inclination (o) | 38 | 52 | -32 | 51 |
| P.A.(o) | 57 | 150 | 65 | 112 |
| Vsyst(km.s-1) | 5.10 | 6.30 | 6.04 | 4.89 |
| V100(km.s-1) | 4.03 | 3.00 | 2.16 | 2.05 |
| (km.s-1) | 0.2 | 0.2 | 0.2 | 0.2 |
| T100(K) | 30 | 15 | 15 | 15 |
| Rint(AU) | 1 | 45 | 1 | 1 |
| Rout(AU) | 500 | 550 | 800 | 900 |
| CS Rout(AU) | - | - | 560 10 | - |
| CS | - | - | 0.750.05 | 1.00.2 |
Deriving proper estimates of upper limits is complicated in the case of Keplerian disks because of the existence of velocity, temperature, and density gradients (Guilloteau et al., 2006; Dutrey et al., 2007). For chemistry, since the surface density and the temperature have radial dependencies, defining an averaged column density over the whole disk implies to merge chemically different regions. This can only be properly done by taking the existing gradients into account. Because the characteristic size of the disks is several 100 AU, and is unresolved in the 30-m beam, our observations are most sensitive to the 200 - 400 AU range, depending on the radial distribution (see Piétu et al., 2007). We thus chose to proceed as follows. We used DISKFIT (a dedicated radiative transfer code to protoplanetary disks, see Piétu et al., 2007) to generate integrated spectra and derived the best model by adjusting disk parameters. The models provided by DISKFIT were compared to the observed spectra using the minimization routine described in Piétu et al. (2007). For the minimizations, all parameters were fixed except , the surface density at 300 AU. The adopted disk parameters are given in Table 2. Theses values come from the angularly resolved CO interferometric analysis performed by Piétu et al. (2007) and for GO Tau by Schaefer et al. (2009). The 3 upper limits on the surface densities at 300 AU were then calculated from the formal error obtained from the best fit. The results are given in Table 3. The choice of the CO parameters to fit sulfur-bearing molecules is governed by the fact that CO results provide the best constraints on the gas disk structure and kinetic temperature. Moreover, the temperature derived from CO data can be considered as representative of a significant fraction of the molecular layer so is well suited to determining upper limits on the surface density of molecular species. Two parameters may affect : the exponent slope and the outer radius Rout. itself is relatively unsensitive to these parameters, but the derived error-bars can be significantly affected. On one hand, for DM Tau, using instead of 1.5 decreases the error by a factor 4. On the other hand, further reducing Rout to 560 AU (the best fit value for CS in DM Tau) again increases the error by a factor 2. Thus our choice of values for Rout and is rather conservative in view of the unknowns.
| Sources | (cm-2) | ||
|---|---|---|---|
| SO | H2S | CS | |
| DM Tau | 7.51011 | 1.41011 | 3.5 0.1 1012 |
| LkCa15 | 1.91012 | 3.61011 | 8.7 1.6 1012 |
| MWC480 | 2.51012 | 4.11011 | 8.4 1011 |
| GO Tau | 8.9 1011 | 1.8 1011 | 2.0 0.16 1012 |
3 Chemical analysis and modeling
| Element | Abundance | Ref. | Case∗ |
|---|---|---|---|
| He | 0.09 | (1) | |
| N | 6.2(-5) | (2) | |
| C+ | 1.7(-4) | (2) | A,C |
| 1.2(-4) | (1) | B,D | |
| O | 1.4(-4) | (3) | A,C |
| 2.56(-4) | (1) | B,D | |
| S+ | 8(-8) | (4) | A,B |
| 8(-9) | C,D | ||
| Si+ | 8(-9) | (4) | |
| Na+ | 2(-9) | (4) | |
| Fe+ | 3(-9) | (4) | |
| Cl+ | 1(-9) | (4) | |
| Mg+ | 7(-9) | (4) | |
| P + | 2(-10) | (4) |
We used the NAUTILUS (Hersant et al., 2009) gas-grain model to study the sulfur chemistry in the four protoplanetary disks. NAUTILUS computes the abundance of 460 gas-phase and 195 surface species as a function of time using the rate equation method (Hasegawa et al., 1992). The chemical network contains 4406 gas-phase reactions and 1733 reactions involving grains (including adsorption and desorption processes and grain-surface reactions). The gas-phase network was updated according to the recommendations from the KIDA experts (http://kida.obs.u-bordeaux1.fr/, on November 2010). The full network can be found at http://kida.obs.u-bordeaux1.fr/models/benchmark_2010.dat. We used silicate grains of 0.1 m size. This small size agrees with the recent observational results from Guilloteau et al. (2011), which show that in outer disks (70-100 AU) dust grains are dominated by small particles (ISM-like). This agrees with the theoretical results of Birnstiel et al. (2010) and suggests that large grains have already migrated to the inner disk regions (70 AU). Since small grains of should remain dynamically coupled to the gas, this observational result also implies that the chemistry in the outer disk would be less affected by the dust settling than in the inner disk. For the ratio of extinction curve to the column density of hydrogen, we used the standard relation A following Wagenblast & Hartquist (1989). More details on the model can be found in Hersant et al. (2009) and Semenov et al. (2010). To obtain initial abundances for the chemistry of protoplanetary disks, we first compute the chemical composition of the parent molecular cloud. With this aim, we run NAUTILUS during yr for the following physical conditions: gas and dust temperature are 10 K, H density is cm-3 and AV is 50 (models A and B). We checked higher densities ( cm-3) and older clouds ( yr), corresponding to models C and D and also tested smaller AV (10). For the cloud, the species (listed in Table 4) are assumed to initially be in the atomic form except for hydrogen, which is entirely in H2, and we assumed four sets of elemental abundances. In models A and C, we adopted the oxygen elemental abundance required to reproduce the low O2 abundance observed in the cold ISM from Hincelin et al. (2011) and the carbon abundance from Jenkins (2009) for the Oph diffuse cloud, so that the C/O elemental ratio is 1.2. In models B and D, we use the carbon and oxygen elemental abundances from Wakelam & Herbst (2008, for C and for O), which gives a C/O ratio of 0.4. The choice of the sulfur elemental abundance “available” for the chemistry, i.e. not locked into the refractory part of the grains, is a widely studied problem (Ruffle et al., 1999; Wakelam et al., 2004; Scappini et al., 2003; van der Tak et al., 2003). No depletion of gas phase atomic sulfur is observed in diffuse clouds compared to the cosmic abundance of (/H), in contrast to other elements. However, if such high elemental abundance is used to do the chemistry in dense clouds, one would produce too many S-bearing molecules, on which we have observational constraints (Graedel et al., 1982b; Wakelam & Herbst, 2008). For this reason, depletion of sulfur in an unknown, more or less refractory form is assumed to happen very quickly when the molecular cloud is formed from the diffuse gas. To simulate this effect, the “free” elemental abundance of S is then decreased by an arbitrary amount. For simplicity, we have adopted the elemental abundance from Graedel et al. (1982b) in our Models A and B (which approximately reproduces the observations in dense clouds) and decreased it by a factor of 10 in models C and D. Table 5 also summarizes the parameters (cloud age, initial density, C/O ratio) for the four Models A, B, C, and D. We did numerous simulations to understand the effect of the parameters that we changed. In general, the S-bearing molecular abundances are not very sensitive to these parameters, and we present here the extreme cases.
| Parameter | Model A | Model B | Model C | Model D |
|---|---|---|---|---|
| C/O ratio | 1.2 | 0.4 | 1.2 | 0.4 |
| Sulfur abundance | ||||
| (/H) | ||||
| Cloud H density | ||||
| (H.cm-3) | ||||
| Cloud age | ||||
| (yrs) |
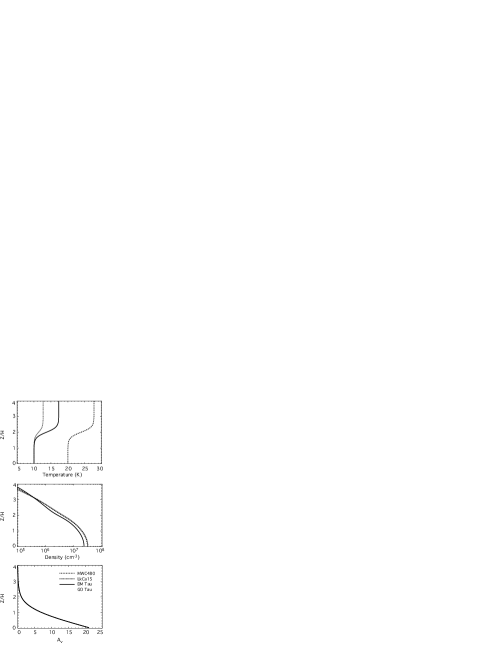
The abundances of chemical species in the gas and on the grains were used as initial composition for the chemistry of the disks, which is then integrated over yr, taken as the approximate age of the studied disks. The computed column densities do not vary significantly after yr. For the disk physical parameters, we used the two layer parametric disk model described in Hersant et al. (2009). Its temperature profile is based on Dartois et al. (2003). The dust temperature is equal to the gas temperature. The midplane is cold, with a temperature of K for DM Tau, GO Tau, and LkCa15 and K for MWC480, consistent with the temperature derived from the 13CO 1-0 transition. The molecular surface layer is warmer, as derived from 12CO 2-1 observations, with a temperature of K for DM Tau and GO Tau, K for LkCa15, and K for MWC480 at 300 AU. We assumed the same surface density for all four disks, with a value of g cm-2 at AU. The resulting disk structure is displayed Fig. 2 (see Hersant et al., 2009, for details about the computation of the physical structure). For the UV radiative transfer in the disk, we consider only the vertical extinction (assuming that only half of UV photons are scattered downwards by small grains located above our computing box). The UV flux given at 100 AU in Table 1 is decreasing as (where is the spherical radius) from the central star. At a cylindrical radius of AU and a vertical boundary of four pressure scale heights (), the UV scale factor becomes for GO Tau, for DM Tau, for LkCa15, and for MWC480, expressed in units of the InterStellar Radiation Field (ISRF, Draine, 1978).
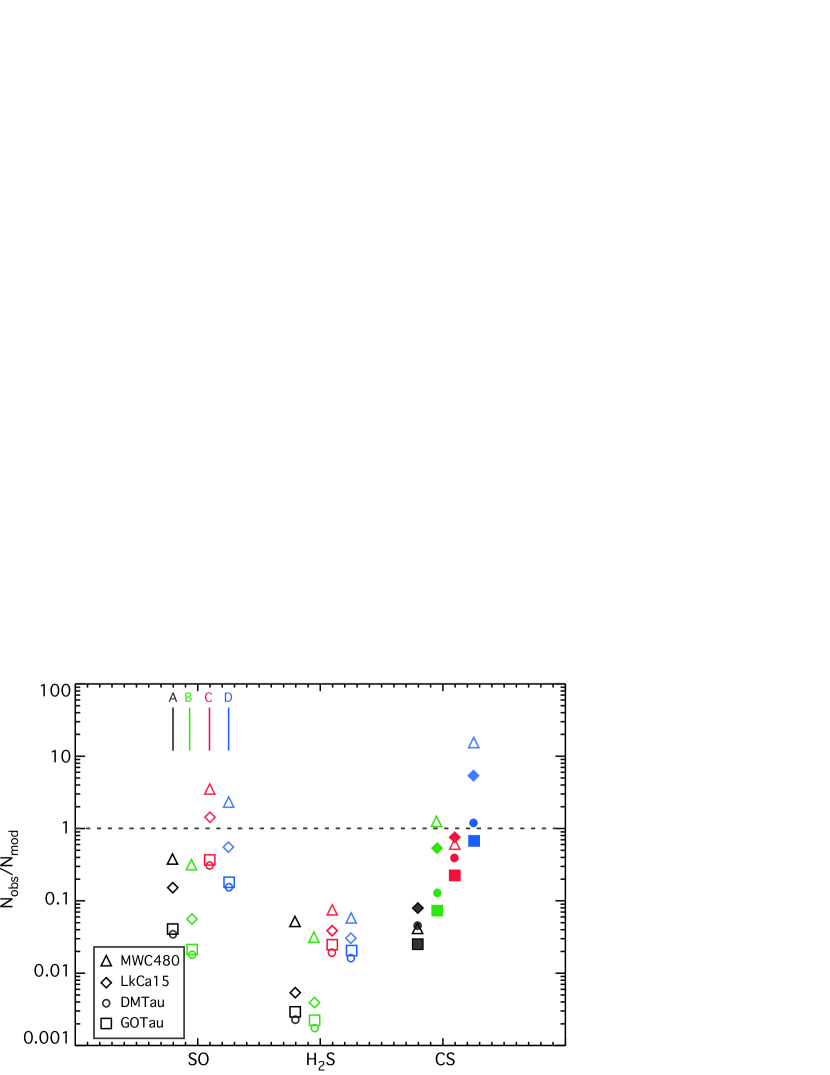
Using the chemical and physical parameters, we ran the four Models A,B,C and D in order to obtain the column densities of SO, H2S, and CS at 300 AU. The results for Models A and C are given in Table 5 and the comparison with the observations is shown in Fig. 3 where we present the ratio between predicted and observed column densities for the three molecules in the four sources for the four cases.
| Source | NSO | N | NCS |
|---|---|---|---|
| MWC 480 | 6.6 | 7.9 | 2.0 |
| LkCa15 | 1.3 | 6.8 | 1.1 |
| DM Tau a | 2.2 | 6.2 | 8.0 |
| MWC 480 | 7.1 | 5.5 | 1.4 |
| LkCa15 | 1.3 | 9.1 | 1.1 |
| DM Tau a | 2.4 | 7.3 | 8.9 |
4 Discussion
In Fig. 3, except for CS, we only have upper limits on the ratios. DM Tau and GO Tau have similar model parameters so that the chemical models predict similar results for the two disks. We chose yr as the approximate age of the studied disks.
Models A and B are not very sensitive to the density of the parent cloud and its age. The difference between H2S and CS column densities are small, except for MWC 480 with the largest UV flux. When the sulfur is less abundant by a factor of 10 (Models C and D), the results are slightly more sensitive to the density and age of the cloud.
In the case of Models C and D, corresponding to a cloud with an initial H density of cm-3 and an age of yr, the general agreement with the observations is better. The column densities for CS agree with the observed values, and the ones obtained for SO agree with the upper limits. The column density for H2S, in contrast, is still too high by at least one order of magnitude. This result seems to indicate some missing processes for the destruction of H2S on grains. H2S is not formed efficiently in the gas-phase (Herbst et al., 1989). The gas phase H2S, in these simulations, comes from the non-thermal evaporation of solid H2S formed on grains by the hydrogenation of atomic sulfur (depleted from the gas phase). Its main destruction path in the gas-phase is through the reaction with C+. At the high densities and relatively low temperatures encountered around disk midplanes (for H2S, the evaporation temperature is around 40-50 K, Wakelam et al. (2011)), H2S is likely to remain locked onto the grain surfaces and may react with other species preventing desorption of H2S. These grain surface reactions have not yet been incorporated in chemical models. In recent experimental studies, Garozzo et al. (2010) have shown that H2S on grains is easily destroyed by cosmic-ray particles, leading to the formation of C2S, SO2 and OCS on grains. In these experiments, most of the sulfur, however, may be in the form of a sulfur-rich residuum, which could be polymers of sulfur or amorphous aggregates of sulfur, as suggested by Wakelam et al. (2004).
We also checked the sensitivity to the C/O elemental ratio (C/O=1.2 for A and C and 0.4 for B and D). In Models B and D with C/O=0.4, we obtain an SO column density that is higher than the one of CS. The agreement with the observations is thus always less good than using the higher C/O value.
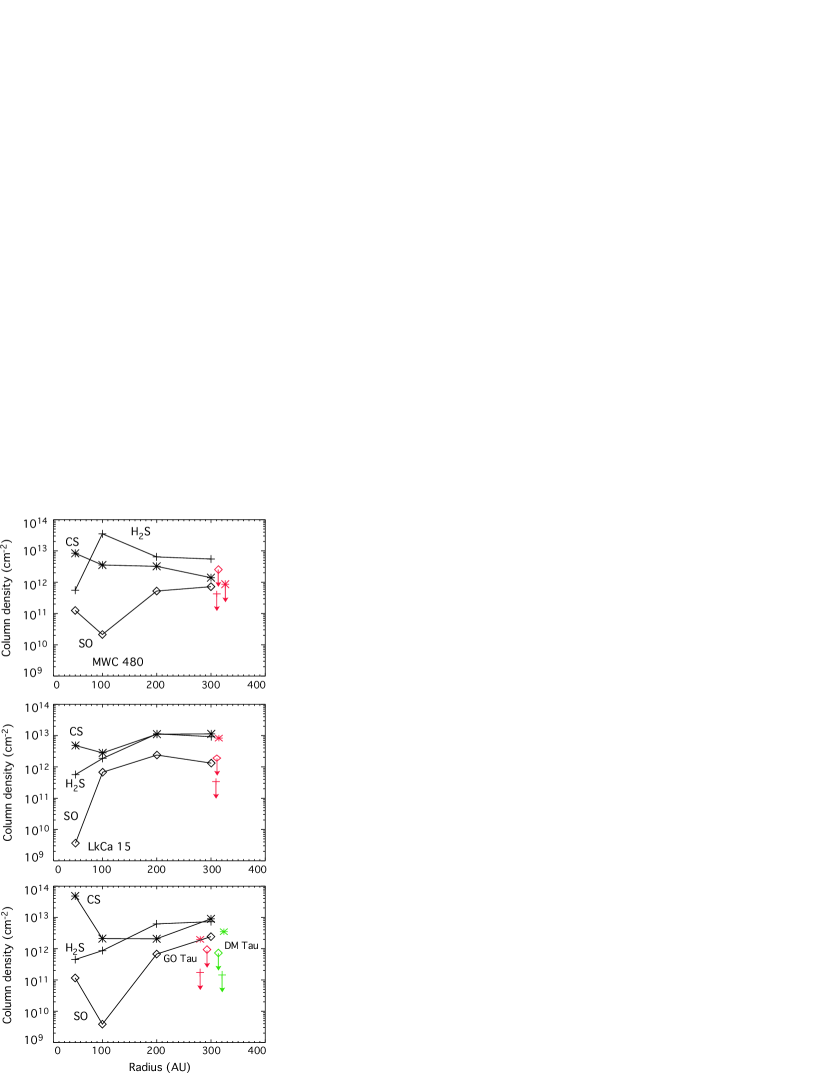
We have superimposed in Fig.4 the observed column densities on the predicted column densities for the three species in all sources for the Model C, which appears slightly better than the case of D. The column densities have been calculated at radii, 50, 100, 200, and 300 AU. The three modeled molecular column densities show the same radial trends in all sources with the exception of SO in MWC480 and DM Tau at 100 AU. The difference in the SO abundances in the three sources can be explained by a balance between formation and destruction efficiencies of this molecule. At this radius, SO is formed by the neutral-neutral reaction S + OH SO + H and OH is formed by the association radiation O + H OH + h. Water molecules are much less abundant than H or O. It is the association between O and H that quantitatively produces OH. In MWC480 and LkCa15, the abundances of atomic O and H are larger than in DM Tau because of larger UV fluxes, producing more SO. In MWC480, however, SO is more efficiently destroyed than in LkCa15 because of larger abundances of ionized atomic carbon lower in the disk atmosphere (C+ + SO CO+ + S).
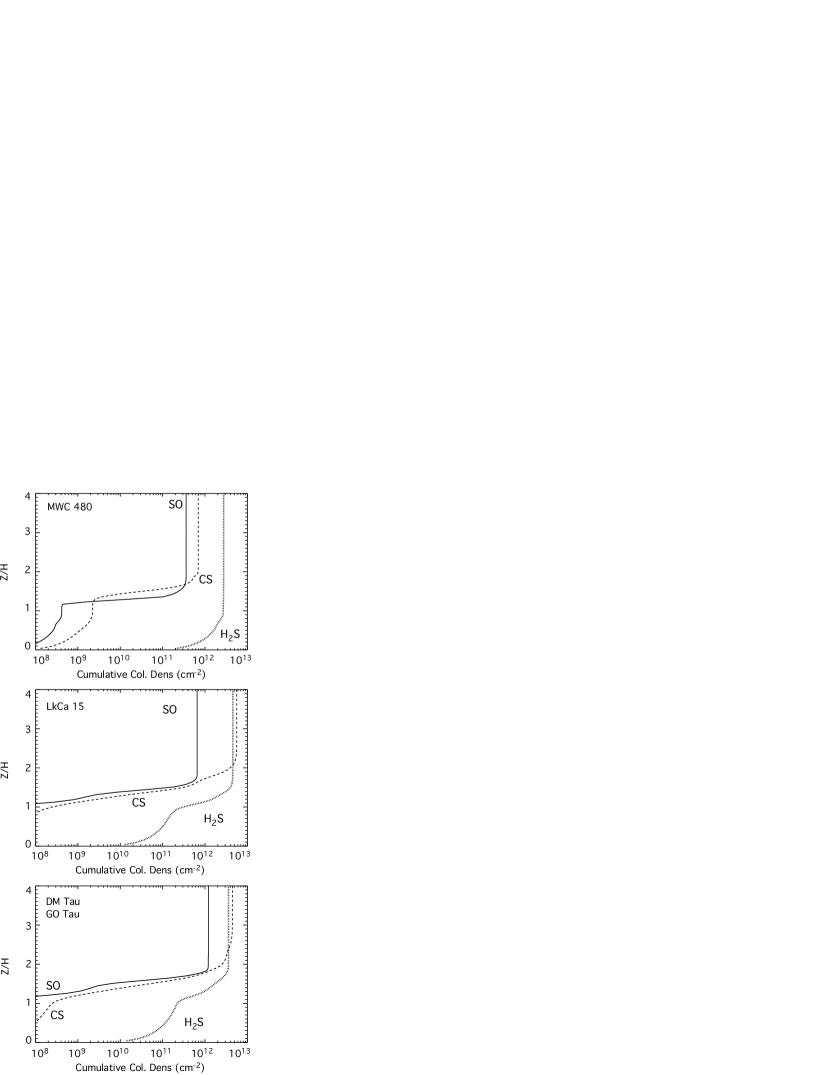
We present in Fig.5 the vertical surface density profiles at radius 300 AU for the sulfur-bearing molecules for the C model, but we observe the same trends with all models. We clearly see the location of the molecular layer at , but the sulfur-bearing molecule abundances saturate at different heights. The SO vertical profile is sharp and peaks at a of 1.7 in DM Tau and GO Tau, 1.6 in LkCa 15 and 1.1 in MWC 480. The H2S column densities saturate slightly below in DM Tau, GO Tau, and LkCa15. In MWC 480, the profile is less peaked and spreads over 1.5 scale heights above the midplane. CS abundance has a rather broad maximum around two scale heights in all sources, except MWC 480, where it peaks at with a narrow profile. The different behavior of MWC 480 can be understood because the UV flux is so high that all molecules dissociate above 1.7 – 2 scale heights, resulting in a narrower chemically rich layer and lower overall column densities.
The relative abundances may be compared to those found in comets like Hale-Bopp (Bockelée-Morvan et al., 2004). In the coma of comets, the molecules are removed from the grains by desorption. Some species, like H2S, are directly desorbed and most of them are short-lived because they are photodissociated to give daughter molecules. Both CS and SO are produced by photodissociation of SO2 and CS2 (Bockelée-Morvan et al., 2004). Therefore, the quantity of H2S observed in Hale-Bopp is a direct tracer of the amount of H2S remaining currently on cometary grains, while the CS and SO observations most likely trace the reservoir on grains of CS2 and SO2.
The ratios H2S/CO in Hale-Bopp and our disks are quoted in Table 6. For our disk observations, we use the measured surface densities of CO derived from the interferometric analysis of Piétu et al. (2007) (in fact 13CO multiplied by 70, to avoid possible opacity effects). Our results are obtained at 300 AU (the region to which we are most sensitive) and trace the gas phase, while the Hale-Bopp measurements trace the current molecular composition of the grain mantles probably formed around 5-30 AU in the protosolar nebula. The huge difference between observed gas ratio in the protoplanetary environment and the cometary ice ratio, at least a factor , suggests that grain surface chemistry on the comet may have actively modified the molecular content of the protoplanetary ice composition.
| Source | (cm-2) | H2S/CO |
|---|---|---|
| DM Tau | 3.7 | |
| LkCa15 | 1.8 | |
| MWC 480 | 2.3 | |
| Hale-Bopp | - | 0.07 |
5 Conclusions
We have reported a new deep search for sulfur-bearing molecules (SO, H2S, and CS) in three TTauri disks (DM Tau, GO Tau, and LkCa15) and one Herbig Ae object (MWC480). CS was detected in the three TTauri disks but not in the Herbig Ae one. H2S and SO were not detected, but the upper limits are significant and allow us to make comparisons with models. For this purpose, we used the astro-chemistry code NAUTILUS. We find that better agreement with the observations is obtained for an initial cloud H density of cm-3 and age of yr with a C/O of 1.2 (as recently suggested by Hincelin et al. (2011)).
Although it reproduces the SO and CS column densities reasonably well, our best model fails to reproduce the upper limits obtained on H2S by at least one order of magnitude, suggesting that a fraction of sulfur may be depleted in mantles or refractory grains. At the high densities and low temperatures encountered around disk midplanes, H2S may likely remain locked onto the grain surfaces, where it may react to form other species preventing desorption of H2S. These kinds of grain surface reactions have not yet been incorporated in models. Our results emphasize the need for grain surface reactions in astrochemical models in presence of the high density and low temperature associated to a UV photon source, as is the case in protoplanetary disks. More sensitive observations with ALMA, are needed to provide astrochemists with stronger constraints on the missing ingredients in disk chemical models.
Acknowledgements.
We acknowledge all the 30-m IRAM staff for their help during the observations. This research was partially supported by PCMI, the French national program for the Physics and Chemistry of the Interstellar Medium. We thank an anonymous referee who provided helpful comments to improve the paper. The KIDA team is also acknowledged for providing chemical reaction rates that are as accurate as possible for astrophysics.References
- Aikawa & Nomura (2006) Aikawa, Y. & Nomura, H. 2006, ApJ, 642, 1152
- Bergin et al. (2004) Bergin, E., Calvet, N., Sitko, M. L., et al. 2004, ApJ, 614, L133
- Bergin et al. (2010) Bergin, E. A., Hogerheijde, M. R., Brinch, C., et al. 2010, A&A, 521, L33+
- Birnstiel et al. (2010) Birnstiel, T., Dullemond, C. P., & Brauer, F. 2010, A&A, 513, A79+
- Bockelée-Morvan et al. (2004) Bockelée-Morvan, D., Crovisier, J., Mumma, M. J., & Weaver, H. A. 2004, The composition of cometary volatiles, ed. Festou, M. C., Keller, H. U., & Weaver, H. A., 391–423
- Carr & Najita (2008) Carr, J. S. & Najita, J. R. 2008, Science, 319, 1504
- Chapillon et al. (2011) Chapillon, E., et al., & . 2011, A&A
- Chapillon et al. (2008) Chapillon, E., Guilloteau, S., Dutrey, A., & Piétu, V. 2008, A&A, 488, 565
- Chiang & Goldreich (1997) Chiang, E. I. & Goldreich, P. 1997, ApJ, 490, 368
- D’Alessio et al. (1999) D’Alessio, P., Calvet, N., Hartmann, L., Lizano, S., & Cantó, J. 1999, ApJ, 527, 893
- Dartois et al. (2003) Dartois, E., Dutrey, A., & Guilloteau, S. 2003, A&A, 399, 773
- Dickens et al. (2000) Dickens, J. E., Irvine, W. M., Snell, R. L., et al. 2000, ApJ, 542, 870
- Draine (1978) Draine, B. T. 1978, ApJS, 36, 595
- Dutrey et al. (1997) Dutrey, A., Guilloteau, S., & Guelin, M. 1997, A&A, 317, L55
- Dutrey et al. (2000) Dutrey, A., Guilloteau, S., & Guélin, M. 2000, in IAU Symposium, Vol. 197, From Molecular Clouds to Planetary, ed. Y. C. Minh & E. F. van Dishoeck, 415–+
- Dutrey et al. (2007) Dutrey, A., Henning, T., Guilloteau, S., et al. 2007, A&A, 464, 615
- Garozzo et al. (2010) Garozzo, M., Fulvio, D., Kanuchova, Z., Palumbo, M. E., & Strazzulla, G. 2010, A&A, 509, A67+
- Glassgold et al. (2009) Glassgold, A. E., Meijerink, R., & Najita, J. R. 2009, ApJ, 701, 142
- Graedel et al. (1982a) Graedel, T. E., Langer, W. D., & Frerking, M. A. 1982a, ApJS, 48, 321
- Graedel et al. (1982b) Graedel, T. E., Langer, W. D., & Frerking, M. A. 1982b, ApJS, 48, 321
- Guilloteau et al. (2011) Guilloteau, S., Dutrey, A., Piétu, V., & Boehler, Y. 2011, ArXiv e-prints
- Guilloteau et al. (2006) Guilloteau, S., Piétu, V., Dutrey, A., & Guélin, M. 2006, A&A, 448, L5
- Hasegawa et al. (1992) Hasegawa, T. I., Herbst, E., & Leung, C. M. 1992, ApJS, 82, 167
- Henning et al. (2010) Henning, T., Semenov, D., Guilloteau, S., et al. 2010, ApJ, 714, 1511
- Herbst et al. (1989) Herbst, E., Defrees, D. J., & Koch, W. 1989, MNRAS, 237, 1057
- Hersant et al. (2009) Hersant, F., Wakelam, V., Dutrey, A., Guilloteau, S., & Herbst, E. 2009, A&A, 493, L49
- Hincelin et al. (2011) Hincelin, U., Wakelam, V., Hersant, F., et al. 2011, A&A, 530, A61+
- Jenkins (2009) Jenkins, E. B. 2009, ApJ, 700, 1299
- Kurucz (1993) Kurucz, R. 1993, ATLAS9 Stellar Atmosphere Programs and 2 km/s grid. Kurucz CD-ROM No. 13. Cambridge, Mass.: Smithsonian Astrophysical Observatory, 1993., 13
- Men’shchikov & Henning (1997) Men’shchikov, A. B. & Henning, T. 1997, A&A, 318, 879
- Öberg et al. (2009) Öberg, K. I., Linnartz, H., Visser, R., & van Dishoeck, E. F. 2009, ApJ, 693, 1209
- Pasek et al. (2005) Pasek, M. A., Milsom, J. A., Ciesla, F. J., et al. 2005, Icarus, 175, 1
- Pavlyuchenkov et al. (2007) Pavlyuchenkov, Y., Guilloteau, S., Henning, T., et al. 2007, in prep.
- Piétu et al. (2007) Piétu, V., Dutrey, A., & Guilloteau, S. 2007, A&A, 467, 163
- Piétu et al. (2006) Piétu, V., Dutrey, A., Guilloteau, S., Chapillon, E., & Pety, J. 2006, A&A, 460, L43
- Ruffle et al. (1999) Ruffle, D. P., Hartquist, T. W., Caselli, P., & Williams, D. A. 1999, MNRAS, 306, 691
- Salyk et al. (2008) Salyk, C., Pontoppidan, K. M., Blake, G. A., et al. 2008, ApJ, 676, L49
- Scappini et al. (2003) Scappini, F., Cecchi-Pestellini, C., Smith, H., Klemperer, W., & Dalgarno, A. 2003, MNRAS, 341, 657
- Schaefer et al. (2009) Schaefer, G. H., Dutrey, A., Guilloteau, S., Simon, M., & White, R. J. 2009, ApJ, 701, 698
- Semenov et al. (2010) Semenov, D., Hersant, F., Wakelam, V., et al. 2010, A&A, 522, A42+
- Semenov et al. (2005) Semenov, D., Pavlyuchenkov, Y., Schreyer, K., et al. 2005, ApJ, 621, 853
- Semenov et al. (2006) Semenov, D., Wiebe, D., & Henning, T. 2006, ApJ, 647, L57
- Simon et al. (2000) Simon, M., Dutrey, A., & Guilloteau, S. 2000, ApJ, 545, 1034
- van der Tak et al. (2003) van der Tak, F. F. S., Boonman, A. M. S., Braakman, R., & van Dishoeck, E. F. 2003, A&A, 412, 133
- van Zadelhoff et al. (2001) van Zadelhoff, G.-J., van Dishoeck, E. F., Thi, W.-F., & Blake, G. A. 2001, A&A, 377, 566
- Vasyunin et al. (2011) Vasyunin, A. I., Wiebe, D. S., Birnstiel, T., et al. 2011, ApJ, 727, 76
- Wagenblast & Hartquist (1989) Wagenblast, R. & Hartquist, T. W. 1989, MNRAS, 237, 1019
- Wakelam et al. (2004) Wakelam, V., Caselli, P., Ceccarelli, C., Herbst, E., & Castets, A. 2004, A&A, 422, 159
- Wakelam & Herbst (2008) Wakelam, V. & Herbst, E. 2008, ApJ, 680, 371
- Wakelam et al. (2011) Wakelam, V., Hersant, F., & Herpin, F. 2011, A&A, 529, A112+