RÉNYI INFORMATION MEASURES FOR SPECTRAL CHANGE DETECTION
Abstract
Change detection within an audio stream is an important task in several domains, such as classification and segmentation of a sound or of a music piece, as well as indexing of broadcast news or surveillance applications. In this paper we propose two novel methods for spectral change detection without any assumption about the input sound: they are both based on the evaluation of information measures applied to a time-frequency representation of the signal, and in particular to the spectrogram. The class of measures we consider, the Rényi entropies, are obtained by extending the Shannon entropy definition: a biasing of the spectrogram coefficients is realized through the dependence of such measures on a parameter, which allows refined results compared to those obtained with standard divergences. These methods provide a low computational cost and are well-suited as a support for higher level analysis, segmentation and classification algorithms.
Index Terms— Change detection, spectral entropy, Kullback divergence, Rényi entropies, segmentation
1 Introduction
The detection of spectral changes within an audio signal can be performed according to many different criteria, depending on the applications; the key point is what kind of spectral change has to be considered significant. A typical problem in audio classification is to identify signal segments with different contents, for example when analyzing a radio stream to separate speech, music or mix of them; another type of problem is speaker change detection, which typically occurs when indexing audio recording of conferences, interviews or lectures. In either case we have to perform a segmentation and a classification, but the interesting spectral changes are completely different. The point of view we consider is at the signal level, since our research is about adaptive resolution methods for analysis, transformation and re-synthesis of a sound.
The use of information measures to evaluate the features of a time-frequency representation of a signal is frequent in the literature: Shannon entropy is applied to evaluate the concentration of the representation seen as a probability distribution, and the derived divergence measures [1] are employed to identify variations within the representation.
The representation we consider is the spectrogram of the signal: through a normalization which gives a unitary sum, we consider the discrete spectrogram in a finite time interval as a probability distribution, and we can apply typical information measures to evaluate its concentration in the time-frequency plane. Fixing the signal , we write to indicate the -th analysis frame in the discrete spectrogram of , where the FFT size is the finite number of sample frequencies considered. Given two normalized analysis frames and , the Kullback divergence [1] is usually employed to have a measure of their difference: a spectral change is detected whenever is larger than a chosen threshold. A refinement of this method (see for example [2]) provides a better robustness to false alarms defining a mean spectrum and comparing its divergence with the new analysis frame.
The first method we propose is a straight extension of the one just described: we consider the divergence measure derived from the Rényi entropy [3] instead of the directed divergence, allowing a tuning of the detection criteria thanks to the dependance of the measure on a parameter. The second method is not based on divergence but on Rényi entropy itself, exploiting one of its fundamental property: the entropy of a union of probability distributions can be evaluated considering the entropy values of the individual distributions. Since we do consider analysis frames as probability distributions, this property can be used to establish the expected entropy value of a certain signal segment when the following frame is added: if the actual value differs significantly from the expected one, the last frame is considered to contain a spectral change.
This kind of algorithm does not need acoustic models to refer to, nor data training: a certain metric is evaluated in a given space [4]. The information measures we take into account can be applied on several different representation of the signal: in [5] the divergence is used in a GMM framework instead of on the spectrogram. In several approach, for example in [6], difference measures are calculated as a first step which gives a suitable analysis for segmentation and classification purposes: for all these algorithms, the class of measures we introduce could ameliorate the detection performances as they allow a further parameter of choice, while still including the divergence for a given value of the parameter.
In the next section we give the essential properties and definitions of the measures considered, then we describe the biasing obtained with the parameter introduced. Finally we present our algorithms and give some examples: we use a speech fragment to compare the detection with the one given by the divergence measure; we take as a reference the segmentation given on the same signal by an HMM-based phoneme segmentation method [7], and the voiced-unvoiced classification obtained with a PSOLA-based algorithm [8]. Our results are interesting as the methods provide a refined adjustable detection, despite of their substantial plainness and low computational cost.
2 RÉNYI ENTROPIES AND INFORMATION MEASURES
Given a finite probability density and a rational number , the Rényi entropy of is defined as follows,
| (1) |
where is in square brackets as we are considering the measure on discrete densities; as tends to one this measure converges to the Shannon entropy, which is therefore included in this larger class. General properties of Rényi entropies can be found in [3], [9] and [10]; in particular, is a non increasing function of , so Moreover, for every order the Rényi entropy is maximum when is uniformly distributed, while it is minimum and equal to zero when has a single non-zero value. As we are working with finite discrete densities we can also consider the case which is simply the logarithm of the number of elements in ; as a consequence for every admissible order . Given a second finite probability density of the same length, if and have exactly the same zeros the Rényi information [3] is defined as follows,
| (2) |
and it tends to the Kullback divergence [1] as tends to one. We can thus consider this class of measures to obtain different divergences as for the Kullback one, and apply them to the spectrogram frames: as long as we can give an interpretation to the parameter, this class of measures offers a largely more detailed information about the time-frequency representation of the signal.
2.1 Biasing spectral coefficients through the parameter
To show the biasing introduced on the spectral coefficients by the parameter we consider a simplified model of a spectrogram composed by a variable amount of large and small coefficients. We realize a vector of length generating numbers between 0 and 1 with a normal random distribution; then we consider the vectors such that
and then normalize to obtain a unitary sum. We then apply Rényi entropy measures with varying between 0 and 30: as we see from figure 1, there is a relation between and the slope of the entropy curves for the different values of .
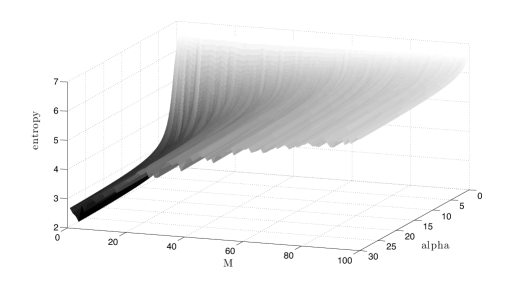
For , is the logarithm of the number of non-zero coefficients and it is therefore constant; when increases, we see that densities with a small amount of large coefficients gradually decrease their entropy. This means that increasing we emphasize the difference between the entropy values of a peaky distribution and that of a nearly flat one. In the next section we will give an example of the exploiting of this important property, but care should be taken when applying this criterium: small coefficients in a spectrogram include signal components of weak amplitude as well as noise; choosing an extremely small the change detection robustness to noise level significantly decreases.
2.2 The entropy prediction method
The second method we introduce is not based on a divergence criterium, but on entropy itself. We first give the definition of Rényi entropy for the case of distribution obtained with a discretization of their continuous version [11]: let be a normalization with unitary sum of a discrete spectrogram, then the Rényi entropy of is
| (3) |
where varies between 1 and the FFT size while varies in the time interval where the evaluation has to be performed, according to the time grid. The term takes into account the time and frequency steps and of the lattice used to sample the continuous spectrogram: this guarantees the stability of the discrete entropy when changing the hop and the FFT sizes, as long as the sampling grid is dense enough in the time-frequency plane. For the entropy of a single analysis frame we write as above, where is the time index of the analysis frame considered; for different analyses frames, we write to focus on the individual vectors. The following properties are straightforward by the definitions.
Proposition 2.1 (Rényi entropy prediction).
Consider a spectrogram and a rational number .
-
(i)
Let be an analysis frame in ; if is obtained rearranging the elements of , then
(4) (5) -
(ii)
In general, if are obtained rearranging the elements of , than
(6)
As a rearrangement we mean a reordering of the frame coefficients, thus including the case of equality between frames. The idea of our method is that given the entropy of a certain signal segment composed by contiguous frames, we can predict supposing the new frame to be spectrally coherent and thus iso-entropic with the previous ones. If on the other hand the entropy value of the new segment largely differs from the predicted value, we assume the new frame to be incoherent with the previous and so a spectral change is detected. There is here a strong assumption concerning the equivalence between the concept of spectral coherence and the fact that two frames are obtained with a rearrangement of their elements; according to the specific needs in the applications, the detection criteria can be based on variations of the property (6) to take into account different definitions of spectral coherence: for example, considering a set of admissible operations on the analysis coefficients in relation with the entropy variation that they provide.
3 ALGORITHMS AND EXAMPLES
We show here an application of the detection algorithms with the measures defined: the first algorithm we analyze has the same operations for the divergence and Rényi information (2): we calculate the spectrogram of a signal with a 1024-samples Hamming window, 768-samples overlap and 2048-points FFT size; we obtain a mean spectrum taking the first 20 analysis frames, and calculate the divergence of the next frame with respect to the mean spectrum. Once we have the first divergence value, we shift the mean spectrum of one analysis frame and consider the following 20 frames, then calculate the divergence between the new mean spectrum and the following frame. At this point, if the ratio between the last divergence value and the previous exceeds a certain threshold, a change is detected at the incoming frame; otherwise the procedure goes on.
The second algorithm is a variation of the first one based on entropy prediction: once obtained the spectrogram of the signal, we calculate the Rényi entropy of the vector composed of its first 6 analysis frames; then we consider the next frame and set the predicted entropy value according to (6). We calculate the actual entropy of the vector obtained adding the new frame to the previous ones, and if the ratio between this value and the predicted one exceeds a certain threshold, a change is detected. Then the procedure goes on as in the previous case.
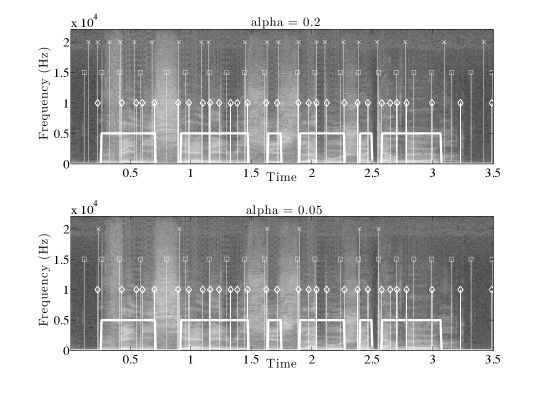
The Rényi prediction shows a slightly better accuracy at the price of a higher computational cost; this is due to the larger dimensions of the vectors managed in the entropy calculus. The tuning of the parameter gives interesting results: as seen in figure 1, higher values rise the difference between the entropies of a peaky distribution and a flat one; thus we expect in general a more refined detection increasing , leaving the threshold unchanged. The signal we analyze is a speech fragment of a mail voice in French language, Vénitienne et lui suce la bouche un quart d’heure. We assume two references: an automatic phoneme segmentation for French language based on Hidden Markow Model [7], and a voiced-unvoiced classification obtained with a PSOLA-based algorithm [8]: they identify the major spectral changes in this kind of signal, so we expect our detection to confirm them. We are not interested in whether a marker belongs to one selection or the other, as this could be established in a later classification step. As we see at the top of figure 2, the Rényi prediction with identifies all the voiced-unvoiced transitions in both senses except at time 2.5, and a large part of phonemes. If we need a less refined detection, setting the parameter to 0.05 (bottom of figure 2) preserves the detection of all the unvoiced-voiced transitions, while discarding all the phonemes and the voiced-unvoiced transitions. Both the measures provide a better detection with respect to the divergence, which shows a higher number of unexpected markers.
References
- [1] J. Lin, “Divergence measures based on the shannon entropy,” IEEE Trans. Info. Theory, vol. 37, no. 1, pp. 145–151, Aug. 2002.
- [2] S. Basu, “A linked-HMM model for robust voicing and speech detection,” in Proc. of ICASSP03, Hong Kong, China, April 6-10, 2003, pp. I–816 – I–819.
- [3] A. Rényi, “On Measures of Entropy and Information,” in Proc. Fourth Berkeley Symp. on Math. Statist. and Prob., Berkeley, California, June 20-30, 1961, pp. 547–561.
- [4] T. Kemp, M. Schmidt, M. Westphal, and A. Waibel, “Strategies for automatic segmentation of audio data,” in Proc. of ICASSP2000, Istanbul, Turkey, June 2000, vol. 3, pp. 1423–1426.
- [5] M. A. Siegler, U. Jain, B. Raj, and R. M. Stern, “Automatic segmentation, classification and clustering of broadcast news audio,” in Proc. of DARPA Speech Recognition workshop, Harriman, New York, 1997.
- [6] J. Foote, “Automatic audio segmentation using a measure of audio novelty,” in Proc. of ICME2000, New York, NY, August 2002, vol. 1, pp. 452–455.
- [7] P. Lanchantin A. C. Morris X. Rodet C. Veaux, “Automatic phoneme segmentation with relaxed textual constraints,” in Proc. of LREC08, Marrakech, Maroc, Mai 2008.
- [8] W. Mattheyses W. Verhelst P. Verhoeve, “Robust Pitch Marking for Prosodic Modification of Speech using TD-PSOLA,” in Proc. of SPS-DARTS 2006, Antwerp, Belgium, March 28-29, 2006, pp. 43–46.
- [9] F. Schlögl C. Beck, Ed., Thermodynamics of chaotic systems, Cambridge University Press, Cambridge, Massachusetts, USA, 1993.
- [10] K. Zyczkowski, “Rényi Extrapolation of Shannon Entropy,” Open Systems & Information Dynamics, vol. 10, no. 3, pp. 297–310, Sept. 2003.
- [11] R.G. Baraniuk P. Flandrin A.J.E.M. Janssen O.J.J. Michel, “Measuring Time-Frequency Information Content Using the Rényi Entropies,” IEEE Trans. Info. Theory, vol. 47, no. 4, pp. 1391–1409, May 2001.