Performance of Particle Identification with the ATLAS Transition Radiation Tracker
Abstract
The ATLAS Transition Radiation Tracker (TRT) is the outermost of the three sub-systems of the ATLAS Inner Detector at the Large Hadron Collider at CERN. In addition to its tracking capabilities, the TRT provides particle identification (PID) ability through the detection of transition radiation X-ray photons. The latter functionality provides substantial discriminating power between electrons and hadrons in the momentum range from 1 to 200 GeV. In addition, the measurement of an enhancement of signal time length, which is related to high specific energy deposition (dE/dx), can be used to identify highly ionizing particles, increasing the electron identification capabilities at low momentum and improving the sensitivity of searches for new physics. This talk presents the commissioning of TRT PID during early 2010 7 TeV data taking. Performance in 2010 and 2011 demonstrating the TRT’s ability to identify electrons, complementary to calorimeter based identification methods, will also be shown.
I Introduction
The ATLAS Inner Detector (ID) is composed of three detector sub-systems: the silicon-based Pixel and SemiConductor Tracker (SCT) detectors, and the gaseous drift tube Transition Radiation Tracker (TRT) DetectorPaper . The TRT is the outermost of the three sub-systems. It employs a unique design which combines tracking measurements with particle identification based on detection of transition radiation (TR). The detection of TR allows for discrimination between electrons and pions over the energy range 1-200 GeV and is a crucial component of the electron selection criteria in ATLAS ElectronPaper . These proceedings present the particle identification (PID) performance of the TRT observed in TeV proton-proton collision data collected with the ATLAS detector at the Large Hadron Collider (LHC) in 2010.
Transition radiation is emitted when a highly-relativistic charged particle with a Lorentz factor traverses boundaries between materials of differing dielectric constants. The active region of the TRT detector contains almost 300,000 straw drift tubes of 4mm diameter. The space between the straws is filled with radiator material. The TR photons (soft X-rays) emitted in the radiator are absorbed in the active gas inside the straw tubes, which serve as detecting elements both for tracking and for particle identification.
Particle identification in the TRT can be further augmented at momenta p 10 GeV through measurements of the time-over-threshold (ToT) of the straw signals, which vary as a function of energy deposition (dE/dx) in the straws. To achieve the best electron-pion separation, TR and dE/dx-based measurements are combined in a single likelihood function for a particle type.
II Transition Radiation Tracker
The TRT is a straw tracker composed of 298,304 carbon-fiber reinforced Kapton straws, arranged in a barrel and two symmetrical end-cap configurations StrawPaper . The barrel section covers mm and mm and has the straws aligned with the direction of the beam axis BarrelPaper .111ATLAS uses a right-handed coordinate system with its origin at the nominal interaction point (IP) in the center of the detector and the z-axis coinciding with the axis of the beam pipe. The x-axis points from the IP to the center of the LHC ring, and the y-axis points upward. Cylindrical coordinates (R, ) are used in the transverse plane, being the azimuthal angle around the beam pipe and R, the distance from the IP in the radial direction. The track pseudo-rapidity is defined as , where the polar angle is the angle between the track direction and the z axis The two end-cap sections cover mm and mm and have the straws arranged in planes composing wheels, aligned perpendicular to the beam axis, pointing outwards in the radial direction EndcapPaper . The TRT extends to pseudo-rapidity . The average number of TRT hits per track is around 34, except in the transition region between barrel and end-caps and at the edge of the acceptance () where it is reduced to approximately 25 hits. Polypropylene fibers interwoven between straw layers are used in the barrel for radiator material and regular polypropylene foils in the end-caps. The straws are filled with a gas mixture of 70% Xe, 27% CO2 and 3% O2. Xenon was chosen for its high efficiency to absorb TR photons of typical energy 615 keV.
The TRT operates as a drift chamber: when a charged particle traverses the straw, it ionizes the gas, creating about 5-6 primary ionization clusters per mm of path length. The straw wall is held at a potential of about 1530V with respect to a 31 m diameter gold-plated tungsten wire at the center that is referenced to ground. The electrons drift toward the wire and cascade in the strong electric field, producing a detectable signal. On each wire the signal is amplified, shaped and discriminated against two adjustable thresholds, a low-threshold (LT) of about 300 eV and a high-threshold (HT) of about 6-7 keV ElectronicsPaper . The two thresholds allow for simultaneous measurement of tracking information and identification of characteristic large energy deposits due to the absorption of TR photons. For any triggered event, the TRT reads out data over three nominal bunch crossing periods, 3x25 ns.222During 2010 running used in these proceedings, the spacing between bunches was 150 ns or greater. The measured drift times are at most 50 ns. Low threshold information is read-out separately in time intervals of 3.12 ns length so that each bunch-crossing is divided into eight time bins. The first low threshold 0 1 transition marks the leading edge (LE) of the signal (hit), and the leading edge time tLE is defined as the center of the first bin set to 1. Similarly, the last 1 0 transition is called the trailing edge (TE) of the hit. High-threshold information is recorded at a coarser granularity, every 25 ns (once per bunch-crossing), giving three HT bits per hit for a triggered event. A hit is said to be a HT hit if any of the three HT bits is high. The leading (trailing) edge time depends on the time when the closest (furthest) ionization electron cluster arrives at the wire at the center of the straw. The leading edge time is thus directly related to the track-to-wire distance rtrack. If the furthest electrons were always produced exactly at the straw wall and drifted for the full straw radius of 2mm, tTE time would be independent of rtrack. Due to the finite interaction length (and thus the limited number of primary ionization clusters) and signal shaping effects, this is not always the case. A particle that deposits more energy will, on average, have a higher signal, exceed the threshold sooner, and fall back below threshold later. Thus, larger energy deposits result in an earlier LE, later TE and longer ToT on average. This correlation can be used to obtain a ToT-based dE/dx estimate.
III Data samples and trigger requirements
Data from proton-proton collisions at the LHC at = 7 TeV recorded by the ATLAS detector in 2010 were used for the studies reported in these proceedings. The detector response for electrons was studied with samples of reconstructed photon conversions and Z boson decays, in order to explore two different momentum ranges and exploit the abundance of photon conversions in early data. The detector response to pions was studied using the same minimum-bias data set as for photon conversions.
A minimum bias trigger was used to record the data set used for the reconstruction of photon conversions and pion candidates. During the initial low-luminosity running period from April 15 to June 5, 2010, the events were collected in the minimum bias trigger stream at a rate that was typically between 40Hz and 200Hz, providing a high statistics sample of electrons from photon conversions. This data set corresponds to an integrated luminosity of approximately = 9 nb-1.
Data recorded June 24, 2010 - October 29, 2010, corresponding to an integrated luminosity of = 35 pb-1, was used to reconstruct electron candidates from Z boson decays. Events were required to be triggered by an electron trigger that has close to 100% efficiency for electrons from Z boson decays selected in this analysis.
The LHC bunch spacing during both running periods was 150 ns or greater. Pile-up from multiple interactions per bunch crossing was small. The average number of minimum bias interactions per beam crossing was less than 0.2 in the data set used for photon conversions, and about three in the data set used to reconstruct the sample of Z bosons.
The results observed in data were compared to Monte Carlo (MC) simulations SimulationPaper . The detector response to electrons from photon conversions and pions in data were compared to Pythia non-diffractive minimum bias MC simulation. The electrons from Z boson decays were compared to Pythia MC simulation.
III.1 Electron candidates
Photon conversions to electron-positron pairs were used to reconstruct a pure sample of electrons in early data. The photon conversion candidates ConvConfNote are required to have two tracks, each with a minimum of 20 TRT hits and four silicon (SCT and Pixel) hits. The conversion vertex is required to be well reconstructed and to be at least 60 mm away from the primary vertex in the radial direction. To improve the sample purity, a tag and probe method is applied to the two tracks of the selected photon conversion candidates. The tag leg is required to have a ratio of the number of TRT high-threshold hits to total TRT hits of at least 0.12, which corresponds to at least three high-threshold hits on a track with the minimum total number of 20 TRT hits. For a conversion candidate passing these requirements, the probe leg is declared to be an electron candidate. The two tracks are treated independently; if both of the tracks pass the tag requirement, each is also used as a probe. Over 500,000 electron candidates satisfy these selection criteria, providing a high statistics sample of electron candidates at the early stages of collision data-taking.
A second sample of electron candidates is obtained from the reconstruction of decays. Electrons from this sample have higher momenta, and can thus be used to probe the TR performance at higher values of . Electron candidates are required to pass the calorimeter based “medium” electron selection criteria ElectronPaper , and to have an innermost Pixel layer (b-layer) hit. Candidate events are required to have two such electrons, with a reconstructed di-lepton invariant mass in the range 75 105 GeV, based on measurements from their calorimeter clusters. Electrons from Z boson decays are treated in the same way as those from photon conversions. The tag leg is required to have a TRT high-threshold ratio greater than 0.12, and both legs are required to have at least 20 TRT hits.
III.2 Pion candidates
Pion candidates are selected from reconstructed particle tracks that have a minimum of 20 TRT and four silicon hits. Further selection criteria are applied to reject electrons, protons and kaons. Any track that does not have a hit in the innermost Pixel layer or that is reconstructed as a part of a photon conversion candidate is excluded. These two requirements reduce electron contamination from photon conversions, which is the dominant source of electrons in the minimum bias data. In addition, any track with a measured dE/dx above 1.6 MeVg-1cm2 in the Pixel detector is excluded in order to reduce the contamination from protons (and to a lesser extent kaons) at low momentum. A track passing these requirements is declared to be a pion candidate.
IV Transition radiation and high-threshold hits
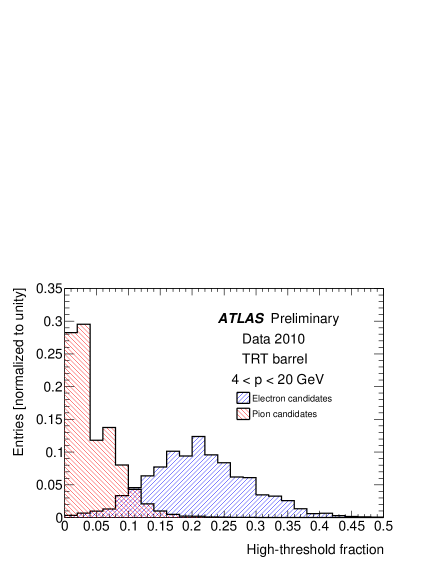
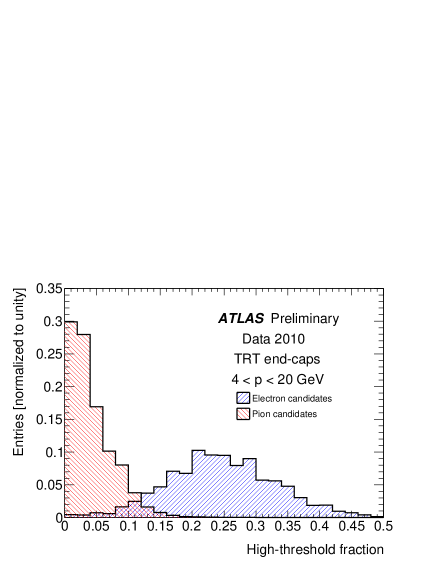
This section presents the results of HT studies in electron from photon conversions and pion samples. Figure 1 shows the HT fraction distributions for electron and pion candidates. The HT fraction is defined as the ratio hits on track that exceed the high threshold to the total number of hits on track. The distribution for electrons is shown in Fig. 1 is clearly shifted to higher values. This value is defined on a per track basis, whereas the high-threshold probability is defined as the total number of high-threshold hits summed over all candidates divided by the total number of hits summed over all candidates. The following sections show the HT dependence on the factor, and performance of a requirement on the HT fraction, in terms of the electron efficiency and pion misidentification probability. Finally, validation of hardware settings with 7 TeV collision data are presented.
IV.1 Transition radiation onset
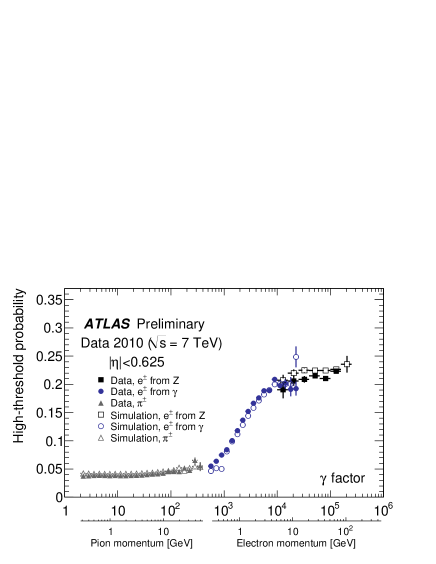
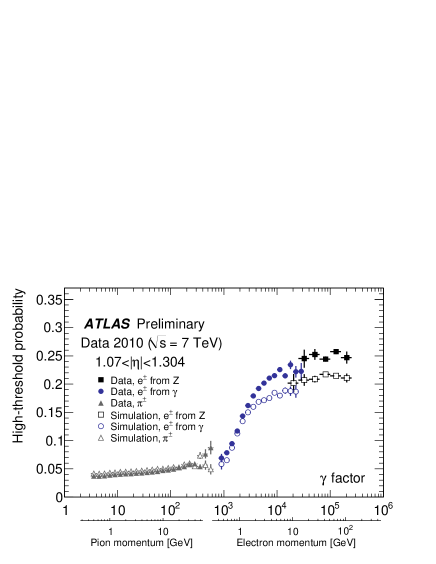
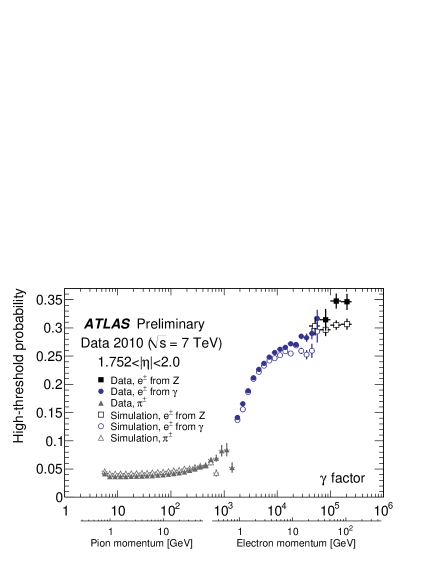
The first step towards establishing electron identification with the TRT is to observe the expected increase in the average number of HT hits with . The increase has been observed in 2004 test-beam data [13],cosmic-ray data [14] and for collision data at GeV [15]. The HT probability observed in 7 TeV collision data is shown in Fig. 2 and is consistent with earlier measurements. The results are shown separately for five intervals in pseudo-rapidity reflecting different detector regions. The errors shown are statistical only. The average HT fraction was evaluated for tracks in bins of the Lorentz factor . The pions, electrons from photon conversions and electrons from Z boson decays cover different ranges. For the electron candidates, the sharp turn-on of the transition radiation can be seen, with the HT probability increasing rapidly from 0.05 to a plateau of 0.2 − 0.3 depending on region. The HT plateau level in the end-cap region is higher than in the barrel. Electrons from the reconstructed Z decays allow studies of HT probability at , which can not be accessed with electrons from photon conversions. Small differences in the HT probability for the electrons from conversions and decays in the overlapping range can not be resolved at the current statistical uncertainty.
The pion candidates shown in Fig. 2 populate the region . In this range, HT hits are caused by large ionization energy deposits due to Landau dE/dx fluctuations. The HT probability for pion candidates increases gradually from about 0.04 at to about 0.07 at 700 (p 100 GeV) due to the rise of with increasing track momentum. This behavior was cross-checked with a sample of pion candidates from decays that has higher pion purity, and the results were in good agreement.
IV.2 Electron efficiency and pion misidentification probability
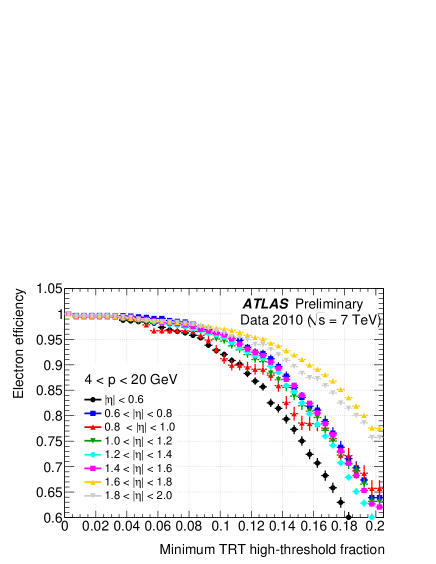
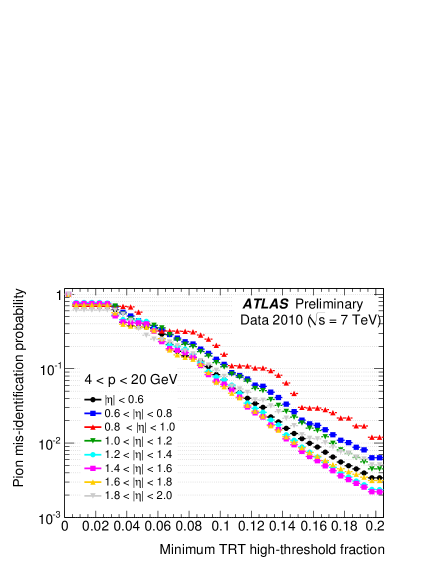
The HT-based electron-pion separation demonstrated in Fig. 1 is utilized by a requirement of a minimum HT fraction for electron identification. Figure 3 shows the fraction of electron candidates that pass a HT fraction selection requirement, in bins of . The pion misidentification probability pπ→e is the probability for a pion to pass an electron HT fraction selection criteria and is shown in Fig. 3. The pion rejection power is . A direct comparison of the electron efficiency and pion misidentification probability is shown in Fig. 4. A benchmark point of a cut on high-threshold fraction that has a 90% electron efficiency is used. The uncertainty on the pion misidentification probability shown in Fig. 4 was estimated by varying the selection criteria such that the electron efficiency changed by 2%. The range of 2% is sufficiently big to include the uncertainties due to hadron contamination in the electron sample of about 1%.
The minimum HT fraction that is required for an electron to pass the ATLAS “tight” electron selection requirement ElectronPaper , the corresponding efficiency for electrons to pass this criterion as well as the pion misidentification probability are summarized in Table 1. The current HT fraction selection criteria were determined based on MC studies prior to the start of collision data-taking, and was chosen such that a pion rejection factor of at least 10 would be achieved after applying the HT fraction electron selection criteria DetectorPaper . In the range 0.625 1.07, only a factor of four was achieved due to fewer hits on track in the transition region and a relatively large HT hit probability for pions for geometric reasons. In the highest bin, the pion rejection factor is almost 100.
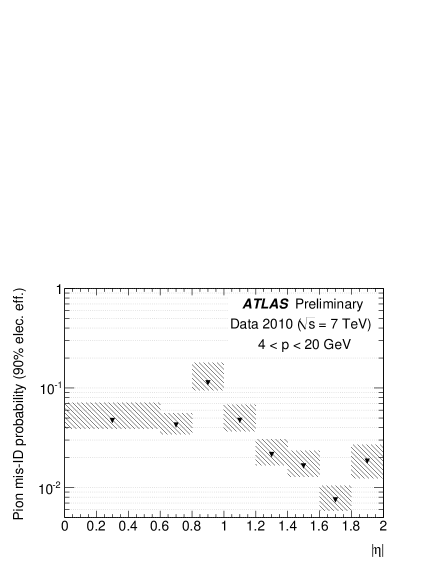
| Range | Minimum HT fraction | Electron Efficiency | Pion misidentification probability |
|---|---|---|---|
| 0.085 | 0.953 0.004 | 0.1268 0.0003 | |
| 0.085 | 0.961 0.005 | 0.2420 0.0004 | |
| 0.115 | 0.921 0.005 | 0.0473 0.0001 | |
| 0.13 | 0.919 0.002 | 0.0174 0.0001 | |
| 0.155 | 0.882 0.002 | 0.0109 0.0001 |
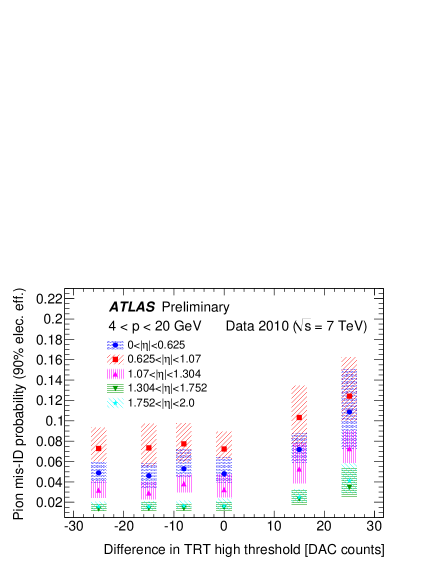
IV.3 Validation of hardware settings
In order to determine the optimal average high threshold setting, data corresponding to an integrated luminosity of 20 nb-1 was taken with different HT settings in July 2010, and the results of the pion rejection study with different settings are reported in this section. An electron trigger that maximized the number of reconstructed photon conversion candidates was used to record these data.
The value of the high threshold can be varied by changing the Digital to Analogue Converter setting (DAC counts) on the Amplification, Shaping, Discrimination, and Base-Line Restoration (ASDBLR) chip ElectronicsPaper , in steps of about 60 eV. Prior to the start of collision data-taking, the average HT was adjusted to the setting that gave the best performance at the test beam. Results from electronics noise scans were used to correct for the large variations in response due to variations in ground offsets.
Validation of the overall average setting for the full detector is reported here. To validate the average HT setting, data were recorded with six different HT settings: nominal settings, 15 DAC counts from nominal, 25 DAC counts from nominal, and 8 DAC counts from nominal. The high-threshold settings were varied uniformly across the entire detector.
As the threshold is decreased, the HT probability increases for both electron and pion candidates. The optimal average HT setting is determined based on the pion rejection power. The HT fraction selection criteria that gives 90% electron efficiency was determined for different values of high threshold settings and for different bins. Figure 5 shows the efficiency for a pion candidate to pass the selection criteria as a function of the high threshold setting difference. The selection criteria at 90% electron efficiency was used as a reference for this study. As in the previous section, the uncertainties were estimated by varying the selection criteria such that the electron efficiency changed by 2%. For all regions, the pion misidentification probability pπ→e is independent of the HT setting in the range of -25 to nominal DAC count. For settings higher than nominal, pπ→e increases. Based on these results, the high-threshold was lowered by eight DAC counts across the detector for 2011 data-taking. The primary reason for lowering the thresholds was to operate at stable settings, where the performance does not vary much if the HT is slightly above or below the nominal.
V Time over threshold based particle identification
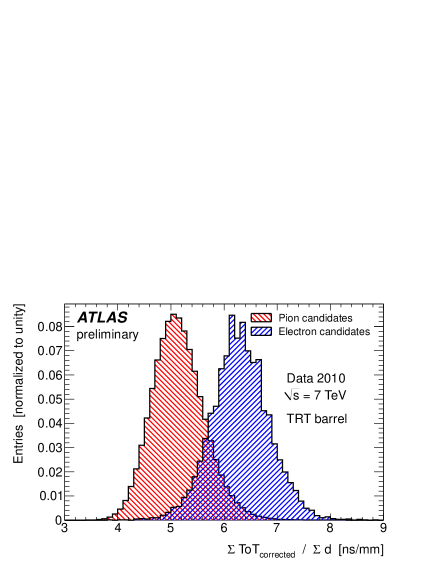
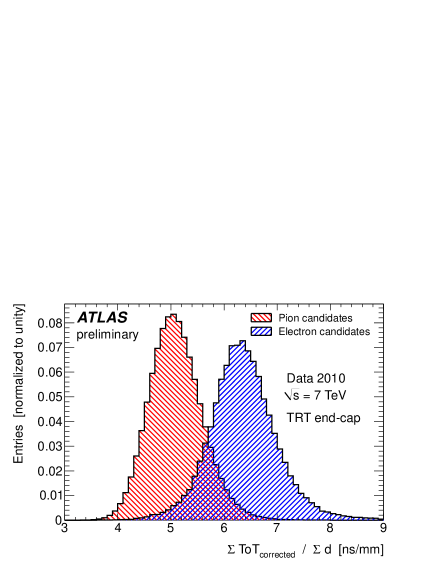
The measured time over threshold is correlated with the ionization deposit within the straw, and can thus be used to better distinguish between electrons and pions based on their expected dE/dx. For the purpose of the dE/dx measurement, the ToT is defined as the number of bits above threshold in the largest single group of bits above threshold, multiplied by the bin width. This method has a similar performance to a method that uses all bits above threshold, and a better performance than a method that uses ttLE.
The ToT is subject to several systematic effects that are not related to dE/dx. The tLE depends on the track-to-wire distance due to the drift time. Due to the limited number of primary ionization clusters, the tTE also depends on the track-to-wire distance. The track-to-wire distance related variation in the measured ToT is about 10 ns. Other smaller effects that can cause variations of a few ns along the wire length are signal attenuation (attenuation length = 4m StrawPaper ), signal reflection from the end of the wire that is not read out, signal delay due to the propagation along the wire and signal shaping. These effects are taken into account by corrections that vary with the track-to-wire distance and distance along the straw. The track-to-wire distance dependent corrections also take into account the dependence of the total energy deposit within the straw on the track length.
The ionization loss for electrons and pions differs the most for particles of low momentum, p 10 GeV. To achieve the best sensitivity, all systematic effects discussed are taken into account. Corrections are made for z dependence in the barrel and R dependence in the end-caps. To take into account the track-to-wire distance dependence, the average corrected ToT measurement is divided by the average track-to-wire distance. The track level ToT-based discriminator is obtained by averaging corrected ToT measurements for all hits on track that do not exceed the HT. The HT hits are not used in order to avoid the correlation between the ToT-based variable and the HT fraction. Figure 6 shows the corrected ToT distributions for the electron and the pion candidates.
VI Combination of HT and ToT measurements
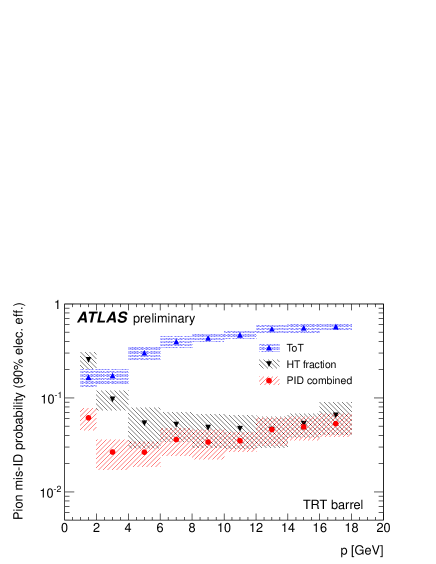
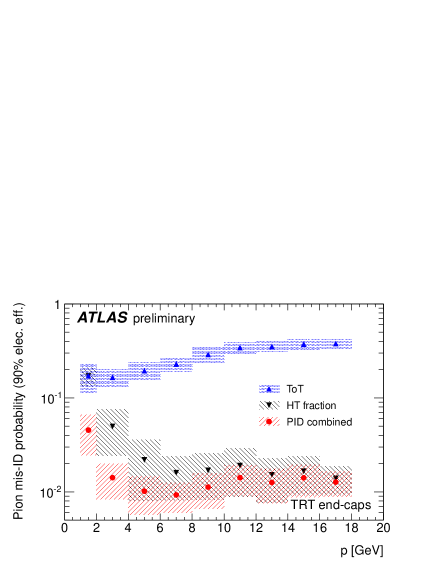
The HT fraction and the ToT measurements can be combined to achieve the best electron identification performance. To combine the HT and ToT measurements, two likelihood functions are first formed based on the discriminating variables: one for HT, and one for ToT. Since the HT hits are not used for ToT discriminator, the two likelihoods are assumed to be independent, and are multiplied to form a single combined likelihood. The electrons are then selected by applying a cut on the combined likelihood. Again, a cut value that gives a 90% electron efficiency was determined in different momentum bins, and applied to the pion sample to determine the efficiency for pions to pass the same criterion. Figure 7 shows the pion misidentification probability pπ→e at 90% electron efficiency as a function of momentum. The uncertainties are again estimated by varying the selection criteria such that the electron efficiency changed by 2%. It should be noted that any contamination of the pion sample with electrons above the TR threshold will systematically bias the estimate of pπ→e by roughly the same amount. As can be seen in the figure, the ToT-based selection improves the pion rejection at p 10 GeV, where the discriminating power of the HT is lower than at high momenta.
VII Summary
Studies in the early collision data collected with the ATLAS detector have confirmed that electron identification based on transition radiation measured by the TRT is performing well, and in some detector regions even exceeds the performance obtained from the current detector simulation. The pion misidentification probability for selection criteria that give 90% electron efficiency is about 5% (rejection factor 20) for the majority of the detector and as low as 1-2% in the best performing detector regions. Analysis of data from a dedicated run with different hardware settings confirmed that the thresholds were close to their optimal value, and only small adjustments were made in order to ensure stable performance under a wide range of operating conditions. The transition radiation measurement was used to identify electrons for the first W boson production cross section measurement by ATLAS [17], as well as for the W+W- cross section measurement [18] and other analyses such as a search for supersymmetry [19]. Time over threshold measurements can be used to further improve the electron identification, in particular for tracks with momentum less than 10 GeV.
References
- (1) ATLAS Collaboration, The ATLAS Experiment at the CERN Large Hadron Collider, JINST 3, S08003 (2008).
- (2) ATLAS Collaboration, Electron performance measurements with the ATLAS detector using 2010 LHC proton-proton collision data, ATLAS note CERN-PH-EP-2011-117
- (3) E. Abat et al., The ATLAS Transition Radiation Tracker (TRT) proportional drift tube: design and performance, JINST 3, P02013 (2008).
- (4) E. Abat et al., ATLAS TRT Barrel Detector, JINST 3, P02014 (2008).
- (5) E. Abat et al., The ATLAS TRT end-cap detectors, JINST 3, P10003 (2008).
- (6) E. Abat et al., The ATLAS TRT electronics, JINST 3, P06007 (2008).
- (7) ATLAS Collaboration, The ATLAS Simulation Infrastructure, Eur. Phys. J. C70, 823-874 (2010).
- (8) ATLAS collaboration, Photon Conversions at GeV measured with the ATLAS Detector, ATLAS note ATLAS-CONF-2010-007 http://cdsweb.cern.ch/record/1274001.