Structural Rigidity of Paranemic (PX) and Juxtapose (JX) DNA Nanostructures
Abstract
Crossover motifs are integral components for designing DNA based nanostructures
and nanomechanical devices due to their enhanced rigidity compared to the normal B-DNA.
Although the structural rigidity of the double helix B-DNA has been investigated
extensively using both experimental and theoretical tools, to date there is no
quantitative information about structural rigidity and the mechanical strength of
parallel crossover DNA motifs. We have used fully atomistic molecular dynamics
simulations in explicit solvent to get the force-extension curve of parallel DNA
nanostructures to characterize their mechanical rigidity. In the presence
of mono-valent Na+ ions, we find that the stretch modulus () of
the paranemic crossover (PX) and its topo-isomer JX DNA structure is significantly
higher ( 30 %) compared to normal B-DNA of the same sequence and length.
However, this is in contrast to the original expectation that these motifs are
almost twice rigid compared to the double-stranded B-DNA. When the DNA motif is
surrounded by a solvent with Mg2+ counterions, we find an enhanced rigidity
compared to Na+ environment due to the electrostatic screening effects arising
from the divalent nature of Mg2+ ions. This is the first direct determination
of the mechanical strength of these crossover motifs which can be useful for the
design of suitable DNA for DNA based nanostructures and nanomechanical devices
with improved structural rigidity.
Key words: PX/JX DNA motif; Atomistic Simulations; Force-extension Curves; Stretch Modulus; Torsion Angles
1 Introduction
The structural properties that enable DNA to serve so effectively as
genetic material can also be used for DNA based computation and for
DNA nanotechnology (1). The success of these
applications to large extent, depends on the complementarity
that leads to the pairing of the strands of the DNA double helix.
This pairing can be exploited to assemble more complex motifs,
based on branched structures with sticky ends that are promising
for building macromolecular structures (1, 2).
The combination of sticky ended ligation (3) and stable
branched DNA species (4) has permitted investigators
to construct DNA molecules whose edges have connectivity of a
cube (5) and of a truncated octahedron
(6). Similarly, branched DNA molecules have
provided the basis for the syntheses of variety of structures such as
knots (7, 8), Borromean rings
(9) and DNA tweezers (10).
One of the early goals of DNA nanotechnology was to construct
precisely configured materials on a much larger scale
(1, 11). However the
key feature that was lacking in such constructions were rigid
DNA molecules, as flexible components failed to maintain the
same spatial relationships between each member of a set
(12). DNA anti-parallel double crossover
molecules (DX) (13), analogous to intermediates
in genetic recombination, were found to be about twice as rigid
as a normal DNA molecules (14) and were subsequently
used for creating two dimensional DNA lattices (15).
The concept of double crossover molecules stems from the concept of
formation of Holliday junction (16), which is the most prominent
intermediate in genetic recombination. These crossover molecules
usually contain two Holliday junctions connected by two double helical
arms. Depending on whether the crossovers are between strands of the
same (called parallel) or opposite (called anti-parallel) polarity,
as well as the number of double helical half-turns (even or odd)
between the two crossovers, different double crossover molecules are
generated. It is known that anti-parallel double helical molecules
are better behaved than the parallel ones and as mentioned above
these anti-parallel molecules have found numerous applications in
nano construction (17). The concept of crossover
molecules also led to the discovery of paranemic crossover molecules (PX)
and its topoisomers, the various JX molecules. The PX motif arises from
the fusion of two parallel double helices by reciprocal exchange at
every possible point where the two helices come in contact, whereas
its topoisomer JXi contains adjacent sites where backbones
juxtapose without crossing over (18). The rigidity of
these crossover motifs has led to wide applicability in DNA
based nanotechnology (19).
Nevertheless, there is lack of quantitative knowledge about the
rigidity of the paranemic PX DNA and its topoisomers JX DNA,
even though they find applications in nano constructions, owing to
their inherent rigidity. Using atomistic simulation studies on PX
and JX structures we have shown that among all synthesized PX and
JX DNA structures, PX-6:5 motif is the most stable and in comparison
with JX motifs the rigidity order runs as PX-6:5 (20, 21). Our
predictions on thermodynamic calculations are in consistence
with the recent experimental studies using calorimetric and denaturing
gradient gel electrophoretic methods (22).
In this report we make an attempt to get a quantitative measure of
the rigidity of these structures from their force-extension curves.
The concept that has been adapted is to pull these structures with
an external force in constant-force ensemble (23) and from
the internal energy as a function of extension of the DNA motif, we
obtain the stretch modulus using Hooke’s law of elasticity.
The stretch modulus in turn gives an estimate of the rigidity of the motifs.
Experimental and theoretical studies have established that when
subjected to an external force, double-stranded DNA (dsDNA)
exhibits different force-extension regimes, stemming from
its unique double-helix structures (24, 25, 26, 27). For example, in the low force regime, the elasticity
of dsDNA is entropy dominated and the experimental force-extension
data obtained with the magnetic bead method can be described very
well by the standard entropic worm-like chain model (24, 28, 29); in the high force regime (starting from 10 pN
to 70 pN), which is accessible with optical tweezers or atomic force
microscopy, when the external force is comparable with the basepair
stacking interaction in dsDNA the polymers can be suddenly stretched
to about 1.7 times its B-form length in a very narrow force range
(30, 31). An explanation of this regime is
attributed to the short-range nature of basepair stacking interactions.
Typically in this regime, the increase in length of the DNA molecule
is due to large distortion in the double helical structure resulting in a
ladder-like structure which is termed as S-DNA (31, 32, 33, 34)
where most of the H-bonds
involving basepairing are intact. It has been shown
that depending on the experimental conditions such as
the force attachment and salt concentration, dsDNA
can undergo either strand-unpeeling transition to ssDNA
(35, 36), or transition to S-DNA
where basepairs are intact (or B-to-S transition)
(31, 37).
In the elastic regime of force-extension curve,
DNA behaves similar to that of a spring and follows the simple Hooke’s
Law: where is the Young Modulus and
is the cross-sectional area of the DNA. The product of Young modulus
and area, gives stretch modulus, . At large forces,
the stacking potential can no longer stabilize the B-form conformation
of dsDNA and the (optimally) stacked helical pattern is severely
distorted (38), and therefore a structural transition from
canonical B-form to a new overstretched conformation. While all these
features are well established for dsDNA and ssDNA, no theoretical or
experimental studies exist for the force-extension behavior of cross-over
DNA molecules such as DX, PX and various JX structures. This paper is
the first attempt to address such lacunas. The paper is organized as
follows: in the next section we describe building of PX/JX nanostructures
and the simulation methodologies. In section 3 we describe
the results from our fully atomistic DNA pulling simulation and in
section 4 we give a summary of the force-extension results and conclude.
2 Computational Details and Methodology
2.1 Building PX/JX structures
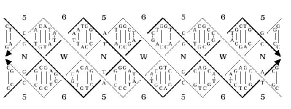
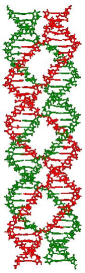
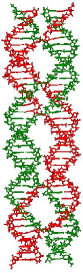
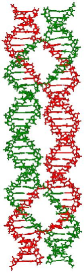
In order to characterize the stiffness of various cross-over DNA motifs, theoretically we have tried to mimic nano-manipulation techniques like AFM, magnetic tweezers, or laser tweezers in our fully atomistic simulations. The basic protocol in our simulation technique was to put the DNA structure in counterion solution, keep one end of the structure anchored, and pull the other end along the PX molecule dyad axis (parallel to the helix axes) with an external force and determine the force-extension curves. The various DNA structures studied are PX-6:5, JX1, JX2, AT-6:5, GC-6:5 and normal B-DNA which are four-strand complexes of DNA paired with one another. Initial structures of PX-6:5, JX1 and JX2 were shown in Fig. 1. We have also studied the force-extension behavior of a double strand DNA having the same length (38 bps) and the sequence of one of the helices of the PX structure. This will allow us to compare the force-extension behavior of the normal double strand B-DNA with that of the cross-over DNA nanostructures. The procedure for constructing these structures is as follows:
-
a.
Building the DNA double helices: Regular B-DNA has between 10 and 10.5 base pairs per helical turn. Hence by varying the twist angle of a selected number of base pairs, we can create B-DNA structures with between 8 and 18 base pairs per helical turn. Table 1 of (20) shows the twist angles used for building the various PX structures. We assigned the same twist angle for all the base pairs in the helical half turn. The helical rise value of 3.4 Å was used to build the PX structures.
-
b.
Building the crossover points: When a double helix is built in Namot2 (version 2.2.) (39), the molecules are oriented so that the 5′ and 3′ ends of the double helices are parallel to the y-axis. To create realistic crossover structures, it is necessary to rotate the individual helices so that the desired crossover points are closest to each other (rotation angles shown in Table 2 of (20)). To find this point we wrote a program that starts with the first crossover point and rotates the first helix in 1∘ increment to find the rotation leading to the shortest distance between these crossover points. Once found, the first helix is rotated by the prescribed value and held steady while the second helix is rotated and the shortest distance between the crossover points determined. The second helix is rotated 180∘ more than the 1st helix so that the helices are arranged as shown in Fig 1. The crossovers were then created using the “nick” and “link” commands in Namot2. These structures are saved in the Protein Database (PDB) file format. Fig. 1 shows the snapshot of the built PX, JX1 and JX2 structures after minimizations.
2.2 Simulation Details for the PX/JX structures
All molecular dynamics simulations were carried out using AMBER8
suite of programs (40) using the Amber 2003 (ff03) force
fields (41, 42) and the TIP3P model (43)
for water. For Mg2+ we have used the Åqvist (44)
interaction parameters. This initial crossover DNA motif is
then solvated with TIP3P model (43) water box using
the LEaP module in AMBER8 (40). In addition,
some water molecules were replaced by Na+ (Mg2+)
counterions to neutralize the negative charge on the phosphate
backbone groups of the PX/JX DNA structure.
We have used Åqvist parameter (44)
set to describe the ion-water as well as ion-DNA interactions.
Åqvist (44) parameters reproduce the location of the first peak
of the radial distribution function for the corresponding
ion-water and the solvation free energies of several ionic species.
After neutralizing the system with counterions,
the concentration of Na+ (Mg2+)
in the PX-6:5, JX1, JX2, AT-6:5, GC:6-5 and normal B-DNA
crossover systems is 246 mM (160 mM) where as for a double
helix B-DNA, the concentration of Na+ (Mg2+) is 254 mM (140 mM).
The ion specificity and electrostatic interactions play crucial in the
DNA functioning and protein-DNA binding mechanism (45, 46).
The LEaP module works by constructing Coulombic potential
on a grid of 1 Å resolution and then placing ions one
at a time at the highest electrostatic potential.
Once the placements of all the ions are done using
the above method long MD simulations ensure that they
sample all the available space around DNA and preferentially
visit electronegative sites. In fact the initial placement
of ions should not influence the final results provided long
simulation was performed before the pulling runs were done.
The radial distribution function provided in the Fig. S1
and S2 of supplementary material also reveal this fact that the
counterions remain associated in the close proximity
( 10 Å) of the DNA. We have also made sure
that no counterion is “stuck” to the DNA molecule
anywhere and observed diffusive behavior. Henceforth
we believe that the initial ion distribution is
important to study DNA properties but ultimately
equilibration is the key for avoiding such initial
ion position dependency.
The box dimensions were chosen in order to ensure a 10 Å
solvation shell around the DNA structure in its fully extended
form when the DNA is in overstretched regime. This procedure
resulted in solvated structures, containing 99734 atoms for
PX-6:5, JX1 and JX2; 97326 atoms for 38-mer B-DNA; 99781
atoms for PX-6:5 structure having only AT sequence and 99705
atoms for PX-6:5 structure having only GC sequence in a box of
dimensions when Na+ ions
are present as counterions. Translational center of mass
motions were removed every 1000 MD steps. The trajectory was
saved at a frequency of 2 ps. We have used periodic boundary
conditions in all three directions for the water box during the
simulation. Bond lengths involving bonds to hydrogen atoms were
constrained using SHAKE algorithm (47). During the
minimization, the PX/JX structure was fixed in their starting
conformations using harmonic potential with a force constant of
500 kcal/mol-Å2. This allowed the water molecules to reorganize
to eliminate bad contacts within the system. The minimized
structures were then subjected to 40 ps of MD, using 1 fs time
step for integration. During the MD, the system was gradually heated
from 0 to 300 K using weak 20 kcal/mol-Å harmonic
constraints on the solute to its starting structure.
NPT-MD was used to get the correct solvent
density corresponding to experimental value of the density.
Lastly, we have carried out pulling the motif in NVT MD with 2
fs integration time step using a heat bath coupling time constant of 1 ps.
The external pulling force was applied at one end on O3′
and O5′ atoms on each strand and the other O5′ and
O3′ atoms of the strands on the other end were fixed with
large force constant of 5000 kcal/mol-Å2. The force was
applied along the direction of the end-to-end vector joining
O3′ and O5′ atoms. The external force started
at 0 pN and increased linearly with time up to 1000 pN with a rate of force of 10-4 pN/fs. For comparison, we have also done the simulation with faster
pulling rate at 10-3 pN/fs. It should be mentioned that
the typical pulling rate in an AFM experiment is of the order
of 104 pN/s whereas the slowest pulling rate achieved in our
simulation is 1011 pN/s (or 10-4 pN/fs) due to
computing limitations. Theoretical model suggests that with the
increased rate of force, the dynamic strength of the molecular
adhesion bonds increases (48). Therefore, since our simulation
employs higher rates of force compared to AFM pulling rates, the
calculated stretch modulus will be higher than that of the stretch
modulus calculated in an AFM pulling experiment. Our pulling protocol was validated for B-DNA (23)
and is expected to be applicable for PX/JX motifs also.
In Fig. S3(a) we have shown the
force-extension curve that is consistent with experimental
curve. Note that the plateau region was observed at 95 pN
instead of 65 pN which has its origin in fast rate of pulling
which is inherent to computer simulations. This MD simulation
has been done with a pulling rate of 10-5 pN/fs, the
slowest pulling rate we could achieve as of now.
We have also done the pulling
simulation at various rates. In Fig. S3(b) we plot the
plateau force as a function of the pulling rate.
From this plot we can see that by extrapolating to
slower pulling rates, one can get a plateau region
like that of AFM pulling experiments. Hence
we expect that we can exactly get the
experimental force-extension curve
when pulled much slower than 10-5 pN/fs such as in AFM or
optical tweezers. Apart from the rate dependency,
the stretch modulus calculation is in
accordance with the experimental result.
3 Results and Discussion
3.1 Force-extension behavior
Fig. 2 gives the force-extension curve for PX-6:5 DNA motif in the presence of Na+ counterions. The force-extension curve consists of an entropic regime where, the extension of DNA beyond its contour length is negligible and this regime continues until 150 pN. Beyond this forces and up to 200 pN, DNA extends to about 30 % with most of the H-bonds are still intact. It has been shown that depending on the experimental conditions such as the force attachment and salt concentration, dsDNA can undergo either strand-unpeeling transition to ssDNA (35, 36), or transition to S-DNA where basepairs are intact (or B-to-S transition) (31, 37). This is followed by an overstretching plateau region resulting in an extension of 1.7 times the initial contour length where the DNA helical structure starts to deform. Beyond this plateau regime is the overstretched structure of DNA which is followed by strand separation. It is worth mentioning that at low rates of force, the above mentioned regimes in the force-extension curves shifts to much lower force values. For comparison we have also shown the force-extension behavior of the normal double strand B-DNA which has same length and sequence as one of the helices of the PX-6:5 structure. From the force-extension curve we can calculate the stretch modulus of DNA in the elastic regime using Hooke’s Law. However, it is known from previous theoretical and experimental studies on the DNA force-extension behavior that at high force regimes a conventional WLC model and its variant does not reproduce the force-extension behavior very well. Previous theoretical studies have demonstrated that at high force regime, non-linear elasticity plays an important role governing the force-extension behavior of the DNA (49) and the WLC model is inadequate to describe the force-extension behavior (50, 51). Therefore, we have also used the following polynomial function to fit the simulated force-extension curve for whole force regime
| (1) |
Integrating the above equation, we get energy
| (2) |
Where is the energy of the DNA when the extension is zero,
is the length of the DNA and is the initial contour length of the DNA.
The coefficients for various values of gives various elastic modulii.
For example, gives the linear stretch modulus.
Stretch modulus can be calculated from both the above
equations by fitting the force and energy as a function of the applied strain.
From the above two equations, it can be seen that the linear term
coefficient and the quadratic term coefficient will give the stretch
modulus, respectively. We have done a sequential fit to the energy vs strain
curve similar to ref (49) where the fitting is done for the
leading quadratic form of energy vs strain plot for restricted data
that are taken around the energy minima and obtain the stretch modulus
as a coefficient of the quadratic term.
By giving more weightage to the quadratic term,
we have done the higher order fit due to the difficulty
in identifying the exact Hooke’s law region.
The term ‘sequential’ essentially means
that the leading terms near the energy
minima are fit to quadratic term and the rest
are fit to higher order terms. This procedure is repeated self
consistently so that the value of
is independent of the for large .
However depends very weakly on
and (that means has lesser
dependence on choice of for ).
The energy vs strain curve has a minimum around
which a quadratic fitting was done and the obtained is
the stretch modulus as shown in equation 2.
The stretch modulus obtained
from a polynomial fit to the force-extension
curve and also from a sequential fit to the energy-strain
curve are listed in table
1.
The values of stretch modulus from the above two fitting methods
are very similar. From the sequential
fit to the energy-strain curve, we find that PX-6:5 has a stretch modulus
of 1636 pN at 246 mM of Na+ concentration when pulled with 10-4 pN/fs
rate, which is 30 % more rigid compared to the stretch modulus 1269 pN of
B-DNA at same concentration and of the same sequence. From the
polynomial fit to the force-extension curve, the same trend was
observed (Table 1).
During the pulling the bond lengths and
bond angles (Fig. 3) are changing very less whereas
the torsion angles (Fig. 3) are changing almost 100 %
with respect to the initial values at zero force
(See next para for more discussion).
This implies that the backbone helix has large internal
dynamics and offer less resistance to the
applied force. Note that the backbone helix gives the
structural stability to the DNA molecule. On
the other hand, bond lengths and bond angles offer more
resistance to the applied force. Hence the
crossover links between helical strands contribute
more to the structural rigidity of these molecules.
Although 30 % of rigidity increase seems small,
yet this enables one to construct promising DNA
nanotechnology devices with enhanced rigidity.
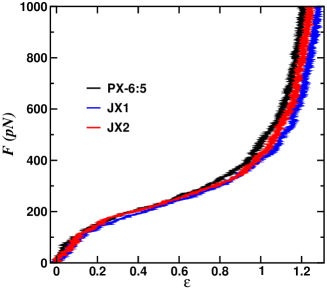
For the JX1, JX2 topoisomers at the same
counterion concentration we obtain 1515 pN, 1349 pN
from sequential fitting and 1373 pN, 1521 pN from polynomial fitting
respectively. Force-extension plot for PX-6:5, JX1 and JX2 is shown
in Fig. 2 and can see a slight change in the slope of
linear region. Among all structures, PX-6:5 has large stretch modulus
both in Na+ and Mg2+ medium due to the most number of crossover points.
It was also shown that the optimal design of repeated stacks and bundles of
nanostructures provide great strength to the molecule (52).
Experimental reports of stretch modulus for lambda phase DNA is of the order
of 1000 pN depending on the environmental conditions like ionic
strength (24, 53). Though we get the stretch modulus
of the same order, the helix to ladder transition occurs at a much larger
force regime than that observed experimentally (54, 55) due to
the higher rates of force employed in our simulation. Experimental
results have shown that the ladder transformation occurs at a much
lower ( 60-70 pN) force than that observed in our simulation data.
It has been observed that a higher force rate leads to higher stiffness of
the short DNA (Fig. 4). This shift of curve and increase of slopes
in force-extension curves is expected since higher rates means that our
simulation is far from being reversible, in which case it dissipates energy
to the environment (since our simulations were constant T = 300 K) and higher
the irreversibility the higher is the work of dissipation which is given by
the area under the force-extension curve. A possible reason may also be the
length of DNA that has been used. Since a 38-mer DNA is too short, its contour
length being significantly smaller than the persistence length of a lambda DNA,
its behavior is likely to deviate from that observed for lambda DNA (24, 53).
To gain further microscopic understanding of the structural
changes with the applied force we have looked at the energetics
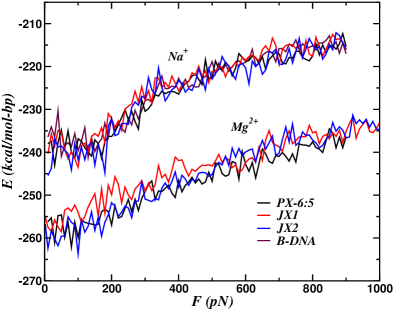
of the PX/JX DNA as a function of the applied force. In Fig.
5 we plot the total internal energy as a function of
force for PX-6:5, JX1 and JX2 DNA structures. The conformational
entropy of the structure is dominating for small forces during which the
change in length is almost negligible. For forces up to 150 pN,
the energy is decreasing and seems to attain minimum value which corresponds
to a most stable configuration. With further increase in force above 150 pN,
the energy of the DNA molecule increases. This implies that the PX/JX DNA
structures become thermodynamically unstable under elongation.
Various backbone parameters were calculated when PX-6:5 structure is
pulled at one end when the structure is neutralized with Na+ and Mg2+ counterions.
The average bond length and
average angles
were changing less than 2 % with applied force with respect to the zero force
equilibrium values (Fig. 3). Correspondingly, the increase in
the energy contribution from bond stretching and angle bending is about to 5-10 %
compared to the zero force case. Interestingly, all the torsion angles
( (56) were changing over
100 % (Fig. 3) with respect to the values at zero force,
which is causing the structural deformation to great extent. The change in
torsion angles is not considerable for forces up to 200 pN during which the
change in DNA contour length is also very less. Dramatic change is observed in
the torsion angles when the DNA motif elongates to almost twice of its initial
contour length at critical force. At this stage,
except the breaking of few H-bonds (23),
we see no considerable change in average bond length or average angle.
We have used geometry measurement
based criteria for the H-bond calculation
in simulation. Generally the H-bond
is represented as DHA where D is the donor and A
is the acceptor which is bonded to D through the H
atom. In the case of DNA, D is a N atom and A
is either a N or O atoms depending on AT and GC
base pairing. When the distance between D and A
atoms is less than 2.7 Å and the angle DHA is
greater than 130∘, we say that the atom A is H-bonded
to atom D otherwise the H-bond is broken.
It is justifiable to argue that the backbone atoms in DNA motif were
drastically re-oriented to give the elastic rod a sudden elongation,
a clear signature indicating very large change in torsion angles.
The torsion energy is also increasing greatly compared to all other
contributions to the total internal energy of the motif.
So a closer look at the various energy contributions reveals that,
when the DNA motif is pulled along the helix axis, there is an increase of
about 5-10 % in the bond stretching and angle bending energy,
15 % increase in van der Waals energy but dramatic increase in the torsion energy.
Apart from all the energy components like bond, angle, van der Waals, Coulomb energy,
this increase in the torsion energy contributes to rapid increase in the total
internal energy at a critical force.
Instantaneous snapshots of PX-6:5
structure at different force in the presence of Na+ counterions is
shown in Fig. 6 (see Fig. S4-S13 for instantaneous snapshots
of PX-6:5, JX1 and JX2 in the presence of Na+ and Mg2+
at various forces, respectively). As the applied force is increased
beyond 200 pN, H-bonds in the basepair were broken and the DNA
overstretches to 1.7 times its initial contour length.
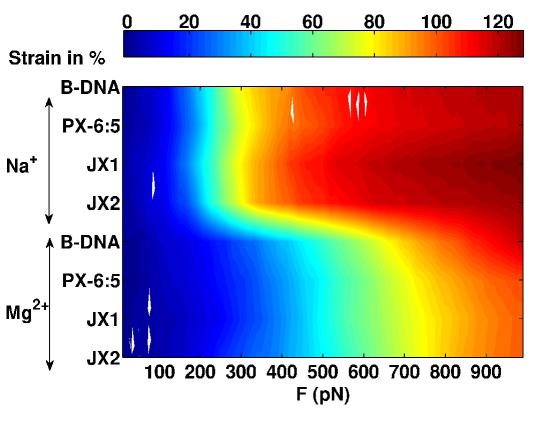
The original experiments on the PX/JX DNA molecules were performed in Mg2+ buffer (18). To understand the pulling response of these DNA nanostructures with divalent cations we have also done the pulling simulation of PX-6:5, JX1 and JX2 structure in the presence of divalent Mg2+ ions. The counterion concentration in our simulation is close to 160 mM and the rate of pulling is 10-4 and 10-3 pN/fs. We have analyzed the force-extension spectrum of all DNA structures in Na+ and Mg2+ ions at 10-4 pN/fs (Fig. 7). Also, Fig. S14(a) shows the force-extension behavior of PX-6:5 molecule in presence of Mg2+ ions. In the presence of Mg2+, PX-6:5 have a stretch modulus of 1840 pN with a pulling rate of 10-4 pN. In contrast, the stretch modulus of B-DNA of same length and sequence as one of the helical domains of PX-6:5 is 1590 pN. Again we see the enhanced rigidity of the PX-6:5 motif as was in the presence of Na+ ions. However, this increase is not as dramatic as in the presence of Na+ ions. Possibly the rigidity can be further enhanced by increasing the ionic strength. For all the structures we find the stretch modulus is more in the presence of Mg2+ than in the presence of Na+ counterions. This is due to the strong phosphate-Mg2+ coordination that resist the external applied force. This result is in accordance with the experimental results on DNA stretch modulus (53) where it is shown that the presence of divalent cations strongly reduce the persistence length of the DNA and hence increase the stretch modulus of the DNA. To understand the effect of crossover on the rigidity of the DNA motifs in the presence of Mg2+ ions we have also done the pulling simulation for JX1 and JX2 motifs. Fig. S14(b) gives the force-extension behavior of the JX1 and JX2 motifs and compared with the PX-6:5 in presence of Mg2+ ions. We get the stretch modulus from the sequential fitting of the energy vs strain plot: JX1 and JX2 have stretch modulus of 1465 pN and 1654 pN respectively. We see the same trend with both 10-4 and 10-3 pN/fs pulling rates as calculated from polynomial fitting. To get more of a molecular level picture we have plotted the internal energy of the PX/JX structure as a function of pulling force as shown in Fig. 5 and we see a similar behavior compared to the energy variation observed in the presence of Na+ ions. Energy is decreasing in the small force regime thus making the DNA structures thermodynamically more stable. The increase in the energy with further load is rapid compared to the case of pulling in Na+ medium. Increase in the total energy with the applied force implies that the PX/JX DNA structure is thermodynamically unstable, with some of H-bonds are broken. We give all the stretch modulus results in both Na+ and Mg2+ counterion solution in Fig. S16. For comparison in Fig. S1 and S2 we show the radial distribution functions of the Na+ and Mg2+ ions with the O1P and O2P Oxygen of the phosphate backbone.
3.2 Effect of DNA basepair sequence and rate of pulling
To investigate the effect of sequence on the structural rigidity of the
PX crossover DNA motifs we have calculated the force-extension profile for
PX-6:5 made of only AT or GC basepairs in presence of Na+ counterions.
The stretch modulus obtained from the sequential fits comes out to be 1592 pN
for AT sequence and 1780 pN for GC sequence. As expected, a PX structure made of
only GC sequence is much stiffer than one made of only AT sequence due to extra
H-bonding in GC basepair. The stretch modulus of crossover PX structures
made of only AT or only GC is still larger than the stretch modulus of 1269 pN of
B-DNA double helix of same length with a combination of AT and GC sequence.
Stretch modulus values for various PX-6:5 and JX structures are
tabulated in table 1 for comparison.
It is known from previous theoretical study that the stiffness of the polymer increase when pulled at faster rate (48). So when pulling with faster rate the bond strength would increase dynamically and hence stretch modulus is expected to increase. Typical AFM pulling rates are of 104 pN/s whereas the slowest pulling rate achieved in our simulation is 1011 pN/s (i.e., 10-4 pN/fs). Therefore due to the higher pulling rates employed in our simulation, the obtained stretch modulus is expected to be higher in magnitude compared to the results obtained from single molecule experiments. Similarly the magnitude of force where the PX/JX structure elongates roughly twice its initial contour length would also be more than that obtained from experiments. To see the effect of rate of force on force-extension behavior and stretch modulus, we have done simulations at two different pulling rates viz., 10-4 pN/fs and 10-3 pN/fs. Fig. 4 shows the force-extension curve for PX structure with two different pulling rates. It is clear from the plot that the force at which the PX structure extends double its initial contour length is very high when pulled with 10-3 pN/fs pulling rate compared to 10-4 pN/fs pulling rate. This is due to the dynamic stiffening of the H-bonds in PX structure when pulled with 10-3 pN/fs compared to 10-4 pN/fs. Breaking of H-bonding is the major signature of mechanical deformation of the DNA molecule (57, 58) We have calculated the fraction of surviving H-bonds as a function of pulling force at two different pulling rates (Fig. 4). As the applied force is increased, the fraction of survived H-bonds decreases and at large enough force the fraction of survived H-bonds goes to zero. From Fig. 4 it is clear that the fraction of surviving H-bonds goes to zero at smaller forces when pulled with 10-4 pN/fs pulling rate compared to 10-3 pN/fs pulling rate. The stretch modulus obtained from energy-strain and force-extension curve are listed in table 1 in the presence of Na+ (Mg2+) counterion medium.
4 Conclusion
We have calculated the rigidity of PX DNA molecules in the presence of Na+ and Mg2+ counterions by directly calculating their force-extension behavior under axial stretching. Earlier we demonstrated (20, 21, 59) the rigidity of these crossover DNA motifs from the vibrational density of states analysis but a quantitative estimate of their structural rigidity was lacking. Now we give a quantitative estimate of the stretch modulus of these DNA strictures. In the presence of Na+ ions at a counterion concentration 246 mM the stretch modulus of the PX-6:5 structure is almost 30 % more than that of normal B-DNA double helix of same length and having sequence of one of the double helical domain of PX-6:5. The computational cost of these calculations is enormous, thus restricting us to use intermediate pulling rates of 10-4 and 10-3 pN/fs. To understand the effect of crossovers on the stretch modulus of these DNA motifs we have also calculated the force-extension profile of the JX1/JX2 motifs in the presence of Na+ counterions. We find that JX1 has stretch modulus of 1515 pN which is slightly smaller than the stretch modulus of PX-6:5 (1635 pN). JX2 has a stretch modulus of 1349 pN which is 286 pN smaller than the stretch modulus of PX-6:5. When the DNA is pulled, among all contributions to the total energy of the DNA, there is a dramatic increase in torsion energy. This increase in torsion energy is due to a very large change in different torsion angles (Fig. 3) which cause the DNA to destabilize with increased force. Interestingly there is almost no change in various bond distances or angles as a function of force (Fig. 3). The similar behavior was observed in the presence of divalent Mg2+ ions. In the presence of Mg2+ we find the stretch modulus of PX-6:5, JX1 and JX2 to be 1875 pN, 1465 pN and 1654 pN, respectively. PX-6:5 has the highest stretch modulus than any other DNA motif as in the case of Na+ medium. Interestingly all structures in Mg2+ medium have more stretch modulus compared to Na+ medium due to large electrostatic screening arising from the divalency of Mg2+ ions. This could be due to the fact that presence of Mg2+ ions gives extra stability to the structure, owing to the strong coordination of Mg2+ with the phosphate atoms of the two double helical domains. We have also studied the effect of the rate of force on the rigidity of DNA motif and found that the increased rate of force enhances the rigidity of the structure.
5 Acknowledgements
We acknowledge Department of Science and Technology (DST),
Government of India for financial support. PKM also thanks Alexander
von Humboldt foundation for sponsoring his visit to Technical University Munich
where part of the work was done and Roland Netz for help with the
sequential energy fitting and valuable comments. We are also grateful
to Prof. Ned Seeman for a critical reading of the manuscript and valuable
suggestions. MS thanks University Grants Commission (UGC),
India for senior research fellowship.
References
- Seeman (2003) Seeman, N., 2003. DNA in a material world. Nature 421:427–431.
- Seeman (2001) Seeman, N., 2001. DNA nicks and nodes and nanotechnology. Nano Lett. 1:22–26.
- Cohen et al. (1973) Cohen, S., A. Chang, H. Boyer, and R. Helling, 1973. Construction of biologically functional bacterial plasmid in-vitro. Proc. Natl. Acad. Sci. USA. 70:3240–3244.
- Seeman (1982) Seeman, N., 1982. Nucleic-Acid junctions and lattices. J. Theor. Biol. 99:237–247.
- Chen and Seeman (1991) Chen, J., and N. Seeman, 1991. Synthesis from DNA of molecule with the connectivity of a cube. Nature 350:631–633.
- Zhang and Seeman (1994) Zhang, Y., and N. Seeman, 1994. Construction of a DNA-truncated octahedron. J. Am. Chem. Soc. 116:1661–1669.
- Du et al. (1995) Du, S., B. Stollar, and N. Seeman, 1995. A synthetic DNA molecule in 3 knotted topologies. J. Am. Chem. Soc. 117:1194–1200.
- Du and Seeman (1994) Du, S., and N. Seeman, 1994. The construction of a trefoil knot from a DNA branched junction motif. Biopolymers 34:31–37.
- Mao et al. (1997) Mao, C., W. Sun, and N. Seeman, 1997. Assembly of Borromean rings from DNA. Nature 386:137–138.
- Yurke et al. (2000) Yurke, B., A. Turberfield, A. Mills, F. Simmel, and J. Neumann, 2000. A DNA-fuelled molecular machine made of DNA. Nature 406:605–608.
- Buehler and Ackbarow (2007) Buehler, M. J., and T. Ackbarow, 2007. Fracture mechanics of protein materials. Materials Today 10:46–58.
- Seeman et al. (1998) Seeman, N., H. Wang, X. Yang, F. Liu, C. Mao, W. Sun, L. Wenzler, Z. Shen, R. Sha, H. Yan, M. Wong, P. Sa-Ardyen, B. Liu, H. Qiu, X. Li, J. Qi, S. Du, Y. Zhang, J. Mueller, T. Fu, Y. Wang, and J. Chen, 1998. New motifs in DNA nanotechnology. Nanotechnol. 9:257–273.
- Fu and Seeman (1993) Fu, T., and N. Seeman, 1993. DNA double-crossover molecules. Biochemistry 32:3211–3220.
- Sa-Ardyen et al. (2003) Sa-Ardyen, P., A. Vologodskii, and N. Seeman, 2003. The flexibility of DNA double crossover molecules. Biophys. J. 84:3829–3837.
- Winfree et al. (1998) Winfree, E., F. Liu, L. Wenzler, and N. Seeman, 1998. Design and self-assembly of two-dimensional DNA crystals. Nature 394:539–544.
- Holliday (1964) Holliday, R., 1964. Mechanism for gene conversion in fungi. Genet. Res. 5:282–&.
- Li et al. (1996) Li, X., X. Yang, J. Qi, and N. Seeman, 1996. Antiparallel DNA double crossover molecules as components for nanoconstruction. J. Am. Chem. Soc. 118:6131–6140.
- Shen et al. (2004) Shen, Z., H. Yan, T. Wang, and N. Seeman, 2004. Paranemic crossover DNA: A generalized Holliday structure with applications in nanotechnology. J. Am. Chem. Soc. 126:1666–1674.
- Yan et al. (2002) Yan, H., X. Zhang, Z. Shen, and N. Seeman, 2002. A robust DNA mechanical device controlled by hybridization topology. Nature 415:62–65.
- Maiti et al. (2004) Maiti, P., T. Pascal, N. Vaidehi, and W. Goddard, 2004. The stability of Seeman JX DNA topoisomers of paranemic crossover (PX) molecules as a function of crossover number. Nucleic Acids Res. 32:6047–6056.
- Maiti et al. (2006) Maiti, P., T. Pascal, N. Vaidehi, J. Heo, and W. Goddard, 2006. Atomic-level simulations of Seeman DNA nanostructures: The paranemic crossover in salt solution. Biophys. J. 90:1463–1479.
- Spink et al. (2009) Spink, C. H., L. Ding, Q. Yang, R. D. Sheardy, and N. C. Seeman, 2009. Thermodynamics of Forming a Parallel DNA Crossover. Biophys. J. 97:528–538.
- Santosh and Maiti (2009) Santosh, M., and P. K. Maiti, 2009. Force induced DNA melting. J. Phys.: Condens. Matter 21:034113.
- Bustamante et al. (1994) Bustamante, C., J. Marko, E. Siggia, and S. Smith, 1994. Entropic elasticity of lambda-phase DNA. Science 265:1599–1600.
- Smith and Pettitt (1996) Smith, P., and B. Pettitt, 1996. Ewald artifacts in liquid state molecular dynamics simulations. J. Chem. Phys. 105:4289–4293.
- Allemand et al. (1998) Allemand, J., D. Bensimon, R. Lavery, and V. Croquette, 1998. Stretched and overwound DNA forms a Pauling-like structure with exposed bases. Proc. Natl. Acad. Sci. USA. 95:14152–14157.
- Rief et al. (1999) Rief, M., H. Clausen-Schaumann, and H. Gaub, 1999. Sequence-dependent mechanics of single DNA molecules. Nat. Struct. Biol. 6:346–349.
- Vologodskii (1994) Vologodskii, A., 1994. DNA extension under the action of an external force. Macromolecules 27:5623–5625.
- Marko and Siggia (1995) Marko, J., and E. Siggia, 1995. Stretching DNA. Macromolecules 28:8759–8770.
- Smith et al. (1996) Smith, S., Y. Cui, and C. Bustamante, 1996. Overstretching B-DNA: The elastic response of individual double-stranded and single-stranded DNA molecules. Science 271:795–799.
- Cluzel et al. (1996) Cluzel, P., A. Lebrun, C. Heller, R. Lavery, J. Viovy, D. Chatenay, and F. Caron, 1996. DNA: An extensible molecule. Science 271:792–794.
- Fu et al. (2010) Fu, H., H. Chen, J. F. Marko, and J. Yan, 2010. Two distinct overstretched DNA states. Nucleic Acids Res. 38:5594–5600.
- Fu et al. (2011) Fu, H., H. Chen, X. Zhang, Y. Qu, J. F. Marko, and J. Yan, 2011. Transition dynamics and selection of the distinct S-DNA and strand unpeeling modes of double helix overstretching. Nucleic Acids Res. 39:3473–3481.
- Chen, Hu and Yan, Jie (2008) Chen, Hu and Yan, Jie , 2008. Effects of kink and flexible hinge defects on mechanical responses of short double-stranded DNA molecules. Phys. Rev. E 77:041907.
- Rouzina and Bloomfield (2001) Rouzina, I., and V. Bloomfield, 2001. Force-induced melting of the DNA double helix. 2. Effect of solution conditions. Biophys. J. 80:894–900.
- van Mameren et al. (2009) van Mameren, J., P. Gross, G. Farge, P. Hooijman, M. Modesti, M. Falkenberg, G. J. L. Wuite, and E. J. G. Peterman, 2009. Unraveling the structure of DNA during overstretching by using multicolor, single-molecule fluorescence imaging. Proc. Natl. Acad. Sci. USA. 106:18231–18236.
- Cocco et al. (2004) Cocco, S., J. Yan, J. Leger, D. Chatenay, and J. Marko, 2004. Overstretching and force-driven strand separation of double-helix DNA. Phys. Rev. E 70:011910.
- Lai and Zhou (2003) Lai, P., and Z. Zhou, 2003. B- to S-form transition in double-stranded DNA with basepair interactions. Physica A 321:170–180.
- Tung and Carter (1994) Tung, C., and E. Carter, 1994. Nucleic-acid modeling tool (NAMOT) - an interactive graphic tool for modeling nucleic-acid structures. Comput. Appl. Biosci. 10:427–433.
- Case et al. (2004) Case, D. A., T. A. Darden, T. E. Cheatham, I., C. L. Simmerling, J. Wang, R. E. Duke, R. Luo, K. M. Merz, B. Wang, D. A. Pearlman, M. Crowley, S. Brozell, V. Tsui, H. Gohlke, J. Mongan, V. Hornak, G. Cui, P. Beroza, C. Schafmeister, J. W. Caldwell, W. S. Ross, and P. A. Kollman, 2004. AMBER8.
- Duan et al. (2003) Duan, Y., C. Wu, S. Chowdhury, M. Lee, G. Xiong, W. Zhang, R. Yang, P. Cieplak, R. Luo, T. Lee, J. Caldwell, J. Wang, and P. Kollman, 2003. A point-charge force field for molecular mechanics simulations of proteins based on condensed-phase quantum mechanical calculations. J. Comput. Chem. 24:1999–2012.
- Wang et al. (2000) Wang, J., P. Cieplak, and P. Kollman, 2000. How well does a restrained electrostatic potential (RESP) model perform in calculating conformational energies of organic and biological molecules? J. Comput. Chem. 21:1049–1074.
- Jorgensen et al. (1983) Jorgensen, W., J. Changrasekhar, J. Madura, R. Impey, and M. Klein, 1983. Comparison of simple potential function for simulating liquid water. J. Chem. Phys. 79:926–935.
- Aqvist (1990) Aqvist, J., 1990. Ion water interaction potentials derived from free-energy perturbation simulations. J. Phys. Chem. 94:8021–8024.
- Baker et al. (2001) Baker, N., D. Sept, S. Joseph, M. Holst, and J. McCammon, 2001. Electrostatics of nanosystems: Application to microtubules and the ribosome. Proc. Natl. Acad. Sci. USA. 98:10037–10041.
- Baker (2005) Baker, N., 2005. Improving implicit solvent simulations: a Poisson-centric view. Current Opinion in Structural Biology 15:137–143.
- Ryckaert et al. (1977) Ryckaert, J., G. Ciccotti, and H. Berendsen, 1977. Numerical-integration of cartesian equations of motion of a system with constraints - molecular-dynamics of N-alkanes. J. Comput. Phys. 23:327–341.
- Evans and Ritchie (1997) Evans, E., and K. Ritchie, 1997. Dynamic strength of molecular adhesion bonds. Biophys. J. 72:1541–1555.
- Hugel et al. (2005) Hugel, T., M. Rief, M. Seitz, H. Gaub, and R. Netz, 2005. Highly stretched single polymers: Atomic-force-microscope experiments versus ab-initio theory. Phys. Rev. Lett. 94:048301.
- Seol et al. (2007) Seol, Y., J. Li, P. C. Nelson, T. T. Perkins, and M. D. Betterton, 2007. Elasticity of short DNA molecules: Theory and experiment for contour lengths of 0.6-7 mu m. Biophys. J. 93:4360–4373.
- Wiggins et al. (2006) Wiggins, P. A., T. Van der Heijden, F. Moreno-Herrero, A. Spakowitz, R. Phillips, J. Widom, C. Dekker, and P. C. Nelson, 2006. High flexibility of DNA on short length scales probed by atomic force microscopy. Nature Nanotechnol. 1:137–141.
- Ackbarow and Buehler (2009) Ackbarow, T., and M. J. Buehler, 2009. Alpha-helical protein domains unify strength and robustness through hierarchical nanostructures. Nanotechnology 20:075103.
- Baumann et al. (1997) Baumann, C., S. Smith, V. Bloomfield, and C. Bustamante, 1997. Ionic effects on the elasticity of single DNA molecules. Proc. Natl. Acad. Sci. USA. 94:6185–6190.
- Konrad and Bolonick (1996) Konrad, M., and J. Bolonick, 1996. Molecular dynamics simulation of DNA stretching is consistent with the tension observed for extension and strand separation and predicts a novel ladder structure. J. Am. Chem. Soc. 118:10989–10994.
- Lebrun and Lavery (1996) Lebrun, A., and R. Lavery, 1996. Modelling extreme stretching of DNA. Nucleic Acids Res. 24:2260–2267.
- Saenger (1984) Saenger, W., 1984. Principles of Nucleic Acid Structure. Springer Verlag, New York.
- Keten and Buehler (2008) Keten, S., and M. J. Buehler, 2008. Asymptotic Strength Limit of Hydrogen-Bond Assemblies in Proteins at Vanishing Pulling Rates. Phys. Rev. Lett. 100:198301.
- Keten and Buehler (2008) Keten, S., and M. J. Buehler, 2008. Geometric confinement governs the rupture strength of H-bond assemblies at a critical length scale. Nano Lett. 8:743–748.
- Maiti et al. (2007) Maiti, P. K., T. A. Pascal, N. Vaidehi, and W. A. Goddard, III, 2007. Understanding DNA based nanostructures. J. Nanosci. Nanotechnol. 7:1712–1720.
| for Na+ (Mg2+) (pN) | |||||
| Sequential Fit | Polynomial Fit | ||||
| DNA | 10-4 | 10-3 | 10-4 | 10 | |
| (pN/fs) | (pN/fs) | (pN/fs) | (pN/fs) | ||
| B-DNA | 254(140) | 1269 | 1358 | 1578(1591) | 1644 |
| PX-6:5 | 246(160) | 1636(1875) | 1737 | 1772(1841) | 2322 |
| JX1 | 246(160) | 1515(1465) | 1558 | 1374(1404) | 2176 |
| JX2 | 246(160) | 1349(1654) | 1480 | 1521 | 2051 |
| AT65 | 246 | 1592 | 1731 | 1378 | 1981 |
| GC65 | 246 | 1780 | 1862 | 1546 | 2138 |
Figure Legends
Fig. 1.
Atomic level structure of PX/JX DNA molecules: (a) The basepair sequences used in the generations of PX-6:5, JX1 and JX2 crossover molecules. Initial structure of (b) PX-6:5, (c) JX1 and (d) JX2 used in our pulling simulation.
Fig. 2.
Force-extension curves: (a) Force-extension behavior of PX-6:5 and B-DNA molecule in the presence of Na+ counterions. (b) Force-extension behavior of PX-6:5, JX1 and JX2 in presence of Na+ ions. The rate of force is 10-4 pN/fs.
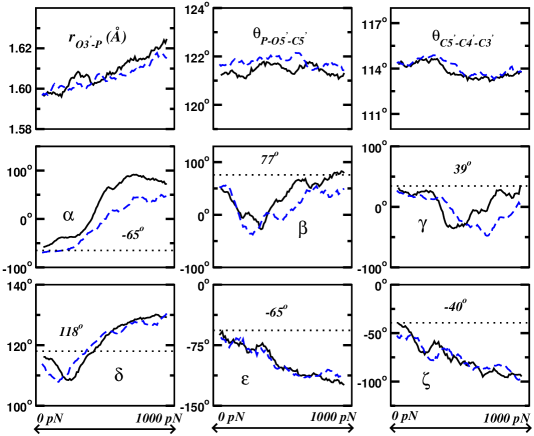
Fig. 3.
Variation of backbone parameters with force: O-P bond distance, P-O-C angle and C-C-C angle as a function of force applied on PX-6:5 in Na+ (black) and Mg2+ (blue dashed line) medium. There is very little change in the bond distance and the angles with the increase in force. Variation of torsion angles alpha (), beta (), gamma (), delta (), epsilon () and zeta () as a function of force applied at the end of PX-6:5 in Na+ (black) and Mg2+ (blue dashed line) medium. There is a very large change over 100 % of the equilibrium zero force limits (dotted lines) in all the torsion angles with the force applied.
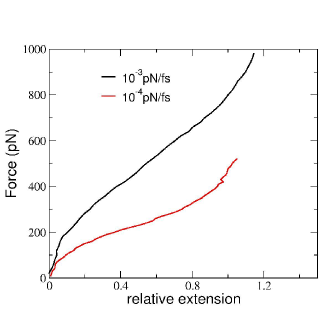
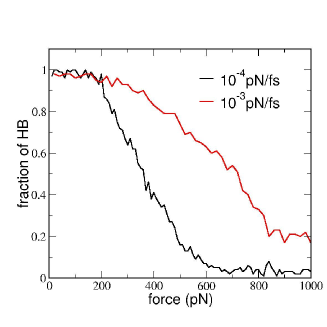
Fig. 4.
Effect of rate of pulling on PX-6:5 structure: (a) Force-extension curve at two different pulling rates. Higher the pulling rate steeper is the response and hence large stretch modulus. (b) Fraction of survived H-bonds as a function of pulling force at different pulling rate. At high pulling rate melting/breaking of H-bonds occurs at larger magnitude of pulling force.
Fig. 5.
Energy of various PX/JX structures as a function of pulling force in Na+ and Mg2+ counterions. The rate of pulling is 10-4 pN/fs. The minimum in the energy curve corresponds to the most stable structure during pulling.
Fig. 6.
Instantaneous snapshots of the PX-6:5 structure at various forces (a) 200 pN, (b) 400 pN, (c) 600 pN, (d) 800 pN and (e) 1000 pN in the presence of Na+ counterions. As the applied force is increased beyond 200 pN, H-bonds in the basepair were broken where the extension in the DNA is almost double its initial contour length.
Fig. 7.
Force-extension spectrum analysis. Upper color bar indicates the strain increase percentage on applying the external force on the various DNA structures. The extension in Mg2+ medium is less than the extension in Na+ medium which implies the enhanced rigidity of the PX/JX DNA molecules in Mg2+ medium.