1–2
Excitation of emission lines by fluorescence and recombination in IC 418
Abstract
We predict intensities of lines of CII, NI, NII, OI and OII and compare them with a deep spectroscopic survey of IC 418 to test the effect of excitation of nebular emission lines by continuum fluorescence of starlight. Our calculations use a nebular model and a synthetic spectrum of its central star to take into account excitation of the lines by continuum fluorescence and recombination. The NII spectrum is mostly produced by fluorescence due to the low excitation conditions of the nebula, but many CII and OII lines have more excitation by fluorescence than recombination. In the neutral envelope, the NI permitted lines are excited by fluorescence, and almost all the OI lines are excited by recombination. Electron excitation produces the forbidden optical lines of OI, but continuum fluorescence excites most of the NI forbidden line intensities. Lines excited by fluorescence of light below the Lyman limit thus suggest a new diagnostic to explore the photodissociation region of a nebula.
keywords:
planetary nebulae: individual IC 418, atomic processes, radiations mechanisms: general1 Models
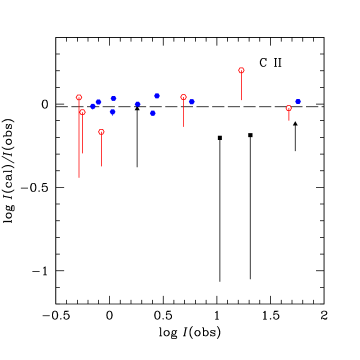

[Morisset & Georgiev (2009)] demonstrated that is it possible to construct consistent models of the central star atmosphere and the nebula to predict accurately the intensities of UV, optical and IR nebular and stellar emission lines in IC 418. We used similar models and included excitation of dipole–allowed transitions by fluorescence besides recombination to predict the intensities of 189 emission lines of C II, N I, N II, O I, and O II observed by [Sharpee et al. (2003)].
The high–resolution synthetic spectrum produced by the CMFGEN code ([Hillier & Miller (1998)]) gives the opportunity to notice variations in the predicted intensities of some emission lines due to the expansion of the nebular gas. We used the CLOUDY nebular code ([Ferland et al. (1998)]) to model the nearly spherical nebula with a density profile similar to the one used by [Morisset & Georgiev (2009)]. Fluorescence is important in the population of s, p, and some d states while recombination populates f and g states.
2 Results
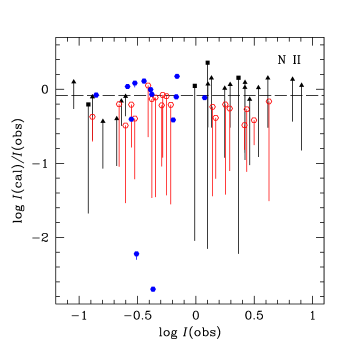
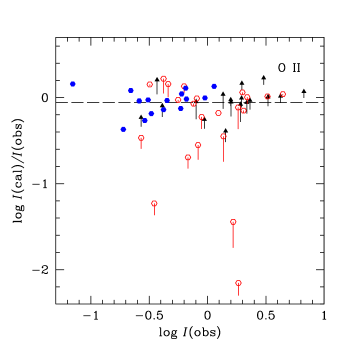
The most important effect of fluorescence is in the N II lines from the decay of s, p and most d states. Intense lines in planetary nebulae like – and – have fluorescence contributions of 78% and 73% respectively. C II lines from most p and d states have between 20% and 69% contribution by fluorescence. O II lines are mostly excited by recombination, but fluorescence can contribute up to 50% of the excitation of states (Figs. 1 and 2).
We can also predict some of the intensities of the N I and O I in a neutral shell around the ionized region. Most permitted O I lines are produced by recombination, while N I permitted and optical forbidden lines are excited by fluorescence (Fig. 2).
References
- [Escalante & Morisset (2005)] Escalante, V. & Morisset, C. 2005, MNRAS, 361, 813
- [Ferland et al. (1998)] Ferland, G. J., Korista, K. T., Verner, D. A., Ferguson, J. W., Kingdon, J. B., Verner, E. M., 1998, PASP, 110, 761
- [Hillier & Miller (1998)] Hillier, D. J., Miller, D. L. 1998, ApJ, 496, 407
- [Morisset & Georgiev (2009)] Morisset, C., & Georgiev, L. 2009, A&A, 507, 1517
- [Sharpee et al. (2003)] Sharpee, B., Williams, R., Baldwin, J.A., van Hoof, P.A.M. 2003, ApJS, 149, 157