Differential-thermal analysis around and below the critical temperature of various low- superconductors: A comparative study
Abstract
We present specific-heat data on the type-II superconductors V3Si, LuNi2B2C and NbSe2 which were acquired with a low-temperature thermal analysis (DTA) technique. We compare our data with available literature data on these superconductors. In the first part we show that the DTA technique allows for fast measurements while providing a very high resolution on the temperature scale. Sharp features in the specific heat such as at the one at the transition to superconductivity are resolved virtually without instrumental broadening. In the second part we investigate the magnetic-field dependence of the specific heats of V3Si and LuNi2B2C at a fixed temperature K to demonstrate that DTA techniques also allow for sufficiently precise measurements of absolute values of even in the absence of a sharp phase transition. The corresponding data for V3Si and LuNi2B2C are briefly discussed.
pacs:
65.40.Ba, 74.25.Bt, 74.25.Dw, 74.70.Ad, 74.70.Dd, 75.40.CxI Introduction
The specific heat is a bulk thermodynamic quantity determined uniquely for every material by its spectrum of excitations. The measurement of the specific heat is a basic technique to reveal the physical properties of a material because it can, in principle, be calculated ab initio from a suitable physical model. The prediction of a linear specific heat, for example, is one of the most important consequences of Fermi-Dirac statistics for electrons in a metal, and its measurement provides a simple test to the electron gas theory of a metal. Because the specific heat is a quantity that is probing the whole sample volume, it is significant to characterize volume effects such as the superconducting state in a material. Therefore, specific-heat measurements have traditionally been of great importance for investigations in the field of superconductivity. The electronic specific heat of superconductors can be expected to yield information about the nature of the superconducting state; and its temperature () dependence should in particular be related to the energy gap Cooper1959May . Specific-heat measurements can also provide information about fluctuation effects Thouless1975April ; Rao1981February ; Zally1971December ; Park2002 ; Lortz2006September , and they are particularly suited to measure phase transitions and to explore the phase diagram of superconductors. Improvements in the techniques for specific-heat measurements are therefore of special value. As an example, the first-order nature of the melting of the flux-line lattice in high-temperature superconductors in the mixed state has been unambiguously proven for the first time by high-resolution specific-heat measurements based on a differential-thermal analysis (DTA) method developed for this purpose Schilling1995October ; Schilling1996August . The DTA method used in our laboratory is particularly suited to detect sharp phase transitions, e.g., first-order phase transitions, and it does not require large sample masses. Since high-quality samples often only exist in form of small crystals, such a sensitive method is of particular interest. In addition, it is often desirable to choose a method that yields a high data-point density within a reasonable measuring time. Common techniques, such as standard heat-pulse or relaxation methods, are sensitive but very time consuming. As an example, the relaxation method implemented in a commercial PPMS platform (Quantum Design) usually takes several minutes per data point for data acquisition, while the DTA technique takes only approximately s per data point, at an impressive data-point density of typically data points per Kelvin. High resolution and high data-point density are needed for the observation of small and sharp effects. In the first part of this work we are comparing corresponding DTA measurements on V3Si, LuNi2B2C, and NbSe2 with measurements done in a commercial PPMS platform and with data from the literature, with a special focus on the transition width of the normal to the superconducting state.
Historically, specific-heat () measurements using DTA techniques have been proven to be particularly powerful when studying relative changes in at sharp phase transitions. However, to extract exact absolute values, or to identify smooth, featureless trends (such as the exact functional temperature dependence of ), is not easy using this technique due to various reasons Schilling1995October . In superconductors, not only the discontinuity in the specific heat at contains valuable information about the superconducting state, but also the temperature and the field dependence of this quantity below are of utmost interest. From the temperature dependence one can draw conclusions about zeroes in the gap function, which may help clarify questions about the nature of the order parameter Goll2005December . A power-law dependence of on temperature has been observed, for example, in YBa2Cu3O7 Wright1999February , with a term for a magnetic field and an term for and low , with a crossover to a stronger dependence at high . Peculiar dependencies, very distinct from the standard one-band s-wave exponential law, can also be expected in multigap superconductors, as has been measured for example in MgB2 Bouquet2002December . On the other hand, the field dependence of at constant temperature may also be influenced by the symmetry of the order parameter and also by other factors Moler1994November ; Wright1999February ; Volovik1993 ; Ramirez1995February . In the second part of this manuscript we show that specific-heat data from DTA measurements can, to some extent, also give useful information on absolute values of , and in particular reveal trends even in the absence of a sharp phase transition. We briefly discuss our data on the magnetic field dependence of for V3Si, and LuNi2B2C at a fixed temperature K.
II Sample Characterization
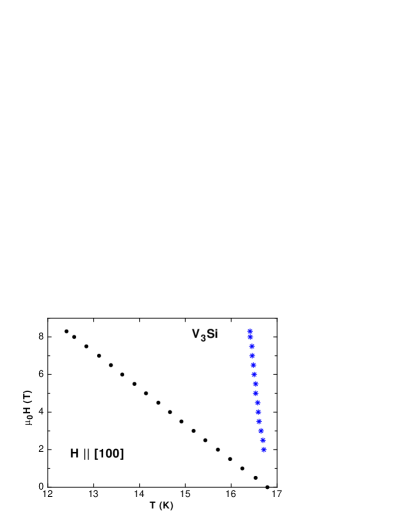
The V3Si single crystalline sphere (mass mg) used for this study has been previously characterized using magnetization measurements by Küpfer et al. (sample ”SA” in Kupfer2004 ). The authors irradiated V3Si samples with fast neutrons, and the present sample was further annealed for h at C in order to decrease pinning effects. We determined the transition temperature to superconductivity of the crystal in zero magnetic field calorimetrically as K. The crystal undergoes a martensitic phase transition from cubic to tetragonal upon cooling through a temperature K (see Fig. 3 and later Fig. 6) as soon as superconductivity is suppressed by a magnetic field. Fig. 1 shows the phase diagram of the investigated sample, showing the upper critical field and the weakly field dependent martensitic transition at .
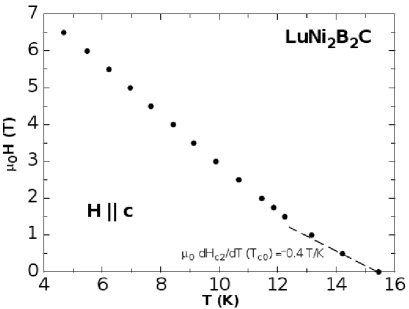
The LuNi2B2C single crystal investigated here (mg) was irregularly shaped, with only a few smooth surfaces. No previous data of physical properties were available for this crystal. We determined the transition temperature as K. In Fig. 2 we show the phase diagram of this sample, with an unusual positive curvature of near . This is an indication for a high quality of the crystal in which the clean limit is achieved Drechsler1999 .
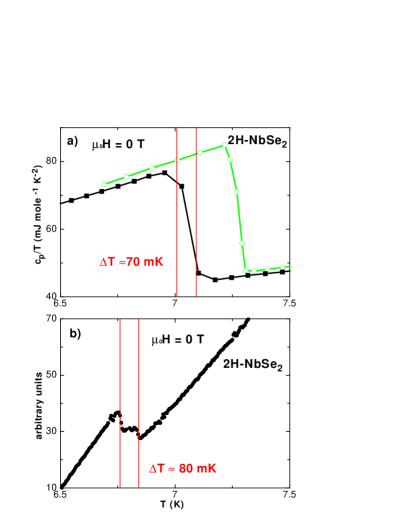
The H-NbSe2 sample under study (mg) consisted of thin slices cut from a large single crystal, which we stuck together with Apiezon N grease. The sample appeared to be somewhat inhomogeneous since we observed two superconducting phase transitions in a narrow temperature interval around K, separated by mK (see below). This inhomogeneity might be a property of the crystal or was later induced by the cutting process. We show results on this ensemble of crystals to demonstrate that high-resolution specific-heat data can be used to clearly identify different superconducting phases even if the respective critical temperatures are very close to each other.
III Results
III.1 1. Phase transition in V3Si, LuNi2B2C, and H-NbSe2
III.1.1 a) V3Si
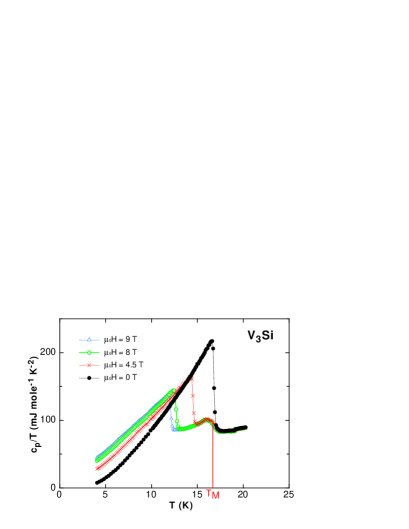
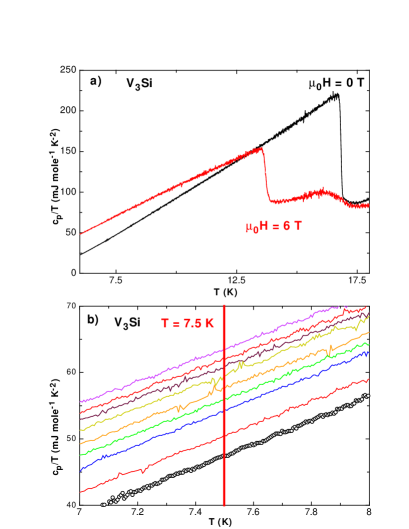
In the first part of this section, we will compare our zero-field data acquired with the DTA method with data collected in a commercial PPMS (Quantum Design) by a conventional heat-relaxation technique. Fig. 3 shows the temperature dependence of the specific heat of the V3Si crystal for four different magnetic fields, measured with the DTA technique. While the transition to the superconducting state is strongly field dependent, the martensitic transition shows only a weak field dependence (see Fig. 1). The martensitic transition at takes place very close to the superconducting transition in zero field and therefore causes a certain broadening of this transition.
In Fig. 4 we show both DTA and PPMS data in zero magnetic field at the transition region around , measured on the same V3Si crystal. Applying a common (-)-criterion to the PPMS data, we find mK for the width of the phase transition. Near , the data-point density for this kind of measurement is data points per Kelvin, and the PPMS setup needed about min to measure the displayed data. The reason for this relative low data-acquisition rate is that both the stabilization of the temperature and the subsequent relaxation for every single data point take considerable time.
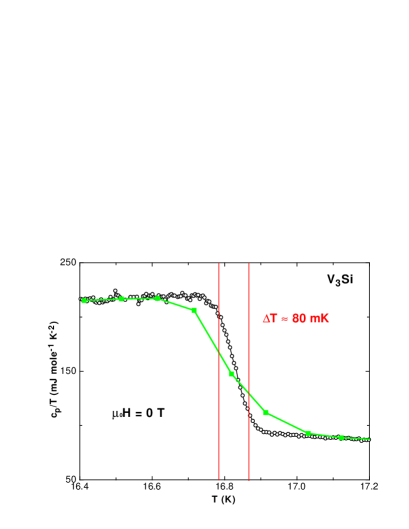
In the same figure we show corresponding specific-heat data collected with the DTA method on the same sample. Near , the data-point density is data points per Kelvin, and the DTA experiment took about min to collect these data. Using again the (-)-criterion we find mK for the width of the phase transition to the superconducting state. This transition is much narrower in the DTA data than in the relaxation method data from the PPMS (by a factor ). Since both measurements have been conducted on the same V3Si crystal, this discrepancy in the transition width cannot be attributed to sample-property issues, but must be ascribed to the different measuring techniques. While every single temperature reading in a DTA experiment can represent, in principle, one data point Schilling1995October ; Schilling2007March , it is the temperature interval needed to measure the relaxation rate that determines the temperature resolution in a relaxation method experiment. This quantity is usually of the order of mK or more, and can only be reduced at the cost of a larger uncertainty and scatter in the data.
We next want to compare the DTA data to results of corresponding specific-heat measurements published by other groups for the same compound that have been obtained by different methods (see Fig. 5). It is obvious from Fig. 5 that the difference in the respective transition widths is prominent. We have reproduced the data of Sebek et al. Sebek2002February in Fig. 5a (open squares) that have also been measured using a commercial PPMS system. Here, the data-point density is data points per Kelvin, roughly times less than in our DTA measurement. The transition width appears to be about mK, which is about times larger than the transition width measured with our DTA method. At the same time this width is also about twice as large as the transition width that we measured for our V3Si crystal with the same relaxation method, which may indicate different sample qualities. One can safely state here that the relaxation methods achieve a considerable lower resolution on the temperature scale than what we routinely reach with a DTA method, while the data-acquisition rate is much higher with the latter method.
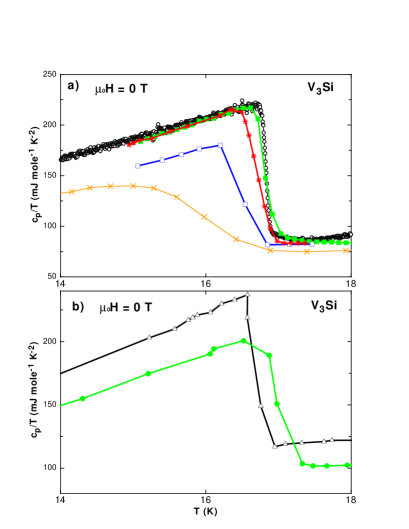
Next, we compare our DTA data to corresponding data from a standard semi-adiabatic heat-pulse technique Ramirez1995February . As an example we have reproduced the data of Ramirez Ramirez1996January , taken on a polycrystalline V3Si sample in zero magnetic field, in Fig. 5a (crosses). This sample was reported to have a K and a transition width of Ramirez1996January (i.e., mK), which is about times larger than the transition width that we measured with our DTA method on a different sample. Besides effects due to the different measuring techniques, this huge discrepancy can be attributed to the polycrystalline nature of the sample measured in Ref. Ramirez1996January that might lead to a certain inhomogeneity and a broadening of the transition to superconductivity. The data-point density of that experiment near is data points per Kelvin.
A similar heat-pulse method was also used by Junod et al., who measured the specific heat with a classical heat-pulse calorimeter on a V3Si single crystal (g) Junod1980 . The transition width can be estimated from the data reproduced in Fig. 5b to mK, which is about five times larger than in our DTA data. The data-point density in this experiment is of the order of data points per Kelvin.
As a last example for the heat-pulse method, we have plotted corresponding data obtained on a V3Si single crystal by Brock Brock1969 . The transition width, taken from the data plotted in Fig. 5b, is mK, which is about four times larger than in our experiment. The data-point density near is of the order of data points per Kelvin.
Finally, we compare our DTA data to an adiabatic method as used by Khlopkin Khlopkin1999January . Details about the measuring technique are not given in Ref. Khlopkin1999January and are, to our knowledge, not published. We assume that the method is either a heat-pulse based technique or a variant of a continuous-heating technique Junod1979 . The corresponding data of a single crystal of V3Si (mg) in zero magnetic field are reproduced from Ref. Khlopkin1999January and are plotted in Fig. 5a (stars). The data-point density here is data points per Kelvin, with a transition width mK.
The A superconductor V3Si usually undergoes a martensitic phase transition. This crystallographic phase transition is known to be very sensitive to point-like or off-stoichiometric defects. Only high-quality samples with a resistivity ratio K)/K) are expected to undergo such a transition that can be revealed by specific-heat measurements. A Peierls instability merely opens a gap on a portion of the Fermi surface, and the associated specific heat should behave qualitatively similar to that of a superconductor Maita1972 . The superconducting gap competes with the Peierls gap, however, and therefore superconductivity suppresses the martensitic transition as can be clearly seen from the absence of a feature coming from the martensitic transformation in our zero-field data shown in Fig. 4. While this transition usually takes place well above in most V3Si crystals, the martensitic transition in the here investigated crystal takes place slightly below .
Fig. 6 shows our specific-heat data of V3Si for both the PPMS relaxation method and the corresponding DTA data in a magnetic field T. The transition width of the structural phase transition is in both cases mK. This coincidence is expected in this case since instrumental broadening is most prominent for very sharp features, while the specific-heat discontinuity of the martensitic transition is too broad to be affected by such effects.
III.1.2 b) LuNi2B2C
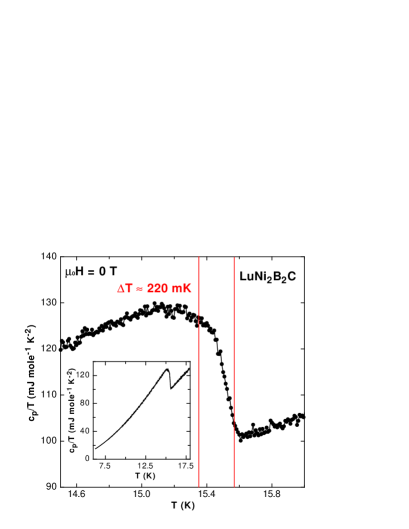
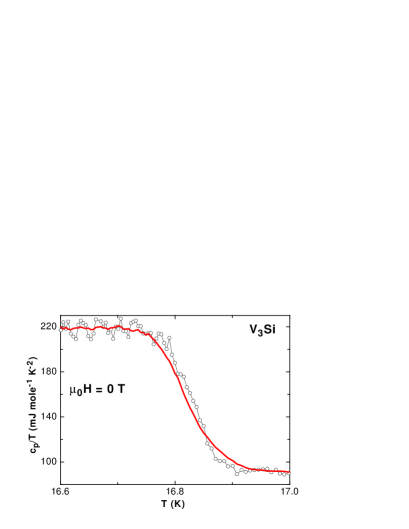
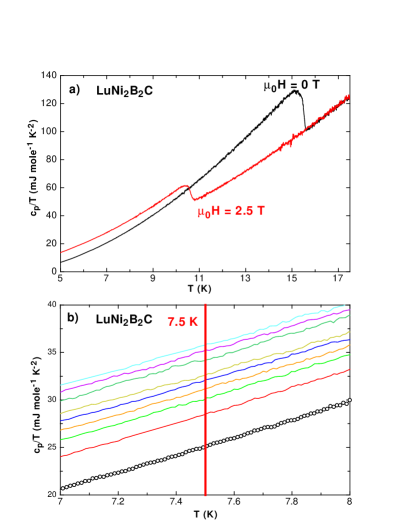
Fig. 7 shows the DTA data of a single crystal of LuNi2B2C (mg) in the transition region around for zero magnetic field. The transition width is mK. The data-point density in that temperature region is data points per Kelvin. The inset shows the complete data set. Note the asymmetric rounding of the discontinuity at the transition to superconductivity at its low-temperature side, which somewhat complicates the determination of the transition width. At present we do not know whether this rounding is an intrinsic property of LuNi2B2C or if it is unique for our sample. Since this rounding is nevertheless a rather narrow feature (mK wide), it might be smeared out in conventional measurements with lower resolution. However, if one does not attribute this feature to the transition to the superconducting state, the transition becomes much sharper, about mK.
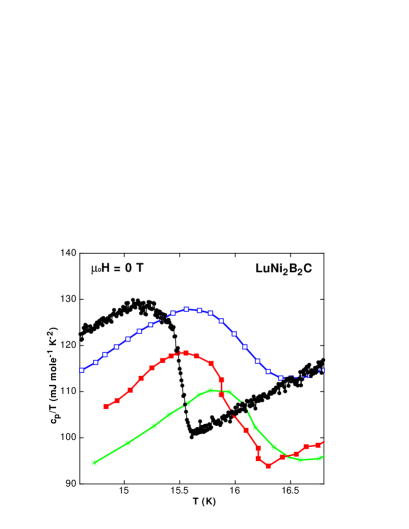
In Fig. 8 we have plotted the above discussed DTA data together with measurements on LuNi2B2C from the literature, which we will discuss in the following. As in the case of V3Si, the difference in the respective transition widths is prominent.
From the data of Nohara et al. Nohara1997July (open squares in Fig. 8), taken on a polycrystalline LuNi2B2C sample using a relaxation method Bachmann1972 we obtain, again using a (-)-criterion, a transition width mK, around nine times larger than we have measured on a single crystal using the DTA method. Again, this may be related to the polycrystalline nature of the sample investigated in Ref. Nohara1997July . Here, the data-point density is data points per Kelvin near .
Corresponding data from another polycrystalline sample but measured using a heat-pulse method Lipp2002May are also plotted in Fig. 8 (filled squares). The transition width, mK, is approximately - times larger than in our single-crystal DTA-data, which may again be related to sample-homogeneity issues. The data-point density in this work is data points per Kelvin.
As a last example for LuNi2B2C, we refer to the data of Kim et al. Kim1994August , who investigated the specific heat of a single crystal of LuNi2B2C with an unknown method. From their data, reproduced in Fig. 8 with stars, we deduce mK for the transition width, again - times larger than the transition width measured with a DTA method. The data-point density in that work is data points per Kelvin.
III.1.3 c) H-NbSe2
In this section, we will show that the high resolution achieved with the DTA method can be used to reveal possible sample inhomogeneities that would otherwise remain unnoticed. In Fig. 9a we reproduced the data of Sanchez et al. Sanchez1995 (squares), obtained on a single crystal of H-NbSe2 with a relaxation method Sanchez1992 . The data-point density is about data points per Kelvin, and the transition width mK. In the same figure, we have plotted the data of Nohara et al. Nohara1999April obtained with a relaxation calorimeter Nohara1997July ; Bachmann1972 for comparison (open circles). The data-point density here is again data points per Kelvin, and mK.
In Fig. 9b we show corresponding DTA data that we have obtained on a NbSe2 sample consisting of several single crystalline pieces stacked together with Apiezon N grease. The data-point density is about data points per Kelvin in the transition region. The DTA data clearly show two steps at the transition to superconductivity, which indicates the presence of areas with different transition temperatures. The transition width of the whole two-step transition is mK but we expect that the transition width of a homogeneous sample with only one would be considerably smaller. This two-step transition is still rather sharp and can be clearly resolved with the DTA method, while it is questionable if such a feature could be resolved using a method with larger instrumental broadening and/or lower data-point density.
To conclude this paragraph, we want to briefly comment on advantages and some peculiarities of the DTA technique as compared to the heat-pulse and relaxation techniques. Apart from advantages concerning speed and data-point density (see Table 1), the resolution of the DTA- data on the temperature scale can be adjusted after a measurement has been done. The reason is that the DTA technique principally measures changes in entropy without any significant instrumental broadening effects Schilling2007March . While in the other two techniques, the resolution in temperature is fixed by the finite temperature intervals used to obtain one single data point in (e.g., the pulse height or the temperature range in which a relaxation is measured), the resolution in temperature of data obtained by the DTA technique is determined by numerical parameters that can be adjusted at will during data processing after the actual measurement. To be more precise, to obtain specific-heat data, the derivative of has to be calculated numerically. This results in data with an impressive resolution on the temperature scale. However, any attempt to increase the accuracy of on the temperature scale is at the expense of the accuracy in as it was discussed in detail in Refs. Schilling1995October and Schilling2007March . The numerical calculation of from experimental data introduces a certain broadening in given by the temperature interval used to calculate this derivative. Moreover, the scatter in the specific-heat data as calculated from such a procedure Schilling2007March is inevitably influenced by such a procedure. It has been shown that the product is a constant that is essentially determined by the total heat capacity and by the limiting accuracy with which the temperatures can be measured Schilling1995October ; Schilling2007March . In other words, any attempt to increase the accuracy of in , e.g., by choosing a narrower interval to calculate , leads to an increased scatter . In order to illustrate this issue, we plotted in Fig. 10 corresponding data evaluated with two different intervals mK (open circles) and mK (thick line) to numerically calculate from the same zero-field data on V3Si. It can clearly be seen that the increase in (here by a factor ) leads to a reduction in scatter , but sharp features like the second order phase transition to superconductivity become more broad on the temperature scale. A detailed discussion of this issue can be found in Refs. Schilling1995October ; Schilling2007March .
While the present comparison has essentially been restricted to the very common heat-pulse and relaxation techniques to measure a specific heat, we want to mention that modern methods of advanced ac calorimetry and continuous-heating techniques can reach at least a comparable resolution on the temperature scale as DTA measurements. As soon as the temperature amplitude in an ac experiment is sufficiently small (as, e.g., in the work of Lortz et al. Lortz2006September using a thermopile-type arrangement), a temperature resolution of mK is routinely achieved. As far as the data-acquisition time and the data-point density is concerned, continuous-heating methods Junod1979 share the same advantages with the DTA technique because both methods operate with a continuously varying temperature of the sample platform while monitoring the sample temperature as a function of time.
| Method | Reference | Substance | Single crystal | (mK) | (K-1) |
| DTA | This work | V3Si | Yes | ||
| Relaxation | This work | V3Si | Yes | ||
| Relaxation | Sebek2002February | V3Si | Yes | ||
| Heat-pulse | Ramirez1996January | V3Si | No | ||
| Heat-pulse | Junod1980 | V3Si | Yes | ||
| Heat-pulse | Brock1969 | V3Si | Yes | ||
| Adiabatic | Khlopkin1999January | V3Si | Yes | ||
| DTA | This work | LuNi2B2C | Yes | ||
| Relaxation | Nohara1997July | LuNi2B2C | No | ||
| Heat-pulse | Lipp2002May | LuNi2B2C | No | ||
| Unknown | Kim1994August | LuNi2B2C | Yes | ||
| DTA | This work | NbSe2 | slices | ||
| Relaxation | Sanchez1995 | NbSe2 | Yes | ||
| Relaxation | Nohara1999April | NbSe2 | Yes |
III.2 2. Low-temperature magnetic-field dependence of the specific heats of V3Si and LuNi2B2C
In the last section of this paper we show that specific-heat data from DTA measurements can reveal trends for the absolute value of even in the absence of a sharp phase transition. As an example, we focus on the low-temperature specific heats of V3Si and LuNi2B2C that smoothly increase with the applied magnetic field , but still may contain valuable information about the physics of the mixed state of these compounds.
In the standard theory of superconductivity Gorter1964 ; Maki1965 ; Abrikosov1988 the magnetic-field dependence of the specific heat in the mixed state is nearly linear in for (i.e., proportional to the number of vortices), and can be written as
| (1) |
where is the Sommerfeld coefficient characterizing the specific heat of the electronic system in the normal state. This increase in can, in the simplest picture, be ascribed to the contribution of the normal cores of the flux lines entering the sample, and a low-temperature linear term is expected to be proportional to up to Caroli1965 . At temperatures , the field dependence of is expected to be more complicated, and a non-linear behavior has been observed in a number of compounds: V3Si Ramirez1996January , LuNi2B2C Nohara1997July ; Nohara1999April , YNi2B2C Nohara1999April ; Michor1995 , NbSe2 Nohara1999April ; Sanchez1995 , UPt3 Ramirez1995February , CeRu2 Hedo1998January , Lu2Fe3Si5 Nakajima2008April , and in YBa2Cu3O7 Moler1994November ; Wright1999February .
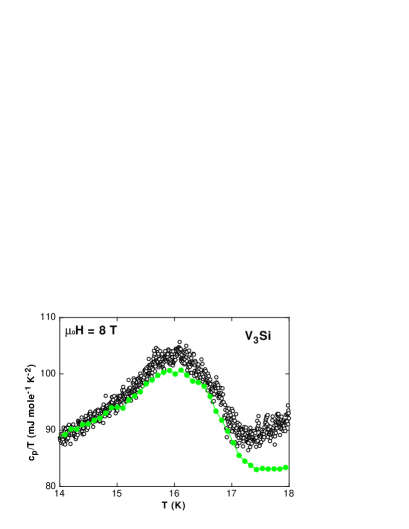
We have measured the specific heat of V3Si in magnetic fields up to T. Fig. 11a shows two DTA data sets for T and T. Below the transition to superconductivity and the martensitic transition the two data sets do not match, which is expected due to the field dependent . In Fig. 11b we show corresponding data in a small temperature interval around K for selected magnetic fields. The non-linear field dependence at the lowest investigated magnetic fields is already visible in this figure.
Extracting the data for a fixed temperature K results in the data plotted in Fig. 12a, demonstrating the magnetic-field dependent specific-heat difference of V3Si (open circles). The dashed line is a guide to the eye and visualizes an approximately linear behavior above T. It can clearly be seen that the data deviate from linearity below T where they are better described by a dependence. For comparison, we have plotted in the same figure the data of Ramirez Ramirez1996January from a non-transforming polycrystalline V3Si sample, i.e., from a sample that does not exhibit martensitic transformation. The deviation from linearity becomes significant for low fields close to the lower critical field . In analogy to Ref. Ramirez1996January we can fit our data to with T being the field where magnetic flux starts to enter the sample Swartz1962 ; Hauser1962 , and mJ mole-1 K-2T-1/2, in good agreement with the result of Ref. Ramirez1996January .
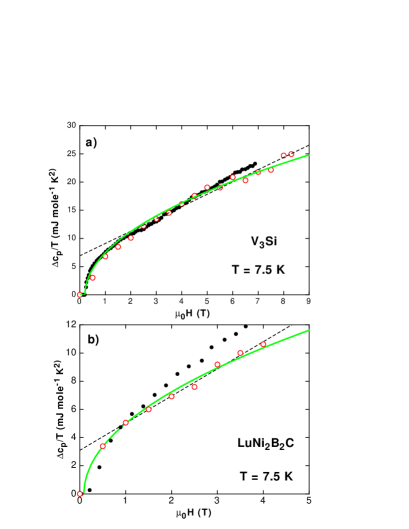
In Fig. 13 we show the magnetic field dependent data for LuNi2B2C in a similar way as we did for V3Si in Fig. 11. From these data we obtain again the specific-heat difference at a fixed K. It can clearly be seen in Fig. 12b that the data deviate from linearity below T where they again may be better described by a dependence. A tentative fit according to with mT Schmiedeshoff2001March gives mJ mole-1 K-2T-1/2.
For comparison we have reproduced the data of Nohara et al. for LuNi2B2C in Fig. 12b. Our data clearly confirm the observation that also in LuNi2B2C is not proportional to .
The prediction of linearity of in strictly holds, within the BCS theory, only for . To test whether or not the BCS prediction for the behavior of data taken at fixed but elevated temperatures might also account for the observed -like dependence of we have simulated corresponding data according to a model that assumes a mixture of a normal-state electronic specific heat that is explicitly proportional to , and a superconducting component proportional to . For the normal-state electronic specific heat we used and for the superconducting component a standard BCS -wave expression , which is a fair approximation not too close to or , respectively. Taking our measured values for and with T for V3Si and T for LuNi2B2C, we obtain the differences as plotted in Fig. 14. It can clearly be seen that although the data for K are somewhat rounded as approaches the upper critical field , the distinct peculiar curvature as observed in the corresponding experimental data for (see Fig. 13) can in no way be reproduced. A systematic study of Nohara et al. Nohara1997July on LuNi2B2C has indeed shown that the dependence of for is qualitatively preserved up to K.
These findings are noteworthy since both V3Si and LuNi2B2C are supposed to be s-wave systems Weger1973 ; Orlando1981 ; Junod1983 . The deviation of from linearity and especially its approximate dependence is very often interpreted as an indication for lines of nodes in the energy gap and taken as a hallmark for a d-wave symmetry of the order parameter Wright1999February ; Moler1994November ; Volovik1993 . We can state here that a non-linear as one observes in the s-wave superconductors V3Si and LuNi2B2C is likely a more general phenomenon of type II superconductors. Possible plausible explanations for this peculiar behavior may include vortex-vortex interactions Fetter1969 ; Maki1965 ; Ramirez1996January , the field dependent shrinking of the vortex cores Nohara1999April ; Kogan2005April , and multigap scenarios Guritanu2004November ; Shulga1998February .

In summary we have presented DTA-specific-heat measurements on various superconductors and compared the achieved temperature resolution to corresponding data obtained by other methods from the literature. The DTA method allows for an exceptionally high resolution on the temperature scale while providing a very high data-point density and a short measuring time. We have also investigated the magnetic-field dependence of the specific heats of V3Si and LuNi2B2C at a fixed temperature K, and found an excellent agreement with corresponding data from the literature. These measurements demonstrate that low-temperature DTA techniques are not only suitable to detect sharp phase transitions, but also allow for sufficiently precise measurements of absolute values of .
IV Acknowledgements
We thank to G. Krauss for technical assistance. This work was supported by the Schweizerische Nationalfonds zur Förderung der Wissenschaftlichen Forschung, Grant. No. . Work at the Ames Laboratory was supported by the Department of Energy, Basic Energy Sciences, under Contract No. DE-AC-CH.
V References
References
- (1) L. N. Cooper, Phys. Rev. Lett. 3, 17 (1959).
- (2) D. J. Thouless, Phys. Rev. Lett. 34(15), 946 (1975).
- (3) N. A. H. K. Rao and A. M. Goldman, J. Low Temp. Phys. 42, 253 (1981).
- (4) G. D. Zally and J. M. Mochel, Phys. Rev. Lett. 27, 1710 (1971).
- (5) T. Park and M. B. Salamon, Phys. Rev. B 66, 134515 (2002).
- (6) R. Lortz et al., Phys. Rev. B 74(10), 104502 (2006).
- (7) A. Schilling and O. Jeandupeux, Phys. Rev. B 52(13), 9714 (1995).
- (8) A. Schilling et al., Nature 382, 791 (1996).
- (9) G. Goll, Springer Tracts in Modern Physics, 214, Springer Verlag (2005).
- (10) D. A. Wright et al., Phys. Rev. Lett. 82, 1550 (1999).
- (11) F. Bouquet et al., Phys. Rev. Lett. 89(25), 257001 (2002).
- (12) K. A. Moler et al., Phys. Rev. Lett. 73(20), 2744 (1994).
- (13) G. E. Volovik, JETP Lett. 58, 469 (1993).
- (14) A. P. Ramirez et al., Phys. Rev. Lett. 74(7), 1218 (1995).
- (15) H. Küpfer et al., Phys. Rev. B 70, 144509 (2004).
- (16) S.-L. Drechsler et al., Physica C 317-318, 117 (1999).
- (17) A. Schilling and M. Reibelt, Rev. Sci. Instrum. 78, 033904 (2007).
- (18) J. Sebek et al., Czech. J. Phys. 52(2), 291 (2002).
- (19) A. P. Ramirez, Physics Letters A 211, 59 (1996).
- (20) M. N. Khlopkin, JETP Lett. 69(1), 26 (1999).
- (21) J. C. F. Brock, Solid State Commun. 7, 1789 (1969).
- (22) A. Junod and J. Muller, Solid State Commun. 36, 721 (1980).
- (23) A. Junod, J. Phys. E: Sci. Instrum. 12, 945 (1979).
- (24) J. P. Maita and E. Bucher, Phys. Rev. Lett. 29, 931 (1972).
- (25) M. Nohara et al., J. Phys. Soc. Jpn. 66(7), 1888 (1997).
- (26) R. Bachmann et al., Rev. Sci. Instrum. 43, 205 (1972).
- (27) D. Lipp et al., Europhys. Lett. 58(3), 435 (2002).
- (28) J. S. Kim et al., Phys. Rev. B 50(5), 3485 (1994).
- (29) D. Sanchez et al., Physica B 204, 167 (1995).
- (30) D. Sanchez et al., Physica C 200, 1 (1992).
- (31) M. Nohara et al., J. Phys. Soc. Jpn. 68(4), 1078 (1999).
- (32) C. J. Gorter et al., Phys. Lett. 8, 13 (1964).
- (33) K. Maki, Phys. Rev. A 139, 702 (1965).
- (34) A. A. Abrikosov, Fundamentals of the Theory of Metals. North-Holland Amsterdam (1988).
- (35) C. Caroli and J. Matricon, Phys. Kondens. Mater. 3, 380 (1965).
- (36) H. Michor et al., Phys. Rev. B 52, 16165 (1995).
- (37) M. Hedo et al., J. Phys. Soc. Jpn. 67(1), 272 (1998).
- (38) Y. Nakajima et al., Phys. Rev. Lett. 100, 157001 (2008).
- (39) P. S. Swartz, Phys. Rev. Lett. 9, 448 (1962).
- (40) J. J. Hauser, Phys. Rev. Lett. 9, 423 (1962).
- (41) G. M. Schmiedeshoff et al., Phys. Rev. B 63(13), 134519 (2001).
- (42) M. Weger and I. B. Goldberg, Solid. State Phys. 28, 1 (1973).
- (43) T. P. Orlando and M. R. Beasley, Phys. Rev. Lett. 46, 1598 (1981).
- (44) A. Junod et al., Phys. Rev. B 27, 1568 (1983).
- (45) A. L. Fetter and P. C. Hehenberg, Superconductivity. Dekker, New York (1969).
- (46) V. G. Kogan and N. V. Zhelezina. Phys. Rev. B 71, 134505 (2005).
- (47) V. Guritanu et al., Phys. Rev. B 70, 184526 (2004).
- (48) S. V. Shulga et al., Phys. Rev. Lett. 80(8), 1730 (1998).