Finite size scaling in asymmetric systems of percolating sticks
Abstract
We investigate finite size scaling in percolating widthless stick systems with variable aspect ratios in an extensive Monte Carlo simulation study. A generalized scaling function is introduced to describe the scaling behavior of the percolation distribution moments and probability at the percolation threshold. We show that the prefactors in the generalized scaling function depend on the system aspect ratio and exhibit features that are generic to whole class of the percolating systems. In particular, we demonstrate existence of characteristic aspect ratio for which percolation probability at the threshold is scale invariant and definite parity of the prefactors in generalized scaling function for the first two percolation probability moments.
pacs:
89.75.Da, 72.80.Tm, 05.10.LnI INTRODUCTION
Recently there is an increasing interest in the randomly distributed stick (rodlike) particles 2003_apl_Ramasubramaniam ; 2005_apl_Bo ; 2009_prl_Trionfi ; 2010_prb_Hazama ; 2010_apl_Sangwan , due to promising developments in the area of the conducting rodlike nanoparticle networks, such as carbon nanotubes, silicon, copper, and silver nanowires, with applications in electronics 2010_apl_Sangwan ; 2008_apl_Li ; 2005_prl_Kumar , optoelectronics 2004_nl_Hu , and sensors 2008_nature_Cao ; 2009_prb_Li . On the theoretical side, most of the work done until now in the field of percolation of random networks is done for lattice percolation 1981_pla_Stauffer ; 1992_jpa_Cardy ; 1992_prl_Ziff ; 1994_prl_Aharony ; 1996_pre_Hovi ; 2000_prl_Newman ; 2002_pre_Ziff ; 2003_ipt_Stauffer . The random stick networks are an important representative of continuum percolation 1974_prb_Pike ; 1983_prb_Balberg ; 1983_prl_Balberg ; 1984_prb_Balberg . Random stick percolation and lattice percolation fall into the same universality class having the same critical exponents 1983_prl_Balberg . Previous studies established that all systems fall on the same scaling function if dimensionality of the system, percolation rule, boundary conditions, and aspect ratio are fixed 1996_pre_Hovi . In applications, aspect ratio of the rectangular system is the only variable parameter, e.g., geometry of transistor gate channel in the carbon nanotube transistors 2005_apl_Bo ; 2010_apl_Sangwan . The objective of the present paper is to describe in consistent way finite size scaling of average percolation density and standard deviation for the asymmetric rectangular stick systems with free boundaries. From general scaling arguments one would expect that for all finite size systems their convergence is governed by an exponent 2003_ipt_Stauffer . For two-dimensional (2D) systems 2003_ipt_Stauffer . Following initial Ziff’s publication 1992_prl_Ziff , Hovi and Aharony 1994_prl_Aharony ; 1996_pre_Hovi argued that the irrelevant scaling variables in the renormalization-group treatment of percolation imply a slower leading-order convergence of percolation probability to its infinite-system value, characterized by an exponent , whose value was deducted from the Monte Carlo work of Stauffer to be 1981_pla_Stauffer . Further it was showed that for lattice percolation on the square system leading exponent of the average concentration at which percolation first occurs is , where 2002_pre_Ziff . All the previous studies were performed for symmetric systems. We show that only in symmetric case the exponent of average density is . In asymmetric systems, we observe a leading exponent. Another quantity, the percolation probability at the percolation threshold in symmetric bond percolating systems is size independent, i.e., scale invariant 1978_prb_Bernasconi . Until now, this behavior is not observed in other types of random percolating systems. We will demonstrate that asymmetric systems can exhibit scale invariant behavior.
In this paper, we investigate finite size scaling of the asymmetric rectangular stick systems with free boundaries. Both from renormalization group considerations and in the simulations, we find that aspect ratio strongly influences scaling behavior of the percolation probability distribution function moments, i.e., average density of sticks at which percolation first occurs and variance of percolation probability distribution function. A generalized scaling function is introduced, with aspect ratio dependent prefactors and constant exponents of the expansion. Finally, it is shown that percolation probability of the asymmetric infinite sticks system at the critical threshold density agrees with Cardy’s analytic formula 1992_jpa_Cardy .
II NUMERICAL METHOD FOR CALCULATION OF PERCOLATION PROBABILITY
Monte Carlo simulations, coupled with an efficient cluster analysis algorithm and implemented on grid platform, are used to investigate the stick percolation 2001_pre_Newman ; 2002_cpc_Stankovic ; 2011_jgc_Balaz ; 2009_pre_Li . We consider two dimensional (2D) systems with isotropically placed widthless sticks. The sticks of unit length are randomly positioned and oriented inside the rectangular system of width and height . Two sticks lie in the same cluster if they intersect. System percolates if two opposite boundaries are connected with the same cluster. The aspect ratio is defined as the length of the rectangular system in percolating direction divided with the length in perpendicular direction. We define the normalized system size as a square root of the rectangular area (geometric average), which represent the length of the square system with the same area. The behavior of stick percolation is studied in terms of the number stick density . The percolation threshold of infinite system is defined by the critical density 2009_pre_Li . Monte Carlo simulations are performed for wide range of the aspect ratios, . In order to ensure the same precision for small and large systems we collected more than Monte Carlo realizations for small systems , down to for the largest system . Using appropriate functions for fitting data and the least squares fitting methods excellent fits were obtained () for all analyzed systems with . Statistical errors for the calculations are estimated in conventional fashion using standard deviation 2001_pre_Newman .
Percolation probability function , is the probability that the system with sticks, size and aspect ratio percolates. It is convenient to pass from the discrete percolation probability function for sticks to a probability function for arbitrary stick density 2009_pre_Li
| (1) |
with percolation probability distribution function defined as . The average stick percolation density at which, for the first time, a percolating cluster connects boundaries of the system is
| (2) |
where the last equality follows from integrating by parts. Another important parameter of probability distribution function, , is variance , where is calculated as
| (3) |
Equations (2) and (3) allow calculations of the first two moments directly from discrete percolation probability function . This is computationally more efficient since it avoids calculation of function with high resolution.
III GENERALIZED SCALING FUNCTIONS FOR MOMENTS
The percolation probability function is related to the universal scaling function 1996_pre_Hovi
| (4) |
The arguments of the universal scaling function are , , and , where , , and are the nonuniversal metric factors, are the irrelevant variables, and are the corrections to scaling exponents, (. Using free boundary conditions and considering two complementary systems: the sticks and empty space around the sticks, we can conclude that either the sticks percolate in one direction or the empty space percolates in the opposite direction:
| (5) |
Taking the derivative with respect to , , and and evaluating the derivatives at , (i.e., at ), we conclude that , for even. Expanding the percolation probability function near the critical point we find that
| (6) |
where the functions and are defined by
| (7) |
and
| (8) |
Since percolation probability distribution function gives the probability distribution for a system of size and aspect ratio to percolate for the first time at stick density , we can define the moments of this distribution
| (9) | |||||
Substituting Eqs. (6)-(8) in Eq. (9) the th moment scales as
| (10) |
where we introduce general functions . For odd , is odd function and are even functions of . For even , is even and are odd functions. Therefore, observed parity of prefactors in respect to should be independent of the type of the system.
From Eq. (10) the scaling behavior of the can be described with generalized moment scaling function with aspect ratio dependent coefficients
| (11) |
where are the corrections to scaling exponents. The zeroth-order correction to exponent should be zero 2003_ipt_Stauffer . In analogy to , for variance we introduce expansion
| (12) |
From Eq. 10 and the parity of and , for the zeroth-order and the first-order prefactors for and near (i.e., ), we obtain approximate expressions for , , , .
IV RESULTS AND DISCUSSION
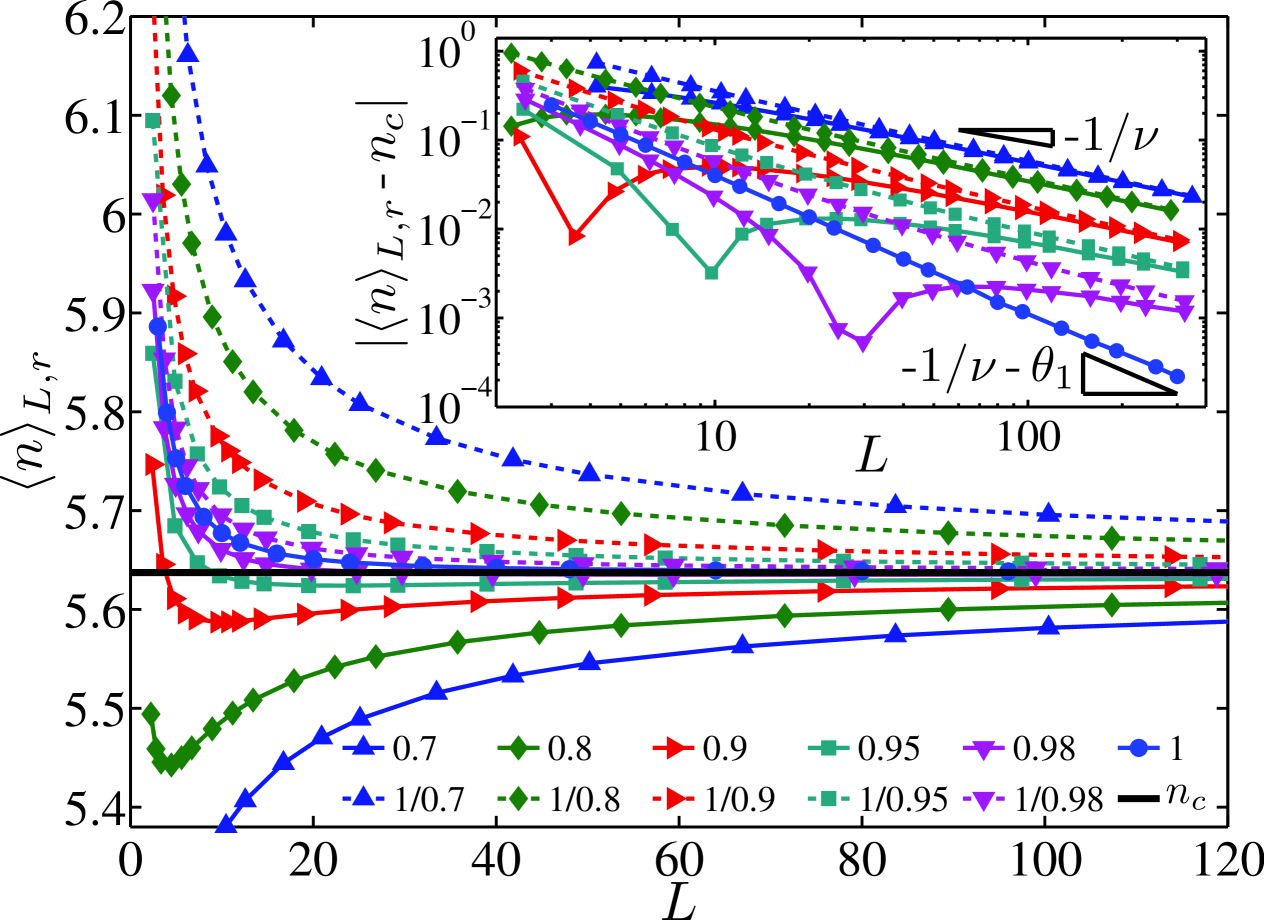
The results for percolation probability and distribution function are shown in Fig. 1. One observes that the slope of percolation probability function increases with the increase of the system size. The percolation probability function curves intersect approximately at . The fine behavior of percolation probability at will be discussed bellow. With the increasing system size, the standard deviation of probability distribution function decreases to zero. Also, average stick percolation density , which corresponds roughly to maximum of probability distribution function , approaches to percolation threshold . For , converges to from below with increase of the system size . The reason for this is that narrow finite systems will be spanned already at lower densities than . For , converges from above, while for symmetric systems () is roughly centered at , see Fig 1. From Fig. 2, one can see that average stick percolation density for aspect ratio higher than one is monotonically decreasing function of the system size . Somewhat surprising, for aspect ratios lower than one, is not monotonic function and has local minimum, i.e., for small systems is a decreasing function, which passes through , reaches a minimum and after that converges to from below. In inset of Fig. 2, one can see that for large system sizes all the curves show power law convergence to the percolation threshold with exponent , except in the symmetric case, i.e., , where exponent is . Absolute values of the leading-order prefactors are the same for aspect ratios and . Higher exponent of symmetric systems comes from the basic physics of percolation that is connectedness. We can illustrate this using a simplified image of site percolation by introducing quantity as probability that the sites with occupancy form a spanning path. The percolation probability and occupancy are equivalent to the percolation probability function and stick density , respectively. In this image, a cell coming out of the renormalization (coarse graining) transformation is occupied only if it contains a set of sites that span this cell. The universal scaling function in previous section reflects the fact that the probability of the spanning system at the percolation threshold remains unaltered under this transformation 2003_ipt_Stauffer . Therefore fixed point of this system, i.e., the critical percolation threshold, is satisfying relation . We can expand the percolation probability around the percolation threshold , . Also, if we renormalize lattice by a length factor , close to , characteristic length changes as . Since , we can write another relation, , connecting characteristic lengths before and after renormalization. From these two relations one can conclude that critical exponent should be
| (13) |
From Fig 1, one can see that probability density which is derivative of at , is always larger for symmetric systems than for asymmetric systems of the same size. Therefore, from Eq. (13), one expects higher absolute value of the exponent in symmetric compared to asymmetric systems. Another conclusion one can draw from this analysis, is that the observed exponents are a result of the interplay of the characteristic length and the system shape. Usually, such behavior is attributed to a competition between two-dimensional and three-dimensional (or one-dimensional and two dimensional), e.g., in Ising model for slab geometries, cf. Ref 2005_plischke . In this system we observe that there is sharp transition in nature of scaling when we pass from symmetric to asymmetric system, and a competition between exponents characteristic for symmetric and asymmetric systems.

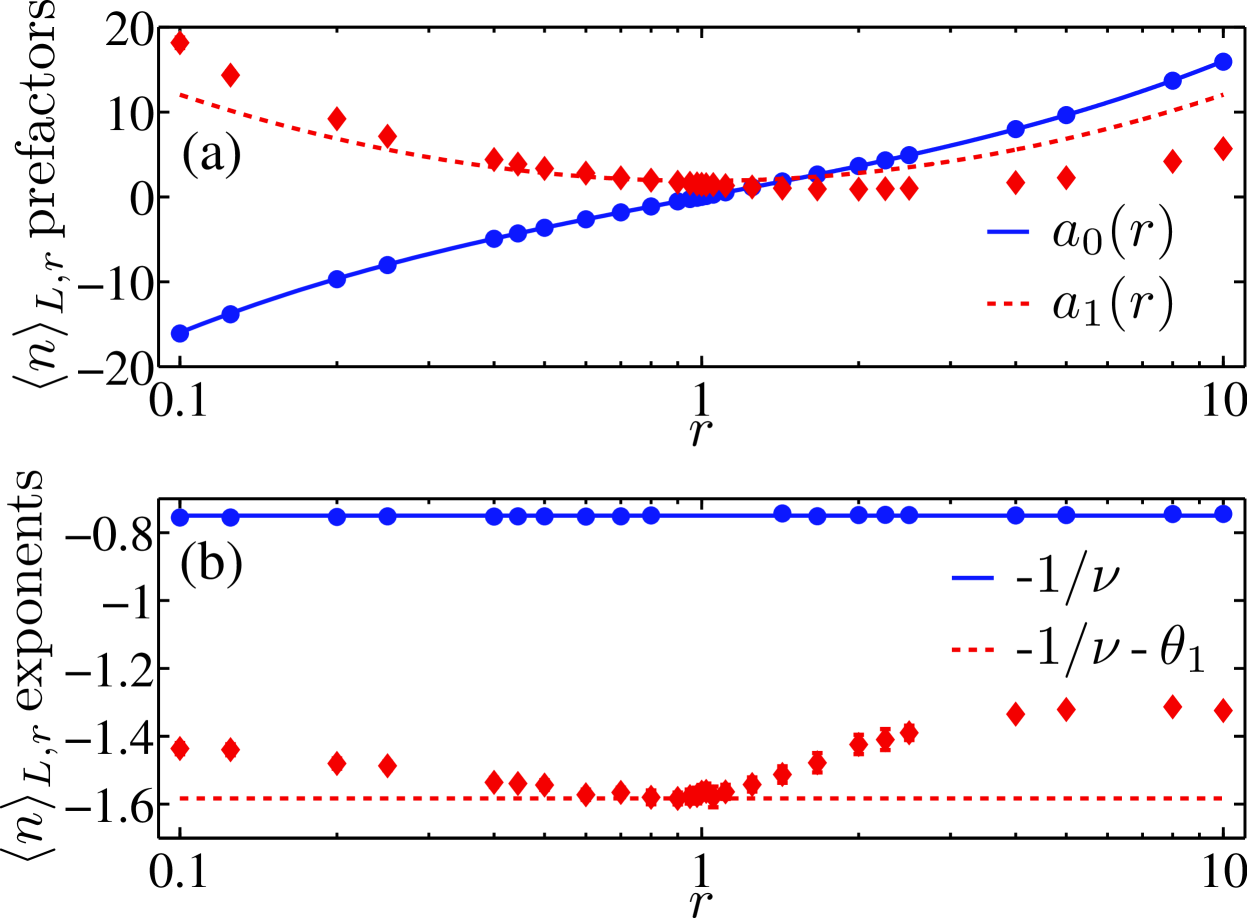
From Monte Carlo simulation data we have obtained the two leading-order terms of in Eq. (11) by interpolation, cf. Ref. my_1 . Results of the analysis are shown in Fig. 3. The zeroth-order prefactor is zero for symmetric system , and it is odd function on a logarithmic scale, i.e., . We have verified the obtained results by interpolation through symmetrizing data points . The fitting coefficients for prefactors are calculated using the least squares fitting methods and given in Table 1, cf. Fig. 3. Influence of higher order terms were comparable or smaller than simulation data error and we could not extract them with sufficient precision. For the first-order correction, we obtain for , cf. Ref. 1981_pla_Stauffer ; 1992_prl_Ziff . The residual aspect ratio dependence of cannot be further analyzed without provision of retaining the first two terms in Eq. (11). The system size where the average density reaches minimum is , cf. Eq. (11). For narrow systems, , diverges as as approaches one. For the first-order term is dominant.
| 0, 0 | 0, 1 | 1, 0 | 1, 1 | |
|---|---|---|---|---|
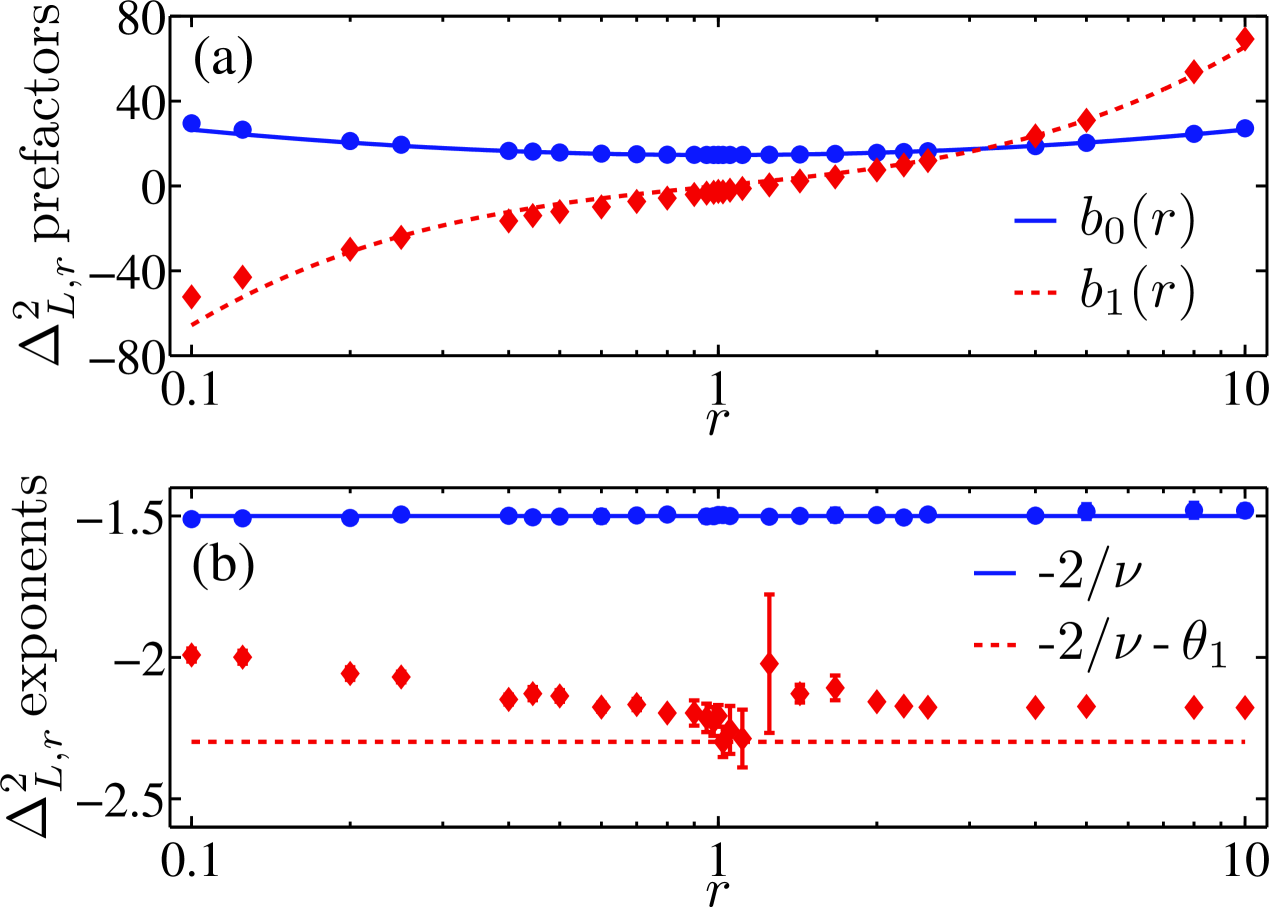
The variance prefactors and exponents for the two leading-order terms are shown in Fig. 4. The prefactors and exponents are obtained by fitting with the first two terms in Eq. (12), cf. Ref. my_2 . The fitting coefficients are given in Table 1 and obtained prefactor dependences on are given in Fig. 4. The zeroth-order prefactor of is even function on a logarithmic scale, i.e., , as one can see from a coarse observation of the percolation probability distribution function in Fig. 1. Asymmetry of the variance, i.e. , is the first-order effect, cf. Eq. (12).
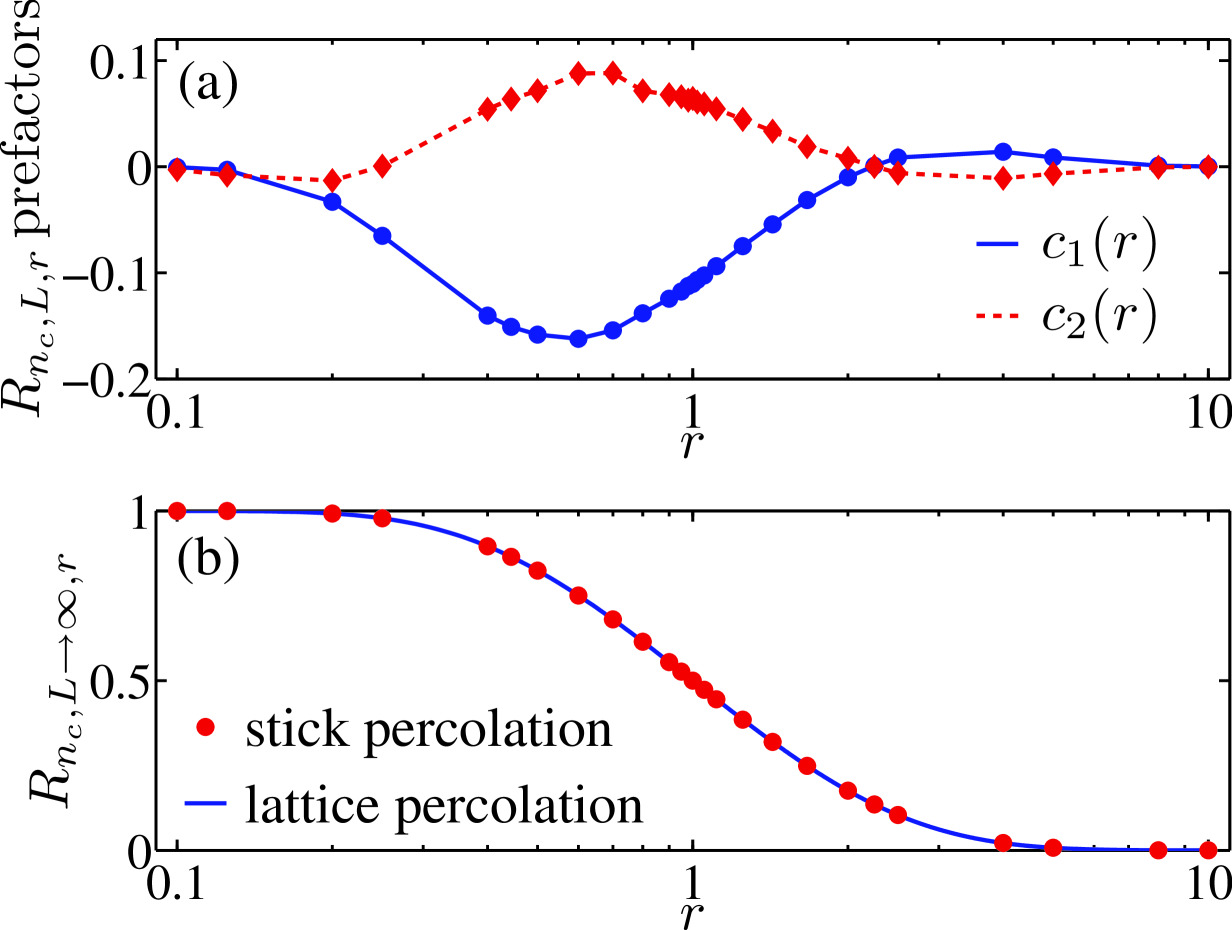
Finally, we investigate scaling behavior of percolation probability at the percolation threshold (), using the generalized scaling function , cf. Ref. 2002_pre_Ziff . The results for prefactors and are shown in Fig. 5. For two limiting cases ( and ), the prefactors are close to zero, what is consistent with behavior observed in Fig. 1. Between these two limiting cases, one can observe that both prefactors are close to zero for . Furthermore, at this aspect ratio, we could not observe existence of the higher order terms. This means that at the percolation threshold percolation probability is the same for all the systems, independent of system size , having the value . Scale invariance, i.e., is already seen and intuitively understood for bond percolation in symmetric systems, where is independent of system size , cf. Ref. 1978_prb_Bernasconi . The reason for observed system size invariance of percolation probability at the threshold in the asymmetric stick system is existence of multiple zero of at least second order at this point in universal scaling function. Regarding value of percolation probability at the percolation threshold of infinite system, we find that Cardy’s analytical model derived for the lattice percolation describes simulation data, cf. Fig. 5. The deviation between analytical value for lattice and Monte Carlo value for stick percolation is less than statistical error of the simulation data, i.e., less than . Percolation probability for 2D sticks system therefore satisfies .
V CONCLUSION
In summary, based on the analysis of finite size scaling in
continuum two-dimensional systems, the generalized scaling law is
introduced for average percolation density, variance, and
percolation probability at the percolation threshold. The
presented methodology could be used to model accurately these
properties for any percolating system. We find that the zeroth-order
prefactor of average percolation density is odd function with respect
to . This explains the faster convergence of average
percolation density for symmetric systems than expected from
general scaling arguments. We also observe that there is a
characteristic aspect ratio for which percolation probability at
the percolation threshold is system size independent. In addition,
for infinite system, we find that percolation probability at the
critical threshold density shows excellent agreement with the
Cardy’s prediction for lattice percolation. The presented results
confirm that continuum percolation belongs to the same
universality class as lattice percolation in the sense that value
of percolation probability at the threshold for infinitely large
systems is the same for lattice and continuum percolation. One
should note that a number of other features observed in this work
should be a common characteristic within the class, e.g.,
existence of the aspect ratio where the percolation probability at
the threshold is scale invariant and parity of the moments of the
percolation probability distribution function. This opens up the
question of the particle shape influence on prefactors, weather it is
possible to find systems where the observed behaviors are more
pronounced, and finally the question of the general form of the
prefactors for describing different systems.
Acknowledgements.
The authors acknowledge support by the Ministry of Science of the Republic of Serbia, under project No. ON171017. Numerical simulations were run on the AEGIS e-Infrastructure, supported in part by FP7 projects EGI-InSPIRE, PRACE-1IP, PRACE-2IP, and HP-SEE. The authors also acknowledge support received through SCOPES grant IZ73Z0–128169 of the Swiss National Science Foundation.References
- (1) R. Ramasubramaniam, J. Chen, and H. Liu, Appl. Phys. Lett. 83, 2928 (2003).
- (2) A. Trionfi, D. H. Wang, J. D. Jacobs, L.-S.Tan, R. A. Vaia, and J. W. P. Hsu, Phys. Rev. Lett. 102, 116601 (2009).
- (3) Y. Hazama, N. Ainoya, J. Nakamura, and A. Natori, Phys. Rev. B 82, 045204 (2010).
- (4) X.-Z. Bo, N. G. Tassi, C. Y. Lee, M. S. Strano, C. Nuckolls, G. B. Blanchet, Appl. Phys. Lett. 87, 203510 (2005).
- (5) V. K. Sangwan, A. Behnam, V. W. Ballarotto, M. S. Fuhrer, A. Ural, and E. D. Wiliams, Appl. Phys. Lett. 97, 043111 (2010).
- (6) J. Li, Z.-B. Zhang, M. Östling, S.-L. Zhang, Appl. Phys. Lett. 92, 133103 (2008).
- (7) S. Kumar, J.Y. Murthy, and M. A. Alam, Phys. Rev. Lett. 95, 066802 (2005).
- (8) L. Hu, D. S. Hecht, and G. Grüner, Nano Lett. 4, 2513 (2004).
- (9) Q. Cao, H.-S. Kim, N. Pimparkar, J. P. K., C. W., M. Shim, K. Roy, M. A. Alam, and J. A. Rogers, Nature 454, 495 (2008).
- (10) J. Li and S.-L. Zhang, Phys. Rev. B 79, 155434 (2009).
- (11) D. Stauffer, Phys. Lett. A 83, 404 (1981).
- (12) J. L. Cardy, J. Phys. A 25, L201 (1992).
- (13) R. M. Ziff, Phys. Rev. Lett. . 69, 2670 (1992).
- (14) A. Aharony and J.-P. Hovi, Phys. Rev. Lett. . 72, 1941 (1994).
- (15) J.-P Hovi and A. Aharony, Phys. Rev. E 53, 235 (1996).
- (16) M. E. J. Newman and R. M. Ziff, Phys. Rev. Lett. . 85, 4104 (2000).
- (17) R. M. Ziff and M. E. J. Newman, Phys. Rev. E 66, 016129 (2002).
- (18) D. Stauffer and A. Aharony, Introduction to Percolation Theory, 2nd revised ed. (Taylor and Francis, London, 2003).
- (19) G. E. Pike and C. H. Seager, Phys. Rev. B 10, 1421 (1974).
- (20) I. Balberg and N. Binenbaum, Phys. Rev. B 28, 3799 (1983).
- (21) I. Balberg, N. Binenbaum, and C. H. Anderson, Phys. Rev. Lett. 51, 1605 (1983).
- (22) I. Balberg, C. H. Anderson, S Alexander, and N. Wagner, Phys. Rev. B 30, 3933 (1984).
- (23) J. Bernasconi, Phys. Rev. B 18 2185 (1978).
- (24) M. E. J. Newman and R. M. Ziff, Phys. Rev. E . 64, 016706 (2001).
- (25) I. Stanković, M. Kröger and S. Hess, Comp. Physics Comm. 145, 371 (2002)
- (26) A. Balaž, O. Prnjat, D. Vudragović, V. Slavnić, I. Liabotis, E. Atanassov, B. Jakimovski and M. Savić, J. Grid. Comput. 9, 135 (2011).
- (27) J. Li and S.-L. Zhang, Phys. Rev. E . 80, 040104 (2009).
- (28) M. Plischke and B. Bergersen, Equilibrium Statistical Physics, 3rd ed., (World Scientific, Singapore, 2005).
- (29) In order to obtain with high precision successive slopes between points and 2002_pre_Ziff are calculated. The slope is defined as . This is approximately when . Therefore, successive slopes should fall on a straight line when plotted as a function of with intercept at . The intercept is not highly sensitive to the value of . Note that exponent can not be calculated using successive slopes if is close to zero.
- (30) The zeroth-order exponent for can be calculated using successive slopes for all because condition is always satisfied. The results for the zeroth-order terms are verified by interpolation through anti-symmetrizing data points .