Azimuthal modulation of cosmic ray flux as an effect of geomagnetic field
in the ARGO-YBJ experiment
Abstract
The geomagnetic field causes not only the East-West effect on the primary cosmic rays but also affects the trajectories of the secondary charged particles in the shower, causing their lateral distribution to be stretched along certain directions. Thus both the density of the secondaries near the shower axis and the trigger efficiency of a detector array decrease. The effect depends on the age and on the direction of the showers, thus involving the measured azimuthal distribution. Here the non-uniformity of the azimuthal distribution of the reconstructed events in the ARGO-YBJ experiment is deeply investigated for different zenith angles on the light of this effect. The influence of the geomagnetic field as well as geometric effects are studied by means of a Monte Carlo simulation.
Cosmic rays (CRs) are charged particles and their paths are deflected by the magnetic fields. The galactic magnetic field randomizes the CR arrival directions. The geomagnetic field restrains low-rigidity CRs from reaching the terrestrial atmosphere and causes that the CR flux is lower from East than from West. The geomagnetic field acts also on the charged particles of the extensive air showers (EAS) during their path of few kilometers in the atmosphere. Cocconi [1] suggested that the lateral displacement induced by the Earth magnetic field is not negligible with respect to the Coulomb scattering when the shower is young. Therefore the effect could increase for high altitude observations. In particular the shower extension along the East-West direction is larger than along the North-South direction (the opposite for the particle density). The different density of charged particles introduces an azimuthal modulation due to the different trigger efficiency of EAS detectors. This modulation was observed at the Yakutsk array for EAS with energy above [2] and at the Alborz observatory for energy above [3]. A North-South asymmetry has been observed also in EAS radio-experiments [4] and it can be explained as an effect of the geomagnetic Lorentz force on the EAS charged particles. Therefore the geomagnetic influence on the lateral distribution must be taken into account in the EAS simulation [5] and it was also suggested that a pointing correction is necessary for C̆erenkov telescopes because of the geomagnetic field [6].
The effect of the geomagnetic field on the trigger efficiency of the ARGO-YBJ experiment was studied and simulated [7]. Due to the field the average shift () of an electron (or positron) in the shower plane is
| (1) |
where is the angle between and the particle velocity , the electric charge, the average vertical height of the electron path, the average energy and the zenith angle. The trigger efficiency is connected to the size of the EAS footprint (lower particle density corresponds to lower trigger efficiency). Therefore the stretching of the EAS lateral distribution introduces a modulation with respect to the azimuth angle (). The azimuth distribution is expected to be
| (2) |
with ( is the azimuth of the geomagnetic field), and if the modulation is totally geomagnetic. Furthermore [7]
| (3) |
where is the zenith angle of the geomagnetic field.
1 ARGO-YBJ experiment
ARGO-YBJ is a full-coverage EAS experiment, located close to the YangBaJing village in Tibet (People’s Republic of China) at above sea level. Its geographical coordinates are and . The experiment is mainly devoted to Very High Energy (VHE) -astronomy and CR studies. The detector is essentially a continuous carpet () of Resistive Plate Counters. The detection area is enlarged to by means of a partially equipped guard ring. The time-space pattern allows a detailed reconstruction of showers induced by gamma and charged primaries.
In the ARGO-YBJ reference system the azimuth angle of EAS is defined with respect to the detector axes in the anticlockwise direction ( for showers aligned with the x-axis and moving towards the positive direction). Thus the azimuth angle of showers going towards the geographical North is . The quoted error is due to the measurement of the orientation of the detector axes with respect to the geographical reference system.
According to the International Geomagnetic Reference Field (IGRF) model available on the NOAA web site [8] at YangBaJing the geomagnetic field () has the following angular coordinates in the ARGO-YBJ reference system
| (4) |
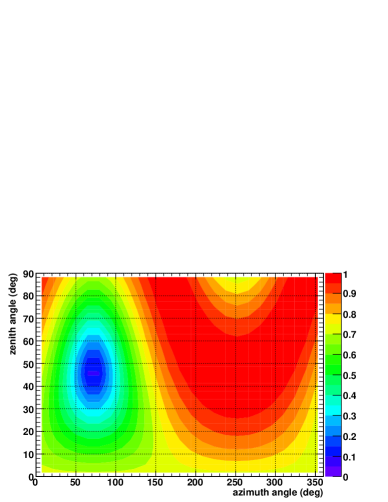
The geomagnetic effect on primary CRs is negligible for the EAS collected by ARGO-YBJ. Thus we focus on the effects on the secondary particles in the shower. The Lorentz force acting on charged particles depends on the angle used in Eq. (1). The absolute value of is shown in Fig. 1 as a function of and . It has been checked that the variation with the height is negligible. In fact from up to above sea level the product changes less than .
2 Data analysis
This analysis is based on the data collected in 3 days (October 12-14, 2010) with the trigger condition that at least 20 time-pixels (pads) are fired. In order to get a reliable reconstruction of the shower direction, the following cuts have been applied: shower core reconstructed inside a square of at the center of the carpet, zenith angle lower than . After these cuts millions of events are selected.
The timing calibration of the pads has been performed according to the Characteristic Plane method [9]. This procedure removes the systematic time differences and arranges the time correction in order to make null the mean value of the direction cosines. After this step a last premodulation correction is necessary in order to remove a small over-correction intrinsic to the method [10]. It is remarkable that small systematics in the timing calibration prevent the azimuthal analysis and the premodulation correction is crucial in order to get the proper -distribution.
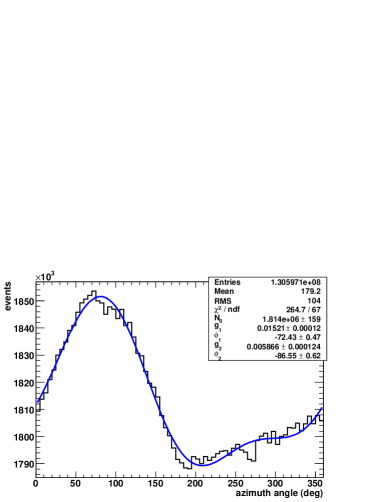
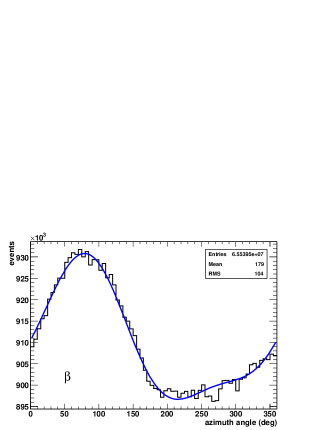
The azimuthal distribution is shown in Fig. 2 together with a fit performed according to function (2). and this is due to a small inefficiency at () which has not been examined here but does not invalidate this analysis. The fit results are
The first coefficient is 3 times higher than the second one. The phase of the first harmonic results fully compatible with what expected. This is not the case for the phase of the second harmonic.
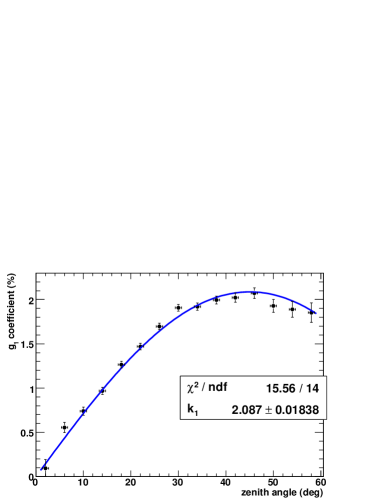
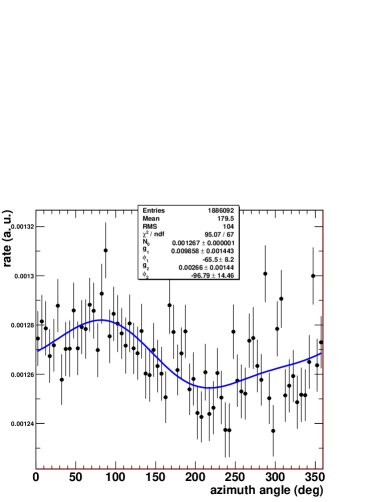
The geomagnetic origin of the modulation can be checked also by studying the dependence of the harmonic coefficients on the zenith angle. According to [7]
| (5) |
This behaviour is verified for (see the fit in Fig. 3), not for (the plot is missing for room saving).
The unexpected result for the second harmonic cannot be explained as a consequence of some systematic error. The disagreement can be solved simply assuming a mix of geomagnetic and detector effects. The periodicity of a detector effect must be and then acts only on the second harmonic, its phase must be or in connection with and -axes. The fit of Fig. 2 suggests the second solution because is in-between and .
In this hypothesis the second harmonic can be splitted in two parts: one () is due to the magnetic field, the other one () can be originated by a detector asymmetry. Three different data sets have been selected on the basis of the zenith value in order to disentagle these two effects. The -distributions of the 3 subsamples (, and in Fig. 4) can be fitted all together with a single function:
| (6) |
where the coefficients of the magnetic component are written using Eq.s (5), the magnetic phase is the same for first and second harmonic and the index indicates the subsamples. The quantities , and have been estimated separately for each subsample. Then the fit parameters are , , , , , and . The result of this new fit is reported in Tab. 1. The value of is compatible with the fit in Fig. 3. The ratio is compatible with 1.9, value calculated according to (3) and (4). The magnetic phase is in perfect agreement with the expectation (). It is remarkable that increases with and is compatible with as expected for a detector effect.
| (%) | |
|---|---|
| (%) | |
| (∘) | |
| (%) | |
| (%) | |
| (%) | |
| (∘) | |
| 491/209 |
A possible explanation of the detector origin of the harmonic is that the pads have a different density along the detector axes ( along -axis and along -axis). Taking into account the trigger requirement (at least 20 pads fired in a time-window of ) the different density can explain the higher trigger efficiency for showers along the -axis (). The increasing of the effect with the zenith angle is the expected consequence of this hypothesis.
In order to check the results for the first harmonic we observe according to function (6) that the mean values of the direction cosines and of the showers depend on and as in the following
In the analyzed sample the mean values are
As a consequence
These values are fully compatible with the the fit results in Tab. 1.
3 Simulation
Beams - In order to check the effect of the magnetic field on the data collection and on the EAS reconstruction, some ”beams” of primary protons have been simulated with , and interacting at of height. The Corsika code [11] has been used to simulate the shower development and a GEANT-based code [12] to reproduce the detector response. Nine different beams have been generated with 3 different values of the azimuth angle ( where , where is maximum and the intermediate angle ) and assuming 3 different values of the magnetic field (null, the effective magnetic field and twice the effective magnetic field). Negative and positive EAS components have been studied separately. It has been verified that the geomagnetic field separates positive and negative cores of about right on the East-West direction. This stretching of the lateral distribution does not affect the combined reconstruction (positive + negative component) but acts on the trigger efficiency, according to [7]. The results are summarized in Tab. 2 and confirm that the trigger efficiency decreases as the geomagnetic field or the value increase.
| 0.02 | ||||
|---|---|---|---|---|
| 0.87 | ||||
| 1.00 |
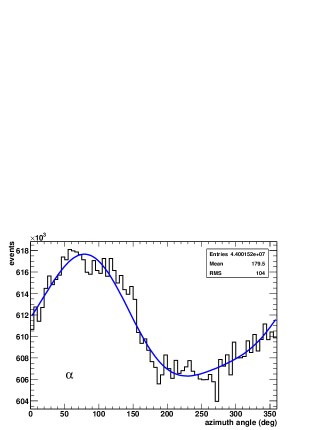
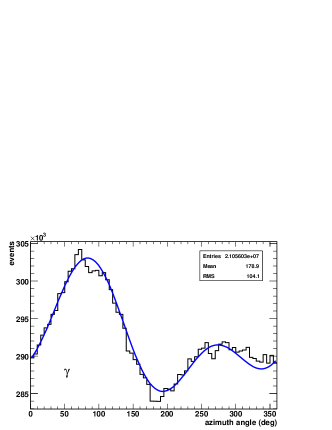
Complete sample - A sample of proton and helium-induced EAS has been simulated in the energy range , with a uniform azimuthal distribution and the proper geomagnetic field. The analysis chain of the real data has been applied to the simulated ones, with the exception of the timing calibration that is not necessary for simulated data. The azimuthal distribution of triggered and selected events () is not uniform (Fig. 5). The shape is similar to that of Fig. 2 and the parameters of the fit according to function (2) are almost compatible (the coefficients show larger discrepancies) but with large errors of the simulation fit. A larger simulation will be necessary in order to fix these few percent effects.
4 Conclusions
The modulation of the azimuthal distribution of a large EAS sample has been analyzed. The origin and the features of this modulation are fully understood. It is well described by means of two harmonics, the first one of the order of , the second one of the order of . The first harmonic is due to the geomagnetic Lorentz force on the shower charged particles. The second harmonic is the sum of magnetic and detector effects.
It is remarkable that in addition to the Moon shadow analysis the absolute pointing accuracy of EAS arrays could be tested also with deep studies concerning the azimuthal modulation.
References
- [1] G. Cocconi, Phys. Review, 1954, 93: 646-647. Erratum, Phys. Review, 1954, 95: 1705-1706
- [2] A.A. Ivanov et al., JETP Letters, 1999, 69: 288-293
- [3] M. Bahmanabadi et al., Experim. Astronomy, 2002, 13: 39-57. M. Khakian Ghomi et al., Proceedings of 30th Intern. Cosmic Ray Conference, Merida, 2007
- [4] D. Ardouin et al. (CODALEMA Collaboration), Astropart. Physics, 2009, 31: 192-200
- [5] A. Cillis, S.J. Sciutto, J. Phys. G: Nucl. Part. Physics, 2000, 26: 309-321
- [6] S.C. Commichau et al., Nuclear Instrum. Methods A, 2008, 595: 572-586
- [7] H.H. He et al., Proceedings of 29th Intern. Cosmic Ray Conference, Pune, 2005
- [8] www.ngdc.noaa.gov
- [9] H.H. He et al., Astropart. Physics, 2007, 27: 528-532
- [10] G. Aielli et al. (ARGO-YBJ Collaboration), Astropart. Physics, 2009, 30: 287-292
- [11] www-ik.fzk.de/corsika/
- [12] wwwasd.web.cern.ch/wwwasd/geant/