The Direct Detection of Cool, Metal-Enriched Gas Accretion onto Galaxies at
Abstract
We report on the discovery of cool gas inflow toward six star-forming galaxies with redshifts . Analysis of Mg II and Fe II resonance-line absorption in Keck/LRIS spectroscopy of this sample reveals velocity shifts of and equivalent widths for inflowing gas of Å in five of the six objects. The host galaxies exhibit a wide range in star formation rates (SFR ) and have stellar masses similar to that of the Milky Way (). Imaging from the Hubble Space Telescope Advanced Camera for Surveys indicates that five of the six galaxies have highly inclined (), disk-like morphologies. These data represent the first unambiguous detection of inflow into isolated, star-forming galaxies in the distant universe. We suggest that the inflow is due to the infall of enriched material from dwarf satellites and/or a galactic fountain within the galaxies. Assuming that the material has been enriched to and has a physical extent approximately equal to that of the galaxies, we infer mass inflow rates of for four of these systems. Finally, from comparison of these absorption lines to the profiles of Mg II and Fe II absorption in a larger spectroscopic sample of objects, we measure a covering fraction of cool inflow of at least , but cannot rule out the presence of enriched infall onto as many as of these galaxies.
Subject headings:
galaxies: ISM — galaxies: halos1. Introduction
The accretion of gas onto galaxies is regarded as a process fundamental to their formation (Larson, 1972; Rees & Ostriker, 1977) and is required to reconcile the limited cool gas supply in galactic disks with the cosmic star formation history (Kennicutt, 1983; Wong et al., 2004; Prochaska et al., 2005). Likewise, the star formation activity (; Robitaille & Whitney 2010) in the inner Milky Way will consume the available gas on timescales of Gyr, and can be maintained only if the local gas reservoir is replenished (Blitz, 1996). Recent semi-analytic and cosmological hydrodynamic simulations (Benson et al., 2003; Kereš et al., 2005, 2009; Dekel & Birnboim, 2006) suggest that the requisite baryons are delivered from the intergalactic medium (IGM) or low-mass satellites to high-redshift () galaxies via cool (temperature K) filaments of dense gas. At , these filaments are truncated in massive halos, but accretion in the form of dense, cold clouds persists.
In the Milky Way, the accretion of cool gaseous material in high velocity clouds (HVCs) such as the Magellanic Stream is observed directly in 21 cm emission at distances of kpc (Wakker 2001; Lockman et al. 2008; McClure-Griffiths et al. 2008; Lehner & Howk 2011). Previously-expelled material may be recycled to provide additional fuel for star formation (i.e., in a galactic fountain; Shapiro & Field 1976; Bregman 1980; Marasco et al. 2011), and likely gives rise to intermediate velocity clouds (IVCs) at distances kpc (Wakker, 2001; Bregman, 2009). In addition, nearby spirals exhibit both extraplanar H I clouds and morphological disturbances which may be attributed to gas infall (Sancisi et al., 2008). However, the emission from these diffuse structures is difficult to map beyond Mpc (Martin et al., 2010), and empirical evidence for gas accretion (or re-accretion) onto more distant galaxies is poignantly lacking.
Cool accreting gas which has been enriched to modest metallicities (i.e., ) may give rise to absorption in background light sources in rest-frame ultraviolet transitions such as Mg II or C IV . However, studies of cool gas absorption along the sightlines toward star-forming galaxies have instead reported the ubiquity of outflows at (Weiner et al., 2009; Rubin et al., 2010; Steidel et al., 2010). In one of the only studies showing evidence for inflows in distant systems, Sato et al. (2009) report redshifted Na I absorption in a sample of red, early-type objects, some of which exhibit line-emission from AGN activity. Due to the low ionization potential of the Na I ion (5.1 eV), however, HVC analogs rarely exhibit column densities (Ben Bekhti et al., 2008; Richter et al., 2011). The moderate resolution and S/N spectra of Sato et al. (2009) are therefore likely to be sensitive to clouds, which are typically found near (within kpc of) the Galactic disk (Wakker, 2001; Richter et al., 2011). Le Floc’h et al. (2007), Ribaudo et al. (2011) and Giavalisco et al. (2011) have also recently reported evidence for cool accretion from absorption line analysis, though the latter two detections are tentative.
The lack of evidence for the inflow phenomenon is hardly surprising given that the predicted covering factor of accreting gas is small (e.g., at ; Fumagalli et al., 2011). Further, as we will demonstrate, studies of cool gas kinematics in galaxy spectra are likely to identify inflows only if they achieve signal-to-noise (S/N) levels adequate for analysis of individual spectra, rather than coadded data. In this Letter, we report on high-S/N Keck/LRIS spectra of a sample of six star-forming galaxies at found to exhibit inflows traced by Mg II and/or Fe II absorption. We adopt a CDM cosmology with , , and . Magnitudes are given in the AB system.
2. Observations
Our galaxy sample is drawn from a larger, magnitude-limited () Keck/LRIS survey of cool gas kinematics in galaxies at redshifts (Rubin et al. 2011, in prep) located in fields imaged by the Hubble Space Telescope Advanced Camera for Surveys (HST/ACS; Giavalisco et al., 2004; Davis et al., 2007). We derive rest-frame magnitudes and colors from these data and complementary ground-based optical111www.cfht.hawaii.edu/Science/CFHTLS-DATA/ and near-IR photometry (Table 1; Kajisawa et al., 2011; Wuyts et al., 2008) using the code KCORRECT (Blanton & Roweis, 2007).
We obtained spectroscopy of this sample using the Low Resolution Imaging Spectrometer (LRIS) on Keck 1 (Cohen et al., 1994). We used slitlets, and collected between four and eight exposures with FWHM seeing between 2008 May 30 UT and 2009 April 3 UT. Our configuration of the two cameras with the 600/4000 grism, the 600/7500 grating, and the D560 dichroic provided FWHM and wavelength coverage Å. The data were reduced using the XIDL LowRedux222http://www.ucolick.org/xavier/LowRedux/ data reduction pipeline.
An iron-clad detection of inflow toward (or outflow from) a galaxy hinges on a precise and accurate determination of the systemic velocity. We derived redshifts for the galaxies by calculating the best-fit lag between observed spectra and a linear combination of SDSS galaxy eigenspectra. We prefer redshift measurements based on stellar absorption, as they better trace the systemic velocity of the associated ensemble of dark matter and stars. Therefore, where the stellar continuum S/N is adequate, we mask nebular emission lines in the data prior to redshift fitting. For EGS12027936, we adopt the redshift measured by the DEEP2 survey (Davis et al., 2003). From a detailed analysis of our full LRIS sample, we find an RMS redshift uncertainty of .
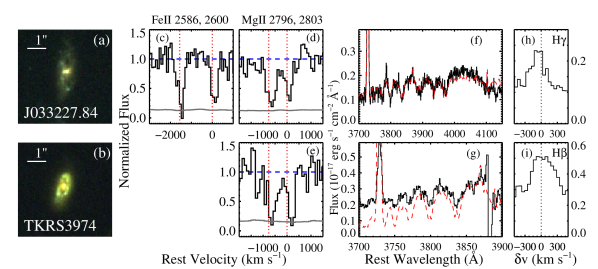
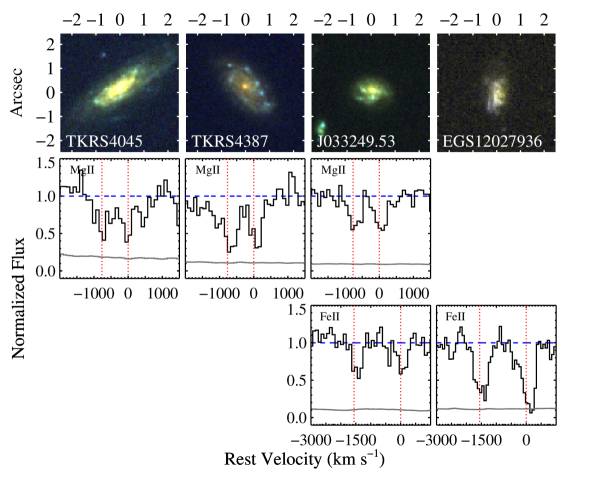
Figure 1 demonstrates the results of the eigenspectra fits for two galaxies in our inflow sample. Note the offset of the nebular emission (), which is indicative of a difference in the velocities and/or spatial distributions of stars and the interstellar medium (ISM) of these objects. Figure 2 presents the images and absorption spectra for the remaining “inflow” galaxies.
3. Absorption-Line Analysis
To assess the signatures of cool gas outflow and inflow, we analyze the line profiles of the Mg II and Fe II transitions in our spectra (Rubin et al. 2011, in prep). We construct two distinct models: (1) a single-component model which assumes a Gaussian profile (parameterized by a centroid, column density , and -value) with a covering fraction independent of velocity; and (2) a two-component model with one component fixed at systemic and having .
We assume that the likelihood function is given by the distribution for the model, and sample the posterior probability density function (PPDF) using the Multiple-Try Metropolis Markov Chain Monte Carlo technique (Liu et al., 2000) as implemented in ROOT/RooFit, an object-oriented framework written in C++ (Brun & Rademakers, 1997). Our code calculates the marginalized PPDF for each parameter and the equivalent width (EW) of the model absorption lines.
This analysis has been implemented for our full spectroscopic sample. While the majority of galaxies exhibit significantly blueshifted absorption indicative of outflows, the model fits for six galaxies indicate redshifted absorption with high probability. That is, of the marginalized PPDF for the one-component model lies at () for both Mg II and Fe II profiles where coverage is available. Table 1 reports and the fitted velocity offsets () and EW for the one-component and two-component models, subscripted with “1” and “2”, respectively.
4. Analysis of the Galaxies
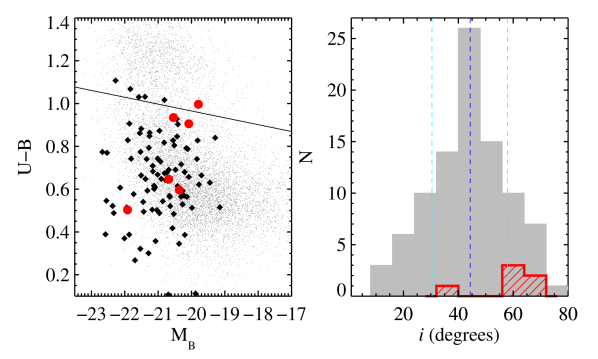
Figure 3 shows the rest-frame colors and magnitudes of our six inflow galaxies (large red circles) and the parent spectroscopic sample (black diamonds; Rubin et al. 2011, in prep). The inflow and parent samples occupy similar areas of the diagram. Three inflow objects lie in the blue cloud, and have star formation rates (SFRs) and stellar masses (Table 1). The remaining (redder) objects have low SFRs () and lie in the green valley between the red sequence and the blue cloud. Because these latter galaxies have disk-like rather than disturbed or early-type morphologies it is likely that these objects appear in the green valley due to enhanced dust reddening and their relatively modest SFRs, rather than the sudden cessation of star formation. Further, the HST/ACS imaging of these objects suggests the presence of several compact, star-forming knots in the outskirts of the galactic disks. Taken together, the stellar masses (), SFRs, optical colors and morphologies of these three galaxies indicate that they are close analogs to the Milky Way, while the higher-SFR subset of the inflow sample has slightly lower stellar masses and more diffuse morphologies.
The distribution of inclinations measured from standard SExtractor analysis (Bertin & Arnouts, 1996) among the parent spectroscopic sample (gray) is compared with that of the inflow sample (red) on the right side of Figure 3. All but one of the six inflow galaxies are highly inclined (having ). The Kolmogorov-Smirnov (K-S) test indicates only a 1.1% probability that the inflow and parent populations are drawn from the same distribution. Five out of six inflow objects have inclinations close to (within ) or greater than the 84th-percentile value of inclination in the larger sample.
5. Discussion
We have discovered a small sample of late-type, highly inclined, star-forming galaxies having SFRs over a wide range whose spectra show evidence for redshifted cool gas absorption. We interpret these kinematics as evidence for gaseous infall and discuss these findings in the context of galaxy formation models below, but first critique alternative explanations. If a galaxy’s motions are dominated by rotation, the ISM absorption may appear offset from the systemic velocity for an asymmetric gas distribution. Because this inflow galaxy sample is nearly edge-on, we are particularly sensitive to velocity offsets in the direction of rotation. Weiner et al. (2006) analyzed line emission in two-dimensional spectra of two of these objects, finding line-of-sight terminal rotation velocities of and for TKRS4045 and TKRS4387, respectively. In an extreme scenario in which all Mg II-absorbing ISM is located on only the receding side of these galaxies (and therefore has ), it may appear to be offset in velocity by from the stellar absorption. While most of our measured inflow velocities are much larger than , TKRS4387 has a of only . However, given the velocity resolution and S/N of our spectra, we would be unlikely to detect this absorption unless it covers well over half () of the galaxy continuum (i.e., unless the profile is sufficiently deep). A spurious inflow signature could additionally result from an error in our determination of the galaxy systemic velocities due to, e.g., a spatial offset between our slitlets and the centroid of the stellar continuum emission, such that the galaxy spectra are dominated by light from the approaching part of the disks. However, most of the galaxies have diameters , and a slit width was used in seeing conditions; in addition, this scenario would yield an artificial inflow velocity of only and in the cases of TKRS4045 and TKRS4387. We therefore adopt the interpretation that the absorption arises from metal-enriched gas flowing toward each galaxy from the IGM, as part of an accreting satellite, or from recycled wind material circulating in a galactic fountain.
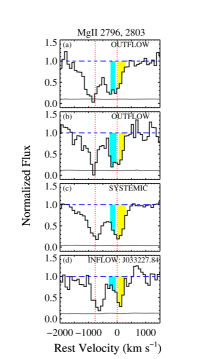
At the most conservative level, the detection of six galaxies with inflows in a sample of 101 (with sufficient S/N) implies a covering fraction of such material of . This estimate should be considered a firm lower limit, however. These six galaxies are unique not for the presence of strong absorption redward of systemic velocity, but instead for the absence of strong, blueshifted absorption. Figure 4 shows Mg II line profiles for one object in our inflow sample (bottom panel) and three other objects drawn from the parent LRIS sample. A by-eye analysis (and our fitting results) suggests that profiles (a) and (b) exhibit outflows; i.e., they show an excess of absorption blueward of systemic velocity. Profile (c) is symmetric and dominated by absorption at systemic velocity. However, all of these profiles have similar Mg II EWs ( Å) redward of systemic velocity (yellow), and thus could easily be tracing significant amounts of gas moving toward the host galaxies at . The difference in the measured kinematics is due to the differences in EWs at systemic velocity and blueward (cyan); i.e., profiles (a-c) have blueward EWs at least 0.5 Å larger than the profile from the inflow sample (d). We are therefore sensitive to inflows only in the absence of strong outflows, and are likely missing instances of cool accretion in our larger parent sample.
For instance, the fraction of the parent sample with Fe II or Mg II EWs at least as large as those measured for our inflow sample in the velocity range (0.61 and 0.74 Å, respectively) is 26 - 47%. Furthermore, 23% of the parent sample has Mg II EWs Å in the velocity range (i.e., at least as large as the EWs for those inflow galaxies with ). We therefore suspect the presence of inflow traced by saturated metal-line absorption in up to of our parent sample, and suggest that it is likely occurring in at least of the galaxies. Finally, we note that due to the low frequency of detected inflows in individual spectra, the observed inflow signatures would likely be completely obscured in coadds of the parent sample (or subsamples thereof), similar to the composite spectra analyzed in Steidel et al. (2010).
Our observations provide almost no constraint on the distance between this inflowing gas and the galaxies or on the spatial distribution of the gaseous material. However, the large model values () suggest that the material extends at minimum to sizes of order the size of the stellar disks (listed in Table 1). In cases with high values of , we use the derived velocities and column densities to estimate a rough mass inflow rate. We assume that the absorbing gas has a surface area given by , where is the average of the galaxy semi-major and semi-minor axes, and that the gas will accrete onto the galaxy with a timescale . Neglecting ionization corrections, dust depletion, and assuming metallicities , we find mass inflow rates (Table 1). The values are slightly lower than the SFRs of the low-SFR half of the sample, and about an order of magnitude lower than the SFRs in the remaining galaxies. The inflow rates are also consistent with mass inflow rates derived for the Milky Way (; Bregman 2009, Lehner & Howk 2011, submitted).
Given the strength of the metal-line absorption, the observed inflows are unlikely to arise from the “cold flows” which are invoked to provide pristine hydrogen to star-forming galaxies from the IGM (Fumagalli et al., 2011). Instead, this gas may have been enriched by star formation in satellite dwarf galaxies, or may have already cycled through the host galaxy’s ISM. IVCs and HVCs in our own Galaxy could easily give rise to the inflow signatures observed in our sample, as they have a wide range of velocities (up to ) and are mostly optically thick in H I with metallicities (Wakker, 2001). The cosmological hydrodynamic simulations of Oppenheimer et al. (2010) suggest that the recycling of gas blown out by winds is the dominant mode of accretion in halos with masses above at , with recycling times Gyr. Further, detailed simulations of individual galaxy halos show that accretion occurs in the plane of the galactic disk, rather than along the minor axis (Stewart et al. 2011; Shen et al. 2011, Ménard & Murray 2011, in prep). Winds vent out of the galaxy along the path with the lowest ambient gas pressure, i.e., the minor axis, preventing accretion from occurring in locations other than along the disk plane. While we have not ruled out the presence of infall onto galaxies along their minor axes, results from these simulations are fully consistent with our detection of inflows along the line-of-sight toward several highly-inclined, disk-dominated galaxies.
These results highlight the importance of analysis of cool gas kinematics in distant galaxies on an individual basis. Only through examination of absorption line profiles for a large sample of objects were a handful of examples of cool gas accretion, a process fundamental to galaxy formation, identified. At the same time, these spectra provide only a cursory view of the complexities of gas infall and recycling. Studies of gas kinematics at higher spectral resolution (e.g., Pettini et al., 2001; Dessauges-Zavadsky et al., 2010) and in large galaxy samples are needed to achieve tighter constraints on the frequency of inflows and the concurrent action of outflows and inflows. Equally propitious are studies of cool gas abundances along sightlines to background QSOs that may differentiate between pristine gas accreted from the IGM and material that has been previously recycled (Ribaudo et al., 2011). The combination of these experiments in studies of individual halos will in turn enable the simultaneous mapping of gas abundances and kinematics relative to the host galaxies. In concert with hydrodynamic simulations that track the accretion, expulsion, and recycling of gas, these observations will provide unprecedented insight into the processes regulating galaxy growth.
References
- Ben Bekhti et al. (2008) Ben Bekhti, N., Richter, P., Westmeier, T., & Murphy, M. T. 2008, A&A, 487, 583
- Benson et al. (2003) Benson, A. J., Bower, R. G., Frenk, C. S., Lacey, C. G., Baugh, C. M., & Cole, S. 2003, ApJ, 599, 38
- Bertin & Arnouts (1996) Bertin, E., & Arnouts, S. 1996, A&AS, 117, 393
- Blanton & Roweis (2007) Blanton, M. R., & Roweis, S. 2007, AJ, 133, 734
- Blitz (1996) Blitz, J. 1996, 25 Years of Millimeter Wave Spectroscopy, ed. Latter, W. B., Radford, S. J. E., Jewell, P. R., Mangum, J. G. & Bally, J.
- Bregman (1980) Bregman, J. N. 1980, ApJ, 236, 577
- Bregman (2009) —. 2009, ArXiv e-prints
- Brun & Rademakers (1997) Brun, R., & Rademakers, F. 1997, Nuclear Instruments and Methods in Physics Research A, 389, 81
- Bundy et al. (2006) Bundy, K., et al. 2006, ApJ, 651, 120
- Cohen et al. (1994) Cohen, J. G., Cromer, J., & Southard, Jr., S. 1994, in Astronomical Society of the Pacific Conference Series, Vol. 61, Astronomical Data Analysis Software and Systems III, ed. D. R. Crabtree, R. J. Hanisch, & J. Barnes, 469–+
- da Cunha et al. (2008) da Cunha, E., Charlot, S., & Elbaz, D. 2008, MNRAS, 388, 1595
- Davis et al. (2003) Davis, M., et al. 2003, in Society of Photo-Optical Instrumentation Engineers (SPIE) Conference Series, Vol. 4834, Society of Photo-Optical Instrumentation Engineers (SPIE) Conference Series, ed. P. Guhathakurta, 161–172
- Davis et al. (2007) Davis, M., et al. 2007, ApJ, 660, L1
- Dekel & Birnboim (2006) Dekel, A., & Birnboim, Y. 2006, MNRAS, 368, 2
- Dessauges-Zavadsky et al. (2010) Dessauges-Zavadsky, M., D’Odorico, S., Schaerer, D., Modigliani, A., Tapken, C., & Vernet, J. 2010, A&A, 510, A26+
- Fumagalli et al. (2011) Fumagalli, M., Prochaska, J. X., Kasen, D., Dekel, A., Ceverino, D., & Primack, J. R. 2011, ArXiv e-prints
- Giavalisco et al. (2004) Giavalisco, M., et al. 2004, ApJ, 600, L93
- Giavalisco et al. (2011) —. 2011, ArXiv e-prints
- Kajisawa et al. (2011) Kajisawa, M., et al. 2011, PASJ, 63, 379
- Kennicutt (1983) Kennicutt, Jr., R. C. 1983, ApJ, 272, 54
- Kereš et al. (2009) Kereš, D., Katz, N., Fardal, M., Davé, R., & Weinberg, D. H. 2009, MNRAS, 395, 160
- Kereš et al. (2005) Kereš, D., Katz, N., Weinberg, D. H., & Davé, R. 2005, MNRAS, 363, 2
- Larson (1972) Larson, R. B. 1972, Nature, 236, 21
- Le Floc’h et al. (2007) Le Floc’h, E., et al. 2007, ApJ, 660, L65
- Liu et al. (2000) Liu, J., Liang, F., & Wong, W. H. 2000, Journal of the American Statistical Association, 95, 449
- Lockman et al. (2008) Lockman, F. J., Benjamin, R. A., Heroux, A. J., & Langston, G. I. 2008, ApJ, 679, L21
- Marasco et al. (2011) Marasco, A., Fraternali, F., & Binney, J. J. 2011, ArXiv e-prints
- Martin et al. (2010) Martin, A. M., Papastergis, E., Giovanelli, R., Haynes, M. P., Springob, C. M., & Stierwalt, S. 2010, ApJ, 723, 1359
- McClure-Griffiths et al. (2008) McClure-Griffiths, N. M., et al. 2008, ApJ, 673, L143
- Oppenheimer et al. (2010) Oppenheimer, B. D., Davé, R., Kereš, D., Fardal, M., Katz, N., Kollmeier, J. A., & Weinberg, D. H. 2010, MNRAS, 406, 2325
- Pettini et al. (2001) Pettini, M., Shapley, A. E., Steidel, C. C., Cuby, J.-G., Dickinson, M., Moorwood, A. F. M., Adelberger, K. L., & Giavalisco, M. 2001, ApJ, 554, 981
- Prochaska et al. (2005) Prochaska, J. X., Herbert-Fort, S., & Wolfe, A. M. 2005, ApJ, 635, 123
- Rees & Ostriker (1977) Rees, M. J., & Ostriker, J. P. 1977, MNRAS, 179, 541
- Ribaudo et al. (2011) Ribaudo, J., Lehner, N., Howk, J. C., Werk, J. K., Tripp, T. M., Prochaska, J. X., Meiring, J. D., & Tumlinson, J. 2011, ArXiv e-prints
- Richter et al. (2011) Richter, P., Krause, F., Fechner, C., Charlton, J. C., & Murphy, M. T. 2011, A&A, 528, A12+
- Robitaille & Whitney (2010) Robitaille, T. P., & Whitney, B. A. 2010, ApJ, 710, L11
- Rubin et al. (2010) Rubin, K. H. R., Weiner, B. J., Koo, D. C., Martin, C. L., Prochaska, J. X., Coil, A. L., & Newman, J. A. 2010, ApJ, 719, 1503
- Sancisi et al. (2008) Sancisi, R., Fraternali, F., Oosterloo, T., & van der Hulst, T. 2008, A&A Rev., 15, 189
- Sato et al. (2009) Sato, T., Martin, C. L., Noeske, K. G., Koo, D. C., & Lotz, J. M. 2009, ApJ, 696, 214
- Shapiro & Field (1976) Shapiro, P. R., & Field, G. B. 1976, ApJ, 205, 762
- Shen et al. (2011) Shen, S., Madau, P., Aguirre, A., Guedes, J., Mayer, L., & Wadsley, J. 2011, ArXiv e-prints
- Steidel et al. (2010) Steidel, C. C., Erb, D. K., Shapley, A. E., Pettini, M., Reddy, N. A., Bogosavljević, M., Rudie, G. C., & Rakic, O. 2010, ArXiv e-prints
- Stewart et al. (2011) Stewart, K. R., Kaufmann, T., Bullock, J. S., Barton, E. J., Maller, A. H., Diemand, J., & Wadsley, J. 2011, ArXiv e-prints
- Wakker (2001) Wakker, B. P. 2001, ApJS, 136, 463
- Weiner et al. (2009) Weiner, B. J., et al. 2009, ApJ, 692, 187
- Weiner et al. (2006) —. 2006, ApJ, 653, 1027
- Willmer et al. (2006) Willmer, C. N. A., et al. 2006, ApJ, 647, 853
- Wirth et al. (2004) Wirth, G. D., et al. 2004, AJ, 127, 3121
- Wong et al. (2004) Wong, T., Blitz, L., & Bosma, A. 2004, ApJ, 605, 183
- Wuyts et al. (2008) Wuyts, S., Labbé, I., Schreiber, N. M. F., Franx, M., Rudnick, G., Brammer, G. B., & van Dokkum, P. G. 2008, ApJ, 682, 985
| TKRS3974 | TKRS4045 | TKRS4387 | EGS12027936 | J033249.5 | J033227.8 | ||
|---|---|---|---|---|---|---|---|
| Galaxy Properties | |||||||
| Right Ascension | 12:37:01.65 | 12:36:39.70 | 12:36:54.99 | 14:19:26.49 | 03:32:49.52 | 03:32:27.83 | |
| Declination | +62:18:14.3 | +62:15:26.1 | +62:16:58.2 | +52:46:09.4 | -27:46:29.9 | -27:55:48.8 | |
| z aaEstimated statistical and systematic uncertainty is . The redshift of EGS12027936 was determined by the DEEP2 Survey, which reports a redshift uncertainty of (Weiner et al., 2009). | 0.43708 | 0.37687 | 0.50334 | 1.03847 | 0.52313 | 0.66424 | |
| (mag) | -20.90 | -20.61 | -21.36 | -22.74 | -21.19 | -21.50 | |
| (mag) | 0.91 | 1.00 | 0.93 | 0.50 | 0.60 | 0.65 | |
| (kpc) | 3.2 | 5.1 | 4.7 | 3.9 | 2.6 | 5.2 | |
| (arcsec) | 0.6 | 1.0 | 0.8 | 0.5 | 0.4 | 0.7 | |
| (deg) | 56.8 | 67.3 | 57.2 | 56.6 | 38.1 | 67.2 | |
| () | |||||||
| Transition | Inflow Measurementsbb“N/C” (for “not constrained”) is used in cases for which less than 95% of the PPDF for the velocity offset lies at (i.e., ). Measurements subscripted with “1” refer to results from one-component model fitting (§3). Measurements subscripted with “2” report two-component model results, except in cases with , where they list the EW of absorption measured in the velocity range . Errors report the probability intervals on each quantity. | ||||||
| Mg II 2796, 2803 | |||||||
| () | |||||||
| () | |||||||
| () | N/C | ||||||
| () | |||||||
| () | N/C | ||||||
| () | 0.69 | N/C | 0.24 | 0.00030 | 0.29 | ||
| Fe II 2586, 2600 | |||||||
| () | |||||||
| () | |||||||
| () | N/C | ||||||
| () | |||||||
| () | N/C | ||||||
| () | 1.9 | N/C | 2.8 |
Note. — Galaxies are named according to ID numbers listed in Wirth et al. (2004, TKRS), the AEGIS survey (Davis et al., 2007, EGS), and Giavalisco et al. (2004, J0332…). SFRs and s are calculated by fitting model spectral energy distributions to the broad-band photometry listed in §2 along with the photometry of Bundy et al. (2006) using the code MAGPHYS (da Cunha et al., 2008).