Present ]address: Laboratory of Reactor Physics ad Systems Behaviour, Paul Scherrer Institut, CH-5232 Villigen PSI, Switzerland
Phonon spectrum, thermal expansion and heat capacity of UO2 from first-principles
Abstract
We report first-principles calculations of the phonon dispersion spectrum, thermal expansion, and heat capacity of uranium dioxide. The so-called direct method, based on the quasiharmonic approximation, is used to calculate the phonon frequencies within a density functional framework for the electronic structure. The phonon dispersions calculated at the theoretical equilibrium volume agree well with experimental dispersions. The computed phonon density of states (DOS) compare reasonably well with measurement data, as do also the calculated frequencies of the Raman and infrared active modes including the LO/TO splitting. To study the pressure dependence of the phonon frequencies we calculate phonon dispersions for several lattice constants. Our computed phonon spectra demonstrate the opening of a gap between the optical and acoustic modes induced by pressure. Taking into account the phonon contribution to the total free energy of UO2 its thermal expansion coefficient and heat capacity have been ab initio computed. Both quantities are in good agreement with available experimental data for temperatures up to about 500 K.
pacs:
63.20.dk, 65.40.Ba, 65.40.DeI Introduction
Over the last few decades UO2 has been one of most widely studied actinide oxides due to its technological importance as standard fuel material used in nuclear reactors. There exists currently considerable interest in understanding the behavior of nuclear fuel in reactors which is a complex phenomenon, influenced by a large number of materials’ properties, such as thermomechanical strength, chemical stability, microstructure, and defects. Especially, knowledge of the fuel’s thermodynamic properties, such as specific heat, thermal expansion, and thermal conductivity, is essential to evaluate the fuel’s performance in nuclear reactors.Ronchi07HiTe ; Fink00JNM ; Carbajo01JNM ; Kang06IJT ; yunMRS11 These thermodynamic quantities are directly related to the lattice dynamics of the fuel material.Bouchet07JAC ; Yamada00JAC ; watanabe08
Dolling et al. Dolling65CJP were the first to measure phonon dispersion curves of UO2, using the inelastic neutron scattering technique in 1965; their seminal article has become the standard reference for uranium dioxide’s phonon spectrum. Later the vibrational properties of UO2 were investigated in detail by Schoenes,Schoenes80 using infrared and Raman spectroscopic techniques. A good agreement with phonon frequencies obtained from inelastic neutron scattering was observed. Schoenes80 More recently, Livneh and Sterer Livneh06 studied the influence of pressure on the Raman scattering in UO2 and Livneh Livneh08JPCM demonstrated the resonant coupling between longitudinal optical (LO) phonons and U4+ crystal field excitations in a Raman spectroscopic investigation. A theoretical investigation of the phonon spectra of UO2 was reported recently by Yin and Savrasov Yin08PRL who employed a combination of a density-functional-theory (DFT) based technique and a many-body approach. According to their results, the low thermal conductivity of UO2 stems from the large anharmonicity of the LO modes resulting in no contribution from these modes in the heat transfer. Goel et al. goel07 ; Goel08JNM investigated the phonon properties of UO2 using an empirical interatomic potential based on the shell model and observed that the calculated thermodynamic properties including the specific heat are in good agreement with available experimental data. Devey Devey11 employed recently the generalized gradient approximation with additional Coulomb (GGA+) to compute the main phonon mode frequencies at the Brillouin zone center which were in reasonable agreement with experimental data. Very recently, Sanati et al.sanati11 used the GGA and GGA+ approaches to investigate phonon density of states and elastic and thermal constants, which were found to be in reasonably good agreement with experimental data. In spite of the already performed studies, further investigations are needed. Especially, the full dispersions of the phonons in reciprocal space have not yet been considered. Also, important quantities such as the thermal expansion coefficient and heat capacity are directly related to the lattice vibrations but these quantities have not yet been studied ab initio from the calculated phonon spectrum.
The objective of this study is to contribute to a detailed understanding of the lattice vibrations of UO2. Using the first-principles approach, based on the DFT we have calculated phonon dispersion curves and phonon density of states of UO2. The calculated phonon properties are compared with the available experimental data from inelastic neutron scattering and Raman spectroscopy along with a detailed discussion. Furthermore, several thermodynamic properties have been computed taking the influence of lattice vibrations into account. Here, we report the lattice contribution to the heat capacity as function of temperature as well as temperature and volume (in the quasiharmonic approximation). The dependence of the total free energy on the lattice constant of UO2 as a function of temperature has calculated, from which we derive the thermal expansion coefficient. The thermal expansion coefficient as well as lattice heat capacity compare favorably to available experimental data up to 500 K, which is the temperature range in which the influence of anharmonicity can be neglected.
II Computational Methodology
The electronic structure of UO2 has been discussed in the past years. SDudarev97Phil ; crocombette01 ; RLaskowski04PRB ; KKudin02PRL ; prodan07 ; roy08 ; dorado09 ; dorado10 ; petit10 ; Yun11 DFT calculations within the generalized gradient approximation (GGA) underestimate the influence of the strong on-site Coulomb repulsion between the electrons. An improved electronic structure description can be obtained with the GGA+ approach, in which a supplementary on-site Coulomb repulsion term is added; this approach correctly gives the electronic band gap of UO2.SDudarev97Phil ; prodan07 ; SDudarev98PhysStat ; Yun05NET ; Yun07KPS While the GGA+ approach would appear preferable for description of UO2’s electronic structure, we encountered specific problems when using this method. Some of the phonon branches became negative away from the zone center. This artifact might be related to the occupation matrix of states that would require an additional stabilizing constraint in the GGA+ method.dorado09 ; dorado10 Using conversely the spin-polarized GGA approach, we found that such difficulties did not occur. The phonon dispersion spectrum presented below is hence computed with the GGA exchange-correlation for antiferromagnetically ordered UO2 and is found to be in good agreement with experiment.Dolling65CJP
Here, we have determined the phonon dispersion curves and density of states (DOS) in the quasiharmonic approximation using the direct method. Parlinski00PRB ; Parlinski03code By displacing one atom in a supercell (of 96 atoms) from its equilibrium position, non-vanishing Hellmann-Feynman forces were generated. Due to the high symmetry of the face-centered cubic (fcc) lattice of UO2, only one atom for uranium (U) and for oxygen (O) was needed to be displaced. The actual shift of the atoms in the supercell had an amplitude of 0.03 Å and was taken along the [001] direction only, on account of the cubic symmetry of UO2. In the calculation of the resulting forces we employed the projector augmented wave (PAW) pseudopotential approach within the Vienna Ab-initio Simulation Package (VASP).GKresse93PRB ; GKresse96PRB The PHONON code Parlinski00PRB ; Parlinski03code has been used to extract the force constant matrix from the Hellmann-Feynman forces and to subsequently calculate the phonon dispersion curves and DOS.
For the thermodynamic quantities we consider the total free energy of UO2, including the phonon contribution,
| (1) |
where is the Helmholtz free energy at a given strain . The phonon free energy contribution is expressed as
| (2) | |||||
where is the phonon DOS, computed as mentioned above. We note that the free electronic energy, , is not considered in the present study, because the thermal electronic contribution is known to be negligible in the temperature range up to 1000 K, which is the range of interest in this work.Sindzingre88 ; Zhang10 The static lattice energy ) appearing in Eq. (1) can be expressed as
| (3) |
where is the static lattice energy at zero strain, are the elastic constants, and is the equilibrium volume at K. The static lattice energies have also been calculated using the VASP code.GKresse93PRB ; GKresse96PRB
In our calculations we have used a 222 supercell containing 96 atoms with a 444 -point mesh in the Brillouin zone (BZ). The Perdew-Wang parametrizationperdew92 of the GGA functional was used. The kinetic energy cut-off for the plane waves was set at 600 eV and the energy criterion used for convergence was 10-7 eV. The force acting on each ion was converged until less than 0.01 eV/Å. Once the phonon DOS has been calculated, the thermal expansion of UO2 can be evaluated straightforwardly. First, the phonon DOS with static lattice energy is calculated for several volumes around the K equilibrium volume. Subsequently, the total free energies are calculated for these different volumes at constant temperature using Eqs. (1)-(3). After the free energy has been calculated its minimum gives the corresponding equilibrium volume at the considered temperature. By repeating the process for different temperatures, the thermal expansion coefficient defined by
| (4) |
is obtained; here is the lattice constant.
A further thermodynamic quantity, the lattice contribution to the specific heat can be derived from at a fixed temperature in the quasiharmonic approximation.
III Results and Discussion
III.1 Ground-state properties of UO2
UO2 crystallizes in the cubic fluorite structure (CaF2) belonging to the space group (no. 225) and there are three atoms per primitive unit cell with one U atom (Wyckoff position ) and two inequivalent O atoms (Wyckoff positions ). Therefore, there are generally nine phonon branches. Before turning to the description and analysis of the calculated lattice dynamics let us briefly consider the ground-state properties of UO2. As mentioned above the employed DFT framework is that of the spin-polarized GGA. The calculated equilibrium lattice constant a and bulk modulus B, which we have obtained by a Birch-Murnaghan order fit,Birch47 are presented in Table 1, where these are compared to experimental lattice properties.benedict82 ; Hutchings87 ; Yamada97 ; idiri04 Our calculated equilibrium volume as well as the bulk modulus compare reasonably well with the experimental data and with results from molecular dynamics simulations.Yamada00JAC ; watanabe08 Compared to the experimental lattice constant the lattice constant computed here is 1.2% smaller. This can be attributed to a too strong binding of the orbitals which become too much delocalized in the spin-polarized-GGA approach. In the GGA+ approach the orbitals are more localized and their contribution to the bonding reduced, SDudarev97Phil ; dorado09 ; RLaskowski04PRB which leads to a theoretical lattice parameter which is larger than the experimental one.Yun11
| (Å) | (GPa) | |
|---|---|---|
| This work | 5.406 | 184 |
| MD (300 K) | 5.472Yamada00JAC | 182Yamada00JAC |
| Exp. (300 K) | 5.47Yamada97 ; idiri04 | 192,benedict82 198,Yamada97 207idiri04 |
III.2 Phonon spectrum of UO2
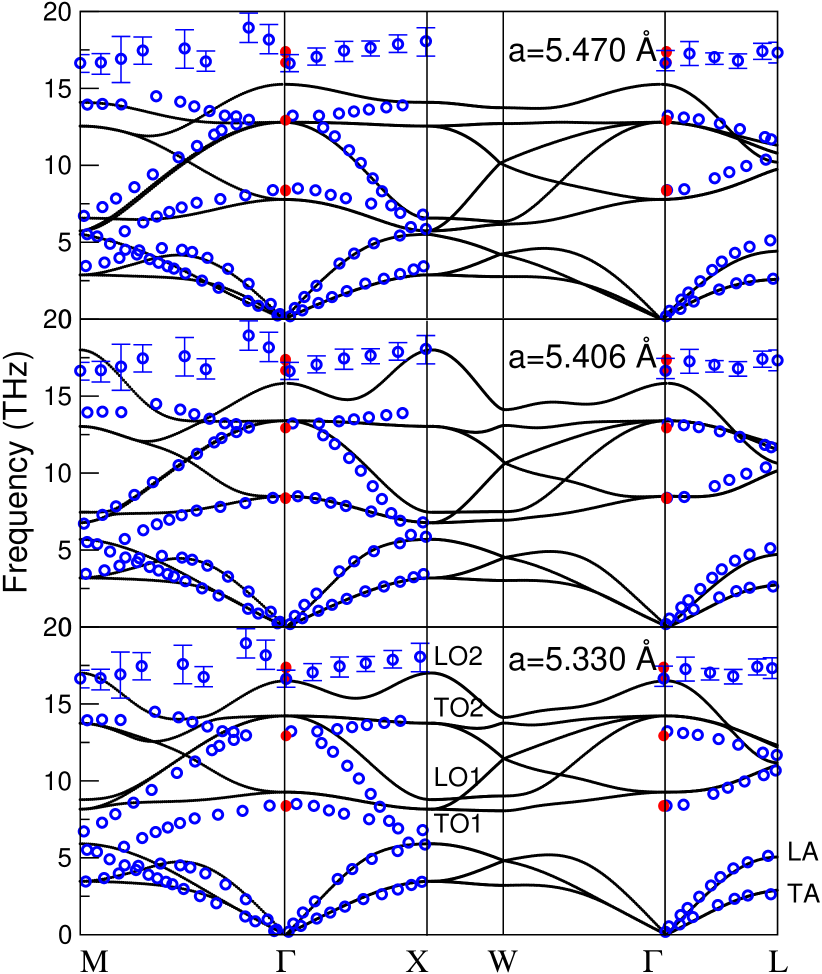
Figure 1 shows the measured and ab initio calculated phonon dispersion curves of UO2 along high-symmetry points of the fcc BZ. The black lines are the calculated phonon dispersions obtained for the different lattice parameters, the blue open symbols are the experimentally measured data from inelastic neutron scattering,Dolling65CJP and red closed symbols are data from Raman scattering.Livneh08JPCM Note that M denotes the additional point that was included by Dolling et al.,Dolling65CJP but that is outside of the first BZ. The calculated phonon dispersions along the high-symmetry lines X-W- have been added to illustrate the whole dispersion of phonon states in the BZ. The three branches in the low frequency region are the transverse acoustic (TA) and longitudinal acoustic (LA) modes that belong to vibrations of the U atom with its relatively heavy mass. The other branches are optical modes with higher frequencies that are mainly associated with lattice vibrations of O atoms and can be labeled as TO1, LO1 and TO2 and LO2, respectively (see Fig. 1), as there are two inequivalent O atoms in the unit cell. The three panels in Figure 1 illustrate the volume dependence of the phonon frequencies, which have been calculated at three different lattice constants, the experimental one, Å, the optimized theoretical one, Å, and Å, a selected smaller lattice constant.
In the surrounding of the point the agreement between the calculated and measured phonon frequencies is very good. A first discrepancy between measured and computed dispersions is observed along the M high-symmetry direction. Our calculations predict three acoustic branches whereas in experiment there are two branches. It could be that a splitting of the low-lying TA branch near the M point could not be sufficiently resolved in the experiment. This might be related to the inelastic neutron scattering technique, which might be affected by the size of samples and as well as a relatively low neutron flux (see, e.g., Refs. Lander80JMMM, and Lander91JMMM, ). Also, as mentioned by Dolling et al. the frequency measurements of the phonons with the neutron technique might be impeded in the zone boundary regions. The LO and TO branches agree reasonably well with experiment, in particular for the optimized theoretical lattice parameter. There are some discrepancies in the positions of the branches at the zone boundary X and at the M point. One of the TO1 branches turning up from the point to the M point has not been detected in the experiment. Along L the agreement is quite good. The top-most (LO2) branch deviates most between calculation and the experiment. This high-lying branch has the largest experimental uncertainty. Nonetheless, the ab initio calculated branch has more dispersion than present in the measurement and, except for the zone center, it falls outside of the experimental error bar.
The phonon frequencies calculated at Å and Å are very similar to each other and agree reasonably well with the measurement data. A notable difference between the two sets of dispersion curves appears however in the frequency gap at the zone boundaries of M and X. When the lattice constant decreases with pressure from Å to Å a pressure-induced phonon softening occurs. The frequency gap between LA and TO1 modes at the zone boundary X point and at the M point is increased as the pressure increases. At Å the LA and TO1 modes almost approach each other, whereas at Å, a gap is predicted to exist between the LA and TO1 modes. A small or vanishing gap between these modes is in accordance with the measurement. We also note that with increased lattice constant the negative slope of the LO1 branch is remarkably increased along the X symmetry line. This finding suggests that the propagation of the LO1 phonon is significantly restrained as the lattice constant increases.
In Fig. 1 we furthermore depicted by the red solid circles at the point the frequencies obtained by Raman and infrared measurements.Schoenes80 ; Livneh08JPCM Using group theory analysis these active Raman and infrared modes can be decomposed into irreducible representations of the (O) point group, as 1TT1u. The U atom contributes only to the infrared active mode (T1u), whereas the O atom contributes to both, the infrared and Raman mode, T1u and T2g, respectively. Both these modes are triply degenerate. The frequencies of these modes are summarized in Table 2, together with results from MD simulationsGoel08JNM and experimental results.Dolling65CJP ; Schoenes80 ; Livneh08JPCM To account for the LO/TO splitting the Lyddane-Sachs-Teller LST relation was used on the basis of effective charges. These were chosen to be 3 for the uranium atom and for oxygen. These values are consistent with values used in the literature.goel07 The macroscopic electric field in UO2 splits the infrared-active optical modes into TO and LO components. Frequencies of TO modes are calculated in a straightforward manner within the direct method but the LO modes can only be obtained via introduction of a non-analytical termPick70 into the dynamical matrix. In general, this term depends on the Born effective charge tensor and the electronic part of the dielectric function (high-frequency dielectric constant). Details regarding this procedure can be found elsewhere, see e.g. Ref. Wdowik07, .
The agreement of the computed Raman optical mode as well as the infrared TO mode with available experimental data is quite good, see Table 2. The calculated frequency of the infrared LO mode is somewhat smaller than the experimental results, indicating that the effective charge and dielectric constant taken from literature do not fully account for the correct . In addition there is a spread of ca. 0.7 THz in the measured values of the LO infrared mode frequencies.Axe66 ; Schoenes80 This is, however, not sufficient to account for the underestimation of the experimental values by about 2 THz that is observed for Å (upper panel of Fig. 1). Using the calculated theoretical volume (middle panel of Fig. 1) this deviation is reduced by 25%. A similar error of ca. 1.5 THz for the ab initio calculated infrared frequencies of another insulating compound, CsNiF3, was reported in a recent study.Leg10
| Mode | this work | MDGoel08JNM | exp. | ||||
|---|---|---|---|---|---|---|---|
| (Å) | 5.33 | 5.406 | 5.47 | 5.47 | 5.47 | ||
| T1u(TO) | 9.27 | 8.49 | 7.78 | 7.62 | 8.34Axe66 , 8.4Schoenes80 | ||
| 8.52Dolling65CJP | |||||||
| T1u(LO) | 16.5 | 15.82 | 15.26 | 17.28 | 16.68Axe66 , 16.7Dolling65CJP | ||
| 17.34Schoenes80 , 17.4Livneh08JPCM | |||||||
| T2g | 14.22 | 13.4 | 12.80 | 14.04 | 12.93Axe66 , 13.42 Dolling65CJP | ||
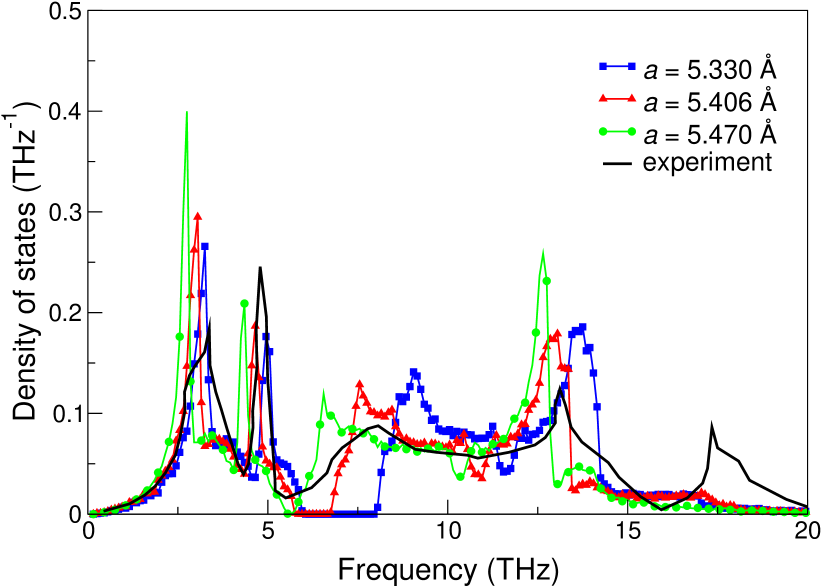
Figure 2 shows the calculated and measured phonon DOS. The blue, red, and green lines with square, triangle, and diamond symbols indicate the phonon DOS computed for =5.330 Å, 5.406 Å, and Å, respectively. The experimental dataDolling65CJP ( Å, =296 K) are plotted with the black line. The U contribution to the calculated phonon DOSs gives rise to a higher intensity and narrower peak widths in the lower frequency region. The more broadened DOS with lower intensity that occurs in the higher frequency region is mainly derived from the oxygen atoms. A notable difference between the phonon DOS at the three lattice parameters is the size and position of the phonon gap occurring for frequencies of about THz. For the experimental lattice parameter Å the computed gap practically closes. The experimental phonon DOS spectrum at this lattice parameter shows a minimum at about 6 THz, in reasonable agreement, considering some experimental broadening. We note that the trend of decreasing gap with larger lattice constant continues, leading to a closing of the gap computed for larger lattice constants (not shown). Overall, the computed phonons DOS of both the theoretical equilibrium ( Å) and the experimental lattice parameter are in good accordance with the measured spectrum. The phonon DOS of the theoretical lattice parameter agrees best with the experimental data at higher frequencies (7 to 13 THz), where the peaks coincide with the measured ones. As mentioned earlier, the LO2 mode lies both lower in the computed spectra and is more dispersive than in the measurements. We note that the recent GGA+ calculationssanati11 provide a sharper DOS peak at 17 THz, due to a flatter LO2 dispersion near the zone boundaries. At the zone center the LO2 branch lies however much deeper than in the experiment, at 10 THz (vs. 17 THz in experiment).
III.3 Thermal expansion of UO2
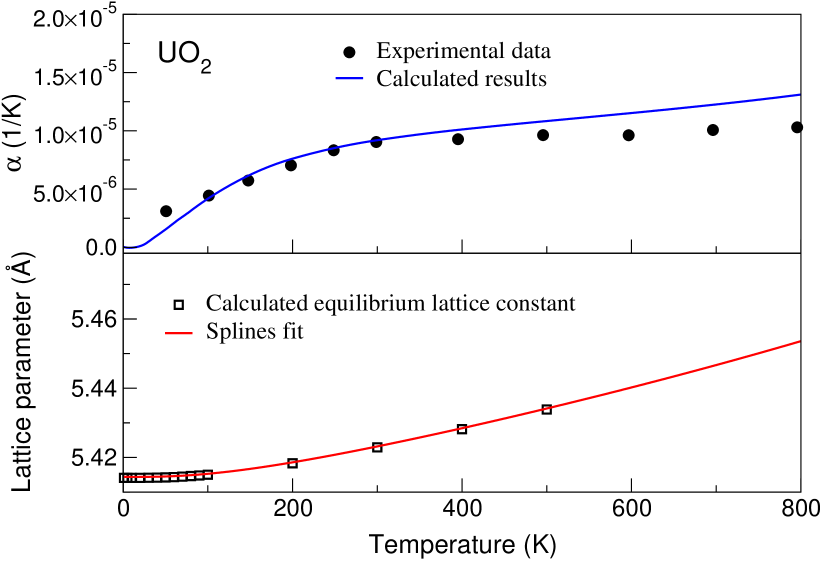
The calculated phonon DOS enables us to evaluate some thermodynamic quantities which depend on the lattice vibrations. We start with the thermal expansion. The phonon contribution to the total free energy of UO2 increases with increasing temperature and hence becomes progressively responsible for changes of the lattice parameters. To compute the thermal expansion of UO2 we have first computed the total free energy, including the phonon contribution, for various lattice parameters, from which we computed the temperature-dependent lattice constant. Figure 3 (bottom) shows the calculated variation of the lattice constant with temperature. The red curve gives the spline interpolation of the calculated lattice constants, shown by the symbols. The thermal expansion coefficient was subsequently evaluated by differentiating the spline fit. The upper panel of Fig. 3 shows the calculated thermal expansion coefficient, which is in good agreement with experimental dataTaylor84 up to 500 K. The deviation between the calculated and measured data slightly increases above 500 K and becomes significant at around 1000 K. This might be due to an increased electronic contribution to the thermal expansion. At very low temperatures, in the region between 0 and 50 K, a deviation is also observed between the calculated and measured data. The origin of this deviation is not unambiguously clear. We note however that UO2 undergoes a magnetic phase transition at 31 K (see Ref. osborne53, ), which may add an additional influence on the lattice parameter.
III.4 Thermodynamic properties of UO2
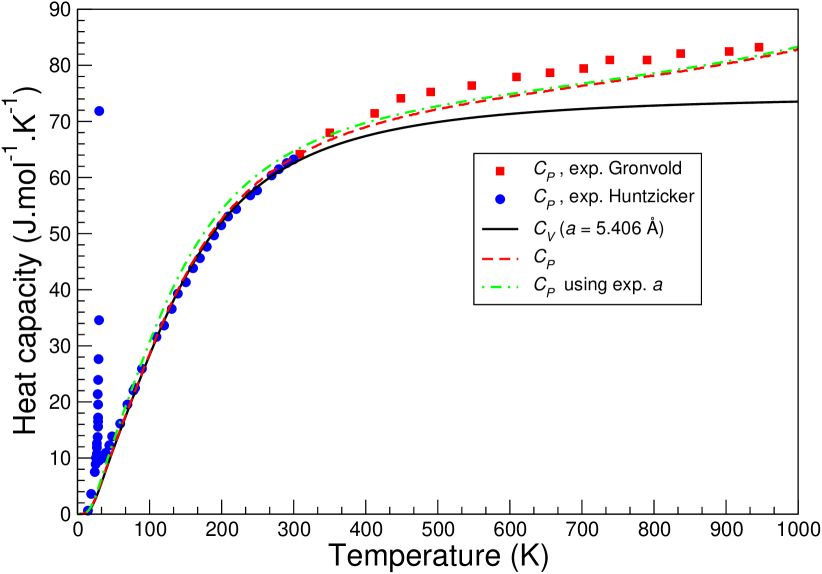
Next, we employ the Helmholtz free energy to compute the lattice heat capacity at constant volume () and at constant pressure (). Fig. 4 shows theoretical results for , computed with the harmonic approximation, and , computed with the quasiharmonic approximation, as well as experimental resultshuntzicker71 ; fink82 for up to 1000 K. First the lattice contribution to the specific heat was computed as a function of temperature for the equilibrium lattice constant, Å. Subsequently, the specific heat at constant pressure was derived according to
| (5) |
where , , and are the calculated linear thermal expansion coefficient, the equilibrium lattice constant, and the bulk modulus (see, e.g., Ref. fultz10, ). Fig. 4 illustrates that there is a very good agreement between the computed heat capacity and the experimental data.huntzicker71 ; gronvold70 ; fink82 Note that the sharp anomaly in the experimental data at K is due to the aforementioned magnetic phase transition,osborne53 which effect is not included in the calculations. Clearly, the specific heat at constant pressure is in much better agreement with the experimental data at higher temperatures than , which is mainly due to the thermal expansion of UO2. Conversely, evaluating for the theoretical equilibrium lattice constant or for the experimental lattice constant Å only gives very minor differences. The computed curves fall somewhat below the experimental data for temperatures in the range of 400 to 1000 K. The uranium atoms in UO2 are in the paramagnetic state at higher temperatures.Schoenes80 ; Hutchings87 Therefore, the remaining difference between experimental and computed data above K could be due to the magnetic entropy contribution to the specific heat or, alternatively, it could be due to the anharmonic effects. The magnetic entropy contribution to the specific heat was investigated for to 300 K in Refs. osborne53, and gronvold70, . At higher temperatures it saturates to approximately , corroborating a magnetic state on the uranium atoms. It provides to a relatively small magnetic entropy contribution that would lead to a small increase of the computed data (by about 3 J mol-1K-1).
IV Conclusions
We have performed first-principles calculations to investigate the lattice vibrations and their contribution to thermal properties of UO2. We find that the calculated phonon dispersions are in good agreement with experimental dispersionsDolling65CJP measured using inelastic neutron scattering. Computing the phonon dispersions for various lattice constants, we observed a softening of the phonon frequencies with decreasing lattice constant. Furthermore, the band gap between TA and LO modes at high-symmetry zone-boundary points are found to depend significantly on the volume. This gap almost closes at Å, consistent with a pseudogap detected in the inelastic neutron experiment. Also, Raman and infrared active modes have been determined as a function of volume. The agreement with experimental data and with results obtained with molecular dynamics simulations is overall very good, with an exception of the infrared LO mode that appears underestimated in our first-principles calculations. Including the phonon contribution to the free energy, the heat capacity and the thermal expansion coefficient of UO2 have been computed. Both thermal quantities are found to agree well with experimental data for temperatures up to 500 K. The good correspondence of the computed and measured thermal data exemplifies the feasibility of performing first-principles modeling of the thermal properties of the important nuclear fuel material UO2.
Acknowledgements.
This work has been supported by Svensk Kärnbränsle-hantering AB (SKB), the Swedish Research Council (VR), the Swedish National Infrastructure for Computing (SNIC), and by research project No. CZ.1.07/2.3.00/20.0074 of the Ministry of Education of the Czech Republic. D. L. thanks P. Pavone, University of Leoben, Leoben, Austria, and U. D. Wdowik, Pedagogical University, Cracow, Poland for fruitful discussions.References
- (1) C. Ronchi, High Temperature 45, 609 (2007).
- (2) J. K. Fink, J. Nucl. Mater. 279, 1 (2000).
- (3) J. J. Carbajo, G. L. Yoder, S. G. Popov, and V. K. Ivanov, J. Nucl. Mater. 299, 1 (2001).
- (4) K. H. Kang, K. C. Song, M. S. Yang, S. H. Lee, J. B. Ko, and S. W. Kim, Int. J. Thermophys. 27, 161 (2006).
- (5) Y. Yun and P. M. Oppeneer, Mater. Res. Soc. (MRS)-Bulletin 36, 178 (2011).
- (6) J. Bouchet and G. Jomard, J. Alloys. Compd. 444-445, 271 (2007).
- (7) K. Yamada, K. Kurosaki, M. Uno, and S. Yamanaka, J. Alloys. Compd. 307, 10 (2000).
- (8) T. Watanabe, S. B. Sinnott, J. S. Tulenko, R. W. Grimes, P. K. Schelling, and S. R. Phillpot, J. Nucl. Mater. 375, 388 (2008).
- (9) G. Dolling, R. A. Cowley, and A. D. B. Woods, Can. J. Phys. 43, 1397 (1965).
- (10) J. Schoenes, Phys. Rep. 63, 301 (1980).
- (11) T. Livneh and E. Sterer, Phys. Rev. B 73, 085118 (2006).
- (12) T. Livneh, J. Phys.: Condens. Matter 20, 085202 (2008).
- (13) Q. Yin and S. Y. Savrasov, Phys. Rev. Lett. 100, 225504 (2008).
- (14) P. Goel, N. Choudhury, and S. L. Chaplot, J. Phys.: Cond. Matter 19, 386239 (2007).
- (15) P. Goel, N. Choudhury, and S. L. Chaplot, J. Nucl. Mater. 377, 438 (2008).
- (16) A. J. Devey, J. Nucl. Mater. 412, 301 (2011).
- (17) M. Sanati, R. C. Albers, T. Lookman, A. Saxena, Phys. Rev. B 84, 014116 (2011).
- (18) S. L. Dudarev, D. Nguyen Manh, and A. P. Sutton, Phil. Mag. B 75, 613 (1997).
- (19) J. P. Crocombette, F. Jollet, L. Thien, and T. Petit, Phys. Rev. B 64, 104107 (2001).
- (20) K. N. Kudin, G. E. Scuseria, and R. L. Martin, Phys. Rev. Lett. 89, 266402 (2002).
- (21) R. Laskowski, G. K. H. Madsen, P. Blaha, and K. Schwarz, Phys. Rev. B 69, 140408(R) (2004).
- (22) I. D. Prodan, G. E. Scuseria, and R. L. Martin, Phys. Rev. B 76, 033101 (2007).
- (23) L. E. Roy, T. Durakiewicz, R. L. Martin, J. E. Peralta, G. E. Scuseria, C. G. Olson, J. J. Joyce, and E. Guziewicz, J. Comput. Chem. 29, 2288 (2008).
- (24) B. Dorado, B. Amadon, M. Freyss, and M. Bertolus, Phys. Rev. B. 79, 235125 (2009).
- (25) B. Dorado, G. Jonard, M. Freyss, and M. Bertolus, Phys. Rev. B 82, 035114 (2010).
- (26) L. Petit, A. Svane, Z. Szotek, W. M. Temmerman, and G. M. Stocks Phys. Rev. B 81, 045108 (2010).
- (27) Y. Yun, J. Rusz, M.-T. Suzuki, and P. M. Oppeneer, Phys. Rev. B 83, 075109 (2011).
- (28) S. L. Dudarev, G. A. Botton, S. Y . Savrasov, Z. Szotek, W. M. Temmerman, and A. P. Sutton, Phys. Status Solidi 166, 429 (1998).
- (29) Y. Yun, Hanchul Kim, Heemoon Lim, and K. Park, Nucl. Eng. Tech. 50, 293 (2005).
- (30) Y. Yun, H. Kim. H. Lim, and K. Park, J. Korean Phys. Soc. 50, 1285 (2007).
- (31) K. Parlinski, Z.-Q. Li, and Y. Kawazoe, Phys. Rev. Lett. 78, 4063 (1997); Phys. Rev. B 61, 272 (2000).
- (32) K. Parlinski, PHONON software, Cracow, Poland, 2005.
- (33) G. Kresse and J. Hafner, Phys. Rev. B 47, R558 (1993).
- (34) G. Kresse and J. Furthmüller, Phys. Rev. B 54, 11169 (1996).
- (35) P. Sindzingre and M. J. Gillan, J. Phys. C: Solid State Phys. 21 4017 (1988).
- (36) P. Zhang, B.-T. Wang, and X.-G. Zhao, Phys. Rev. B 82, 144110 (2010).
- (37) J. P . Perdew and Y. Wang, Phys. Rev. B 45, 13244 (1992).
- (38) F. Birch, Phys. Rev. 71, 809 (1947).
- (39) K. Yamada, S. Yamanaka, T. Nakagawa, M. Uno, and M. Katsura, J. Nucl. Mater. 247, 289 (1997).
- (40) M. Idiri, T. Le Bihan, S. Heathman, and J. Rebizant, Phys. Rev. B 70, 014113 (2004).
- (41) U. Benedict, G. D. Andreetti, J. M. Fournier, and A. Waintal, J. Phys. (France) Lett. 43, L171 (1982).
- (42) M.T. Hutchings, J. Chem. Soc., Faraday Trans. 83, 1083 (1987).
- (43) G. H. Lander, J. Magn. Magn. Mater. 15, 1208 (1980).
- (44) G. H. Lander and G. Aeppli, J. Magn. Magn. Mater. 100, 151 (1991).
- (45) R. H. Lyddane, R. G. Sachs, and E. Teller, Phys. Rev. 59, 673 (1951).
- (46) R. M. Pick, M. H. Cohen, and R. M. Martin, Phys. Rev. B 1, 910 (1970).
- (47) J. D. Axe and G. D. Petit, Phys. Rev. 151, 676 (1966).
- (48) U. D. Wdowik and K. Parlinski, Phys. Rev. B 75, 104306 (2007).
- (49) D. Legut and U. D. Wdowik, J. Phys.: Condens. Matter 22, 435402 (2010).
- (50) D. Taylor, Br. Ceram. Trans. J. 83 32 (1984).
- (51) D. W. Osborne and E. F. Westrum, J. Chem. Phys. 21, 1884 (1953).
- (52) J. J. Huntzicker and E. F. Westrum, J. Chem. Thermodyn. 3, 61 (1971).
- (53) F. Grønvold, N. J. Kveseth, A. Sveen, and J. Tichý, J. Chem. Thermodyn. 2, 665 (1970).
- (54) J. K. Fink, Int. J. Thermophys. 3, 165 (1982).
- (55) B. Fultz, Prog. Mater. Science 55, 247 (2010).