IGR J17448-3232 point source: A blazar candidate viewed through the Galactic centre?††thanks: Based on observations collected at the European Organisation for Astronomical Research in the Southern Hemisphere, Chile under ESO program 084.D-0535 (P.I. Chaty)
Abstract:
The error region of the INTEGRAL source, IGR J17448-3232, contains an X-ray point source at the edge of a ′ radius extended X-ray source. It has been suggested that the extended emission is a young supernovae remnant (SNR) while the point source may be an isolated neutron star, associated with the SNR, that received a kick when the supernova occurred. We identify the infrared counterpart of the X-ray point source, visible from 2.2 m to 24 m, and place limits on the flux at longer wavelengths by comparison with radio catalogues. Multi-wavelength spectral modeling shows that the data are consistent with a reddened and absorbed single power law over five orders of magnitude in frequency. This implies non-thermal, possibly synchrotron emission that renders the previous identification of this source as a possible pulsar, and its association to the SNR, unlikely; we instead propose that the emission may be due to a blazar viewed through the plane of the Galaxy.
1 Introduction
We observed the field of IGR J17448-3232 as part of our observing campaign at ESO’s New Technology Telescope (NTT). The purpose of this program is to detect near-infrared (nIR) counterparts of INTEGRAL sources in order to identify or confirm their nature via Spectral Energy Distributions (SEDs) and/or spectra [6, 20]. The main focus of the program is to investigate the numerous intrinsically obscured, high mass X-ray binaries (HMXBs) observed by INTEGRAL and so far we have been able to identify 13 of these as either Supergiant (5 cases) or Be (8 cases) systems via spectral analysis [Coleiro et al. in preparation]. As many of the INTEGRAL sources are not previously detected in the nIR or optical, there is often confusion regarding their true nature. Hence, along with the HMXBs identified in our sample, we observed and later classified a number of sources as low mass X-ray binaries (LMXBs) [10], pulsar wind nebulae (PWNe) [11] and, in the case of IGR J17448-3232 which we summarise here, a blazar [9].
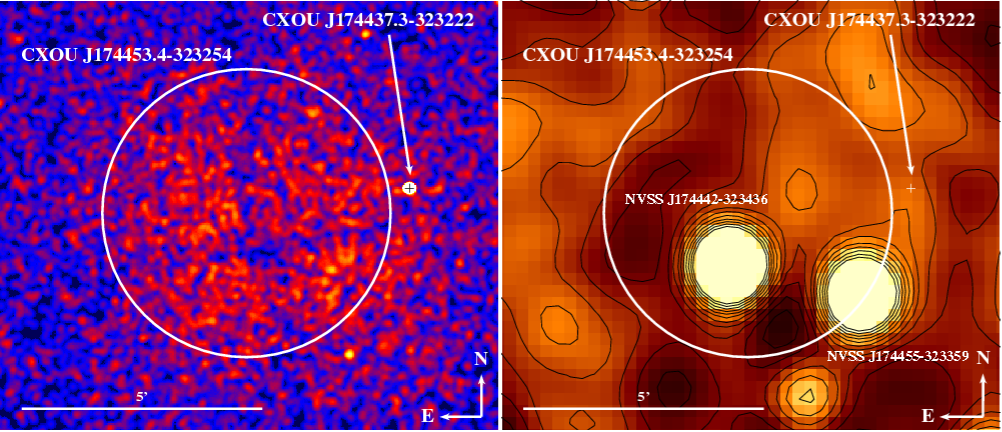
The X-ray source, IGR J17448-3232 was initially discovered by INTEGRAL and published in the Third and subsequently Fourth IBIS/ISGRI Soft Gamma-Ray Survey Catalog [3, 4] at slightly different, though consistent, positions and fluxes. In an attempt to refine the position, the Swift X-ray telescope (XRT) observed the field and a point source at the edge of the original INTEGRAL error circle, as well as possible diffuse emission, were identified [16]. The position of the point source was further refined by a 4.7 ks Chandra observation of the field [22]. In addition to detecting the point source, CXOU J174437.3-323222, those authors confirmed an extended source, times brighter, at the INTEGRAL position (CXOU J174453.4-323254, see Figure 1, left). At the XRT point source position a USNO-B1.0 [17] and 2MASS [21] source was noted [16], however, the sub-arcsecond accuracy of the Chandra position eliminates this source as a possible counterpart; though the X-ray point source is at the edge of the 2MASS point spread function. Based on analysis of the Chandra spectrum it was proposed [22] that the extended emission originated from a young supernova remnant (SNR), though no evidence of a pulsar wind nebula (PWN) was detected. A tentative association of the point source with the SNR was also suggested, the authors hypothesizing that it may be an isolated neutron star which received a kick when the supernova occurred.
2 The search for a counterpart
We collated data of IGR J17448-3232 from various sources including published catalogs, archived images and our own ESO-NTT observations, in an attempt to identify multi-wavelength counterparts and investigate the nature of the source. In the high energy range ( keV) a source is documented in the Palermo Swift-BAT hard X-ray catalogue (15–150 keV; [12]), though given the resolution of the BAT instrument this is likely an unresolved measurement of both the extended and point source. No source, consistent with either position, is found in the Fermi LAT First Source Catalog (100 MeV – 100 GeV; [1]) and no such source has been made public by Fermi GBM (10 keV – 30 MeV) or HESS (100 GeV – 100 TeV; [7]). At the other end of the spectrum, the second epoch Molonglo Galactic Plane Survey (MGPS-2) compact source catalogue [18], which details observations at 843 MHz, documents two nearby sources which are also included in the NRAO VLA Sky Survey (1.4 GHz; NVSS; [8]). The extension of these sources overlap with the extended X-ray emission but neither are consistent with the point-like X-ray source (Figure 1, right). From a visual inspection of the NVSS and MGPS-2 images available of the field, there is no obvious sign of any excess emission above background levels at the point source position so we use the flux density of a nearby dim object as a measure of the 1.4 GHz upper limit in the field. No nearby sources are found in any of the 9 bands (30 GHz – 856 GHz) of the all-sky, Planck Early Release Compact Source Catalog [19] and while flux density limits for the region are not well quantified, they are on the order of 1 Jy [19].
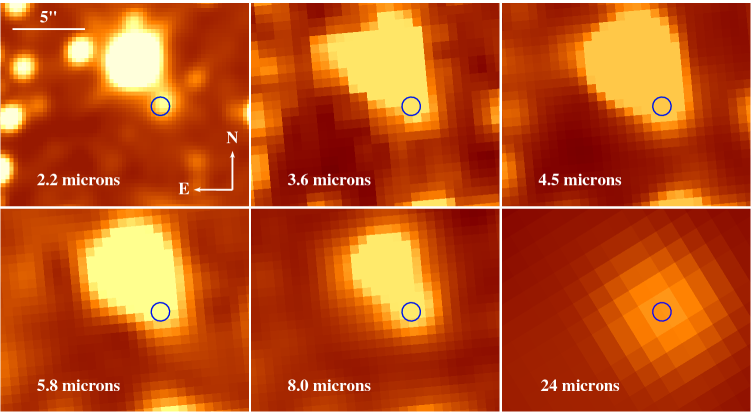
Moving to higher energies, we obtained a band (2.2 m) image of the field with the SofI instrument on the 3.58m ESO-New Technology Telescope (NTT). We also utilised data from the Spitzer Space Telescope’s GLIMPSE [2] and MIPSGAL [5] surveys with entries at 3.6, 4.5, 5.8, 8.0 and 24 m. While there is no sign of any diffuse emission corresponding to the extended X-ray emission in any of images, a resolved counterpart is clearly detected at the point source position (Figure 2). The probability of a chance superposition down to the observed magnitude of the source in the band is %, or down to the limiting magnitude of the field is %, while the probabilities are lower (1-4%) at the more sparsely populated longer wavelengths. We were also able to obtain an upper limit from Swift’s Ultraviolet/Optical Telescope (UVOT) band (m); the lack of a detection is not surprising, given the high value of Galactic extinction in the direction of the Galactic centre and the blueness of the filter.
3 Multi-wavelength Spectral Energy Distribution
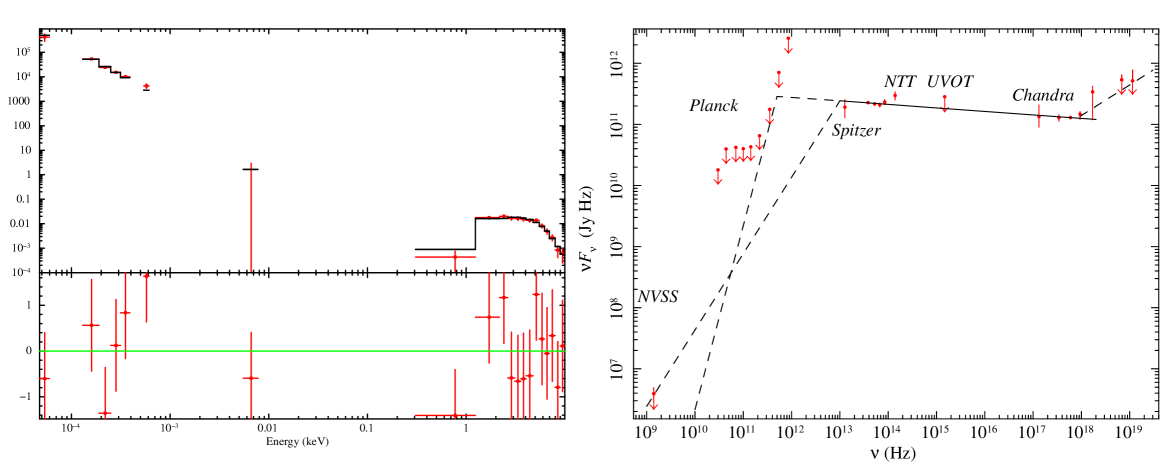
The infrared, Swift UVOT and Chandra X-ray data were fit within XSPEC by a single power law (Figure 3 Left) , affected by interstellar extinction and absorption. However, this model has a clear excess of emission at energies keV that could not be accounted for by any possible pile-up. Including an additional, purely phenomenological, power law component produces a marginal improvement of the fit with power law and extinction/absorption parameters similar to those of the initial fit. The best fit (Figure 3) gives a broadband spectral index, () from infrared to X-ray of ( confidence), as well as a secondary spectral index to account for the excess emission keV which is poorly constrained. If the observed, unresolved INTEGRAL and BAT fluxes (at Hz and Hz respectively) are taken as upper limits on the contribution of the point source at these energies, we can place an approximate limit on the steepest possible high energy slope of , assuming a break at Hz.
The optical extinction is fit as and the equivalent hydrogen column density as cm-2, marginally greater than the Galactic value of cm-2 [15]. These should be treated with caution due to the small range over which they are calculated and, in the case of extinction, the lack of sensitivity at the observed wavelengths.
The Planck limits imply that the spectrum breaks at a frequency Hz, i.e., between the Planck and Spitzer frequencies, though the exact value will depend on the sharpness of the break. The flattest possible spectral index, at low frequencies is , while the upper limits are also consistent with a steepest possible (physical) spectral slope of .
4 A blazar candidate viewed through the Galactic centre?
The IR to X-ray SED displays a single power law with no evidence for any thermal emission at any frequency in the observed bands – only a suggestion of excess emission above keV – and the spectral index of this non-thermal emission corresponds to the expected spectral slope of synchrotron emission from accelerated electrons (though this is only one possible interpretation of the data). As non-contemporaneous X-ray flux measurements from Swift-XRT and Chandra are consistent, we can assume that the source is relatively steady, though we cannot rule out variability. The single power law SED derived from non-contemporaneous archive/catalog values also supports this assumption. This persistent, single power law emission might be expected from a number of astronomical sources such as AGN, persistent X-ray binaries, microquasars or magnetars but in most of these cases there would be a measurable thermal component, of which there is no evidence of here. Power law emission would also be expected from a SNR or PWN but the extended nature of these sources should be observable in either the X-ray or IR/optical, which is not the case. As mentioned above, this source has been suggested to be a pulsar but a pulsar would not be expected to be so radio dim relative to its brightness in the nIR regime.
One solution that can explain the emission is that the source is a blazar, an AGN with its jet pointing directly at us (e.g., [14]). Blazars are persistent sources, though it should be noted that they have been observed to undergo flares and high energy rapid variability as well as long term evolution, to which the observations detailed here would not be sensitive. In this scenario the emission in a given regime is dominated by synchrotron or inverse Compton (IC) emission from the jet which, because of its angle towards us, is much brighter than the thermal and other emission associated with the AGN. Even though the source is close to the Galactic centre (∘), the Galactic column density is relatively low in that direction, allowing the emission to be visible through the Galaxy. The possible excess column density implied by the X-ray spectra suggests excess absorption which may be explained by absorption close to the source. The measured IR and X-ray fluxes of this source and spectral slope are all broadly consistent with those of blazars in general [13]. As blazars are associated with radio galaxies, we would generally expect radio emission from their jets but in this case we do not, though the implied radio limit is consistent with a low frequency synchrotron spectral slope (Figure 3 Right) and the detected radio fluxes in other blazars[13].
In this framework the apparent excess of emission at energies keV ( Hz) which we model, phenomenologically, with a second power law is due to the expected inverse Compton emission from blazars. However, we can only place a loose constraint on this excess component from the Chandra spectrum and the upper limits implied by the unresolved (from the extended source) emission in the higher energy bands (i.e., Swift-BAT, INTEGRAL).
Tests of this hypothesis require an optical or IR spectrum with which to confirm the extragalactic nature of the source, though blazars, if of the BL Lac class of radio galaxy, are expected to have no or only very weak lines. Hence, it may be the absence of lines, such as those that would be expected from Galactic sources, that will add weight to the blazar argument. However, the main test is a broader-band SED spanning from radio to optical and into the high energy X-rays, which should display the double peaks (synchrotron and inverse Compton), or at least slopes, and confirm the absence of a thermal component. Approved X-ray observations of the source will also allow us to test whether any possible variability is consistent with a blazar. Additionally, a high level of linear polarisation might be expected if the source is a blazar, due to the synchrotron emission.
5 Conclusions
On the basis of positional coincidence and common spectral slope, we have identified a new infrared counterpart to the X-ray point source in the field of IGR J17448-3232, visible from 2.2 to 24 m. Multi-wavelength spectral modelling shows that the data are consistent with a reddened and absorbed single power law over five orders of magnitude in frequency. This implies non-thermal, possibly synchrotron emission that we propose may be due to a blazar viewed through the plane of the Galaxy. If this source is confirmed as a blazar, at degrees, while not being the first in the Galactic plane, it will be the first identified so close to the Galactic centre. If the point source is a blazar it is possible that the extended emission, instead of being a SNR, is in fact a Galaxy cluster although it is also possible that the two sources of emission are not associated; approved X-ray observations will allow us to confirm the nature of the extended emission.
Acknowledgments.
We thank the referee for their constructive comments. This work was supported by the Centre National d’Etudes Spatiales (CNES) and is based on observations obtained with MINE: the Multi-wavelength INTEGRAL NEtwork.References
- [1] Abdo, A. A., et al. 2010, ApJS 188, 405
- [2] Benjamin, R. A., et al. 2003, PASP 115, 953
- [3] Bird, A. J., et al. 2007, ApJS 170, 175
- [4] Bird, A. J., et al. 2010, ApJS 186, 1
- [5] Carey, S. J., et al. 2009, PASP 121, 76
- [6] Chaty, S., Rahoui, F., Foellmi, C., Tomsick, J. A., Rodriguez, J., Walter, R. 2008, A&A 484, 783
- [7] Chaves, R. C. G., & the H. E. S. S. Collaboration 2009, arXiv 0907.0768
- [8] Condon, J. J., Cotton, W. D., Greisen, E. W., Yin, Q. F., Perley, R. A., Taylor, G. B., & Broderick, J. J. 1998, AJ 115, 1693
- [9] Curran, P. A., Chaty, S., Zurita Heras, J. A., Tomsick, J. A. & Maccarone, T. J. 2011, MNRAS 417, L26
- [10] Curran, P. A., Chaty, S. & Zurita Heras, J. A. 2011, A&A 533, A3
- [11] Curran, P A., Chaty, S., Zurita Heras, J. A. & Coleiro, A. 201,1 A&A 534, A48
- [12] Cusumano, G., et al. 2010, A&A 524, A64
- [13] Fossati, G., Maraschi, L., Celotti, A., Comastri, A., & Ghisellini, G. 1998, MNRAS, 299, 433
- [14] Ghisellini, G. 2011, arXiv, 1104.0006
- [15] Kalberla, P. M. W., Burton, W. B., Hartmann, D., Arnal, E. M., Bajaja, E., Morras, R., & Pöppel, W. G. L. 2005, A&A 440, 775
- [16] Landi, R., et al. 2007, ATEL 1323
- [17] Monet, D. G., et al. 2003, AJ 125, 984
- [18] Murphy, T., Mauch, T., Green, A., Hunstead, R. W., Piestrzynska, B., Kels, A. P., & Sztajer, P. 2007, MNRAS 382, 382
- [19] Planck Collaboration, et al. 2011, arXiv 1101.2041
- [20] Rahoui, F.; Chaty, S., Lagage, P.-O., Pantin, E. 2008, A&A 484, 801
- [21] Skrutskie, M. F., et al. 2006, AJ 131, 1163
- [22] Tomsick, J. A., Chaty, S., Rodriguez, J., Walter, R., & Kaaret, P. 2009, Astrophys. J. (7) 01, 811