A Binary Orbit for the Massive, Evolved Star HDE 326823,
a WR+O System Progenitor
Abstract
The hot star HDE 326823 is a candidate transition-phase object that is evolving into a nitrogen-enriched Wolf-Rayet star. It is also a known low-amplitude, photometric variable with a 6.123 d period. We present new, high and moderate resolution spectroscopy of HDE 326823, and we show that the absorption lines show coherent Doppler shifts with this period while the emission lines display little or no velocity variation. We interpret the absorption line shifts as the orbital motion of the apparently brighter star in a close, interacting binary. We argue that this star is losing mass to a mass gainer star hidden in a thick accretion torus and to a circumbinary disk that is the source of the emission lines. HDE 326823 probably belongs to a class of objects that produce short-period WR+O binaries.
1 Introduction
Mass loss plays a key role in the evolution of the most massive stars, where, for example, a 60 star may lose 65% of its mass before exploding as a supernova (Smith & Owocki 2006). Very massive stars (; Meynet & Maeder 2003) start their lives as O stars and will lose large amounts of mass as they pass through stages such as the red supergiant (RSG) and Wolf-Rayet (WR) phases during their post-main sequence evolution. The most massive stars may experience the rare, luminous blue variable (LBV) stage that is observed in objects such as P Cyg and Car. During the LBV phase, a star is subject to possible great eruptions, variations on timescales from days to decades, and extremely high mass loss rates (Smith et al. 2011a).
The loss of a star’s envelope to become a WR star may occur entirely by winds (Massey, Conti, & Niemela 1981) or it may be aided by Roche lobe overflow in a close binary to form WR+O systems like Vel (North et al. 2007). The prototypical examples of the active mass-transfer objects are Lyr (Zhao et al. 2008) and the more massive RY Sct (Grundstrom et al. 2007). In both of these cases, we observe the less massive donor star while the more massive gainer star is hidden within an optically thick, accretion torus. Such H-deficient, donor stars will likely explode in Type Ib/c supernovae (Smith et al. 2011b), and understanding their pre-SN evolution is critical to the interpretation and modeling of these supernovae.
HDE 326823 (Hen 3-1330; V1104 Sco; ALS 3918; ASAS J170654-4236.6) is a Galactic example of an unusual transition-phase object. Van Genderen (2001) places this object in the category of ex-/dormant LBVs, and the star may be entering the WN (nitrogen-enriched WR) stage of evolution from either the LBV or RSG stage (Lopes et al. 1992; Sterken et al. 1995a; Marcolino et al. 2007). Sterken et al. (1995a) found some changes in Strömgren photometry over long timescales from data taken three years apart, and they presented some examples of line profile variations in the optical spectrum. Analysis of the more recent photometric variations from the All Sky Automated Survey333http://www.astrouw.edu.pl/asas (ASAS) by Pojmański & Maciejewski (2004) indicates a short period of 6.123 d and an amplitude of 0.17 mag in .
The far-UV spectrum of HDE 326823 resembles that of an early B-supergiant (Shore et al. 1990). However, the optical spectrum of HDE 326823 was described as “the most bizarre in the OB Zoo” by Walborn & Fitzpatrick (2000), who discussed the weak H lines, the strong Fe II emission, and several other subtle features. They placed this star in the category of an “iron star” from the presence of the Fe II emission, a group that includes only four other high luminosity objects in their study. The unusual spectrum of HDE 326823 was further examined in two key studies. Borges Fernandes et al. (2001) presented a spectral atlas for the region between 3800 and 9200 Å. They found very strong helium emission lines while the hydrogen Balmer emission lines were relatively weak. The He I, H I, and Ca II emission lines all exhibited double-peaked profiles. Marcolino et al. (2007) performed detailed modeling of the spectrum from the ultraviolet through the optical with the non-LTE radiative transfer code, CMFGEN (Hillier & Miller 1998). They found that the star has wind parameters that are similar to those of low luminosity LBVs. Most importantly, they found that the mass fractions are and , and their analysis supports the interpretation that the object is a pre-WN star. Their CMFGEN model fits the spectral energy distribution and most emission lines, but does not account for the double-peaked profiles.
In this paper, we present in §2 a re-analysis of the photometry from ASAS, and we show that the complex ASAS light curve is consistent with the earlier photometric variations observed by Sterken et al. (1995a). In §3, we present new, moderate and high resolution, spectroscopic observations, use radial velocity measurements of weak N II absorption features to derive orbital elements based upon the photometric period, and show how the emission profiles vary with this period. We develop in §4 a binary scenario to explain the observational properties. We summarize our results in §5.
2 Photometric Variations
We re-analyzed the light curve by first collecting -band measurements from ASAS (Pojmański 2002) by removing points deemed lower quality. We performed a time-series analysis on the remaining 479 -band measurements spanning 3155 d using the Lomb-Scargle periodogram (Scargle 1982). In the period domain of 2–40 d, we find strong peaks around periods 3 and 6 d. However, the 3 d period is a sub-multiple of the main period of photometric variability of 6.12280.0053 d (Fig. 1, top), confirming the 6.123 d period listed in the ASAS Catalog of Variable Stars (Pojmański & Maciejewski 2004). We see two distinctive minima and maxima in the phased light curve (maxima near phase 0.35 and 0.9 and minima around phase 0.1 and 0.8, when phased to an epoch of HJD 2454622.4312, introduced in §3.3). Pojmański & Maciejewski (2004) classify the light curve as a DCEP-FU type, i.e., that of a Cepheid pulsating in the fundamental mode. However, this star is so far removed from the Cepheid instability strip in the H-R diagram that we must seek other explanations (§4).
We also examined the archival measurements of the Long-term Photometry of Variables (LTPV) program of Strömgren magnitudes (Sterken et al. 1993; Manfroid et al. 1995; Sterken et al. 1995b; star ID P7058). Sterken et al. (1995a) analyzed these data and found a systematic brightening between data collected from 1988 and 1991 and data collected in 1994. We show their -band measurements in the second and third panels of Figure 1, where the 1994 data are plotted in the middle panel and the earlier measurements are shown in the bottom panel. These light curves are qualitatively similar to the ASAS light curve, but appear shifted in phase. The appropriate phase shift was found by cross-correlating in phase the observed set with a phase-binned, averaged light curve from ASAS. The shifted ASAS light curve is shown in the middle and bottom panels of Figure 1 for phase shifts of and , respectively. These shifts indicate that the actual period may be slightly smaller and/or was smaller in the past compared to the period derived from ASAS, and we encourage continued photometric observations. Nevertheless, the reasonable agreement between the shifted ASAS light curve and the LTPV data sets indicates that the complex, cyclic, light variations have likely been present over the last two decades.
3 Spectroscopic Variations
3.1 Observations
We obtained 21, low dispersion, red spectra of HDE 326823 with the CTIO 1.5 m telescope and Cassegrain R-C spectrograph (SMARTS Consortium setup 47/Ib; described by Howell et al. 2006). These spectra have a resolution of 2.2 Å FWHM (). The spectra were recorded on a Loral 1200800 CCD detector and were reduced using standard techniques. We typically made two 120 s integrations per visit and performed the wavelength calibration using a Ne lamp, with resulting residuals typically of 0.02 Å.
We also obtained high resolution spectroscopy () with the CTIO 1.5 m telescope and the fiber-fed, echelle spectrograph444http://www.ctio.noao.edu/atokovin/echelle/FECH-overview.html. We typically made two 900 s integrations per visit. The resulting echelle spectra are of good quality in the red-green region, where we typically obtained a signal-to-noise ratio of 50–75 per pixel in the continuum. These spectra were reduced using standard echelle spectroscopy techniques with IRAF555IRAF is distributed by the National Optical Astronomy Observatory, which is operated by the Association of Universities for Research in Astronomy, Inc., under cooperative agreement with the National Science Foundation., but the spectra were flat-fielded after extraction with custom IDL software in order to remove residual jumps in the intensity across the center of the dual-readout chip. The wavelength solution was determined by means of a Th-Ar lamp spectrum that was made at the same sky location just prior to the science exposure. Typical residuals to the fit are on the order of 0.006 Å. We obtained spectra over five nights during the commissioning period for the spectrograph (2008 Jun 5–9) and over 15 additional nights during 2010. The commissioning period spectra cover a range 4780–6450 Å, while the more recent spectra were collected with the full chip being read out and cover a range of 4200–7350 Å. Note that all of these data suffer from very low signal-to-noise at regions blueward of Å. A few of these spectra were omitted in the analysis, because of their low signal-to-noise ratio.
3.2 Absorption Line Variability
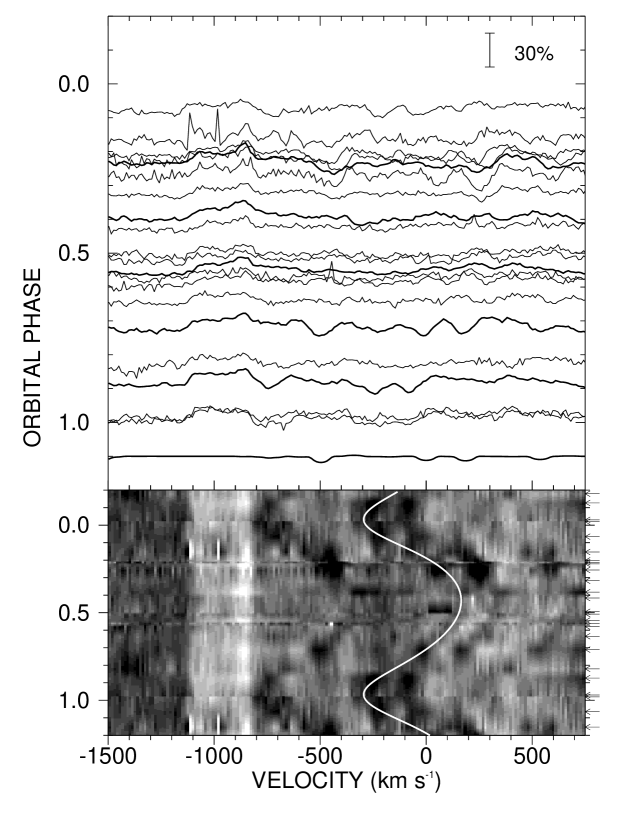
Very few absorption lines are present in the red part of the spectrum of HDE 326823 (Borges Fernandes et al. 2001), but there are a few N II lines in the region of 5667–5710 Å that are recorded in our echelle observations (see Fig. 1b in the paper by Borges Fernandes et al. 2001). In Figure 2 we show a two panel plot of these features as a function of photometric phase, both as line plots (top panel) and as a gray scale that is interpolated in phase to fill in observational gaps (lower panel). There is a subtle, double-peaked, emission feature blueward of these N II lines that is identified as Fe II by Borges Fernandes et al. (2001). The N II absorption lines show large radial velocity shifts as a function of photometric phase, while the Fe II emission remains kinematically stationary.
These N II features are typically observed in the spectra of B-type supergiants. We computed a reference spectrum by using the values of K and from the spectral modeling of Marcolino et al. (2007) and by interpolating within the BSTAR2006 grid of model spectra (Lanz & Hubeny 2007). This reference spectrum is shown in the top panel Figure 2 with the continuum placed at phase 1.1. The N II lines in the model match reasonably well with those in the observed spectrum in most cases, but there were at least four epochs where these lines weaken or disappear entirely.
3.3 A Single-Lined Spectroscopic Orbit
We measured radial velocities for the N II lines by means of cross-correlation with the reference spectrum computed above. Our results produced reliable velocities for all but four observations where the N II lines were too weak to measure. The average statistical error of the cross-correlation velocities is 6.6 km s-1 according to the method of Zucker (2003), but the individual errors are much larger in those cases where the N II lines are weak. We used these measurements and the derived photometric period of 6.1228 d to make an error-weighted fit of the remaining orbital elements using the program of Morbey & Brosterhus (1974). The measurements are given in Table 1, and the derived, single-lined, orbital elements are shown in Table 2 (where is the epoch of periastron that we adopted in §2 for the light curve). We plot in Figure 3 the radial velocities as a function of orbital phase, together with the derived orbital velocity curve.
Our derived orbit has two features that are striking. The first is that an eccentric orbit fits the data much better than a circular orbit. When we fit a circular orbit, the rms of the residuals from the fit increased by more than a factor of two. A significant eccentricity is unusual for a short period binary because the large tidal forces should act to circularize the orbit. The second notable aspect of this orbit is that the mass function is large, with a value of . This suggests that the companion must be a massive star, yet there is no clear evidence of spectral features with Doppler shifts corresponding to those of the companion. We will discuss the nature of the companion star in §4.
3.4 Emission Line Variability
3.4.1 He I Lines
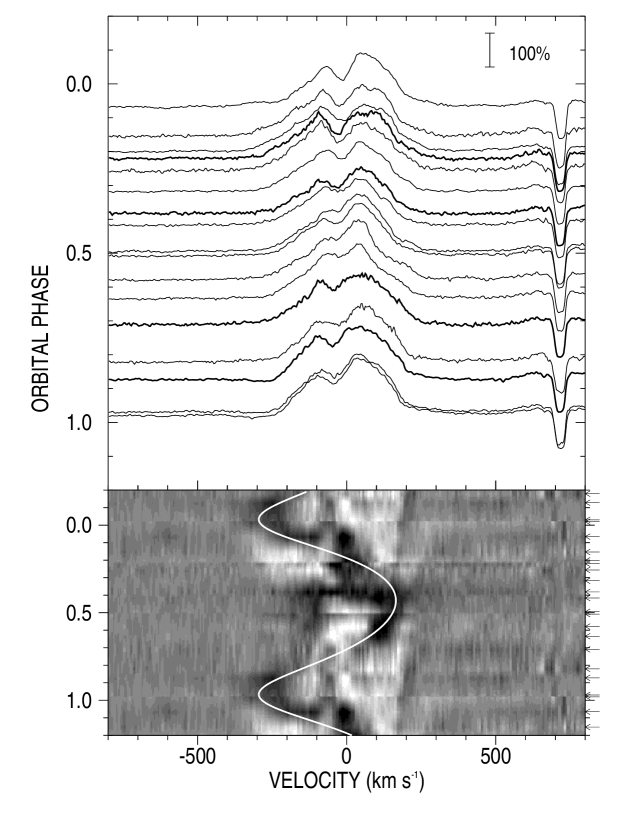
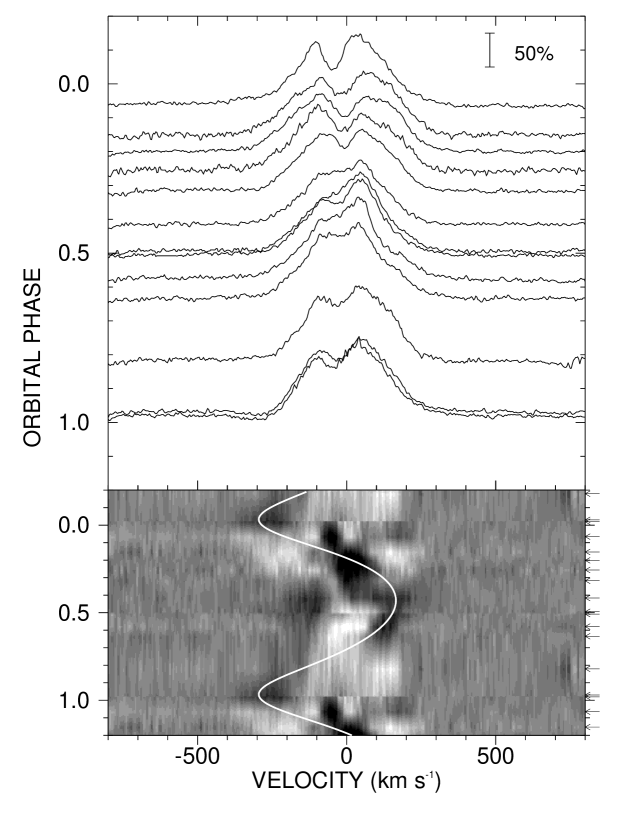
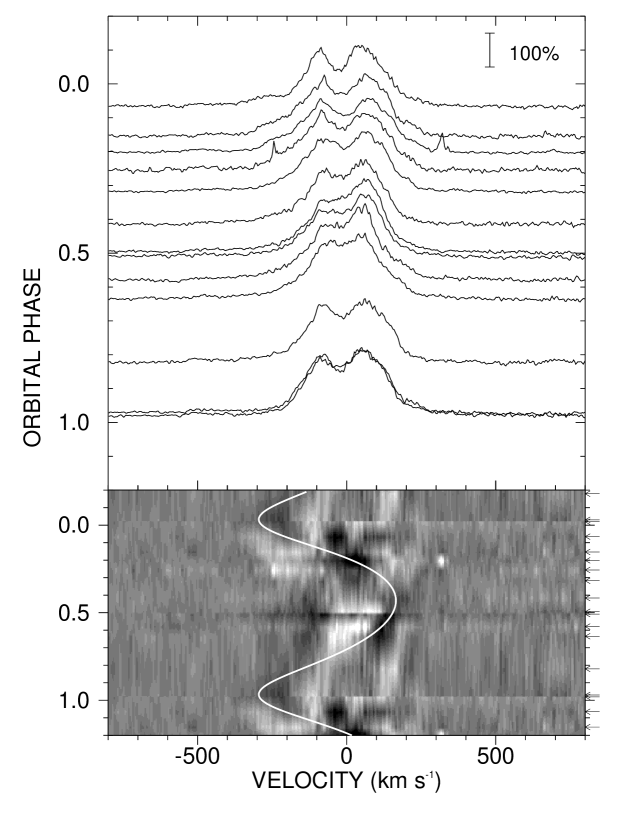
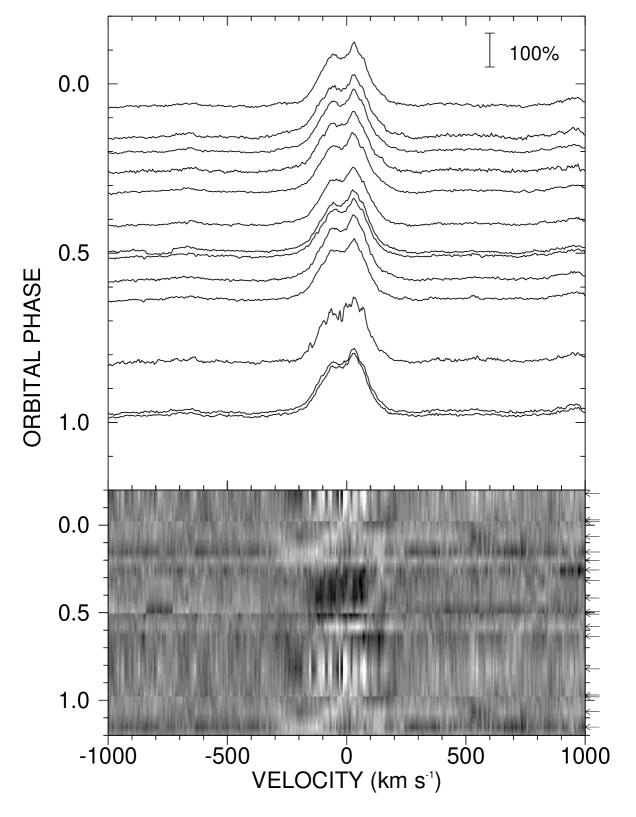
Some of the strongest emission features in the optical spectrum of HDE 326823 are the He I lines (Borges Fernandes et al. 2001). We show the He I profiles in Figure 4 as a function of radial velocity and orbital phase. The emission line appears relatively constant and is always double-peaked, similar to those observed in the spectra of Be stars where the flux originates in a circumstellar disk (Porter & Rivinius 2003). However, to emphasize the subtle variations related to phase, we subtracted the average profile from the observations to produce a phase-interpolated, grayscale depiction of the difference spectra that appears in the lower panel of Figure 4. The difference spectra exhibit an absorption subfeature that moves in the same way as found for the N II absorption lines (the N II radial velocity curve is overplotted as a white line). We interpret this as the photospheric He I absorption line of the visible star. In §4 we discuss several other subtle, phase-related variations, such as the well-defined, red edge of the emission that first appears near phase 0.7 and progresses linearly blueward until near phase 0.4. Similar line and grayscale difference plots for He I are shown in Figures 5 and 6, respectively, and these show variations similar to the case of He I .
Remarkably, the bulk of the emission in He I shows no evidence of the orbital Doppler shifts we found for the N II absorption lines (§3.3). We checked this absence of motion by measuring the radial velocity of the steep line wings of He I using a line bisector method (Shafter et al. 1986). The bisector velocities are determined by cross-correlating the observed profile with a template formed of oppositely signed Gaussian functions with FWHM = 75 km s-1 at offset positions of km s-1. The zero-crossing of the resulting cross-correlation function yields the bisector velocities that are listed in Table 3 and plotted as plus signs in Figure 3. Typical uncertainties for these velocities are km s-1 for the echelle data and km s-1 for the lower resolution Cassegrain spectra. We see a small amplitude variation in the opposite sense to that of the N II absorption lines that we attribute to the influence of the weak He I absorption component that causes an apparent reduction in the emission wing flux at the Doppler shift extrema. Thus, we conclude that the He I feature is well explained by the superposition of a kinematically static emission line and an orbitally-modulated absorption component from the visible supergiant.
The other remarkable fact is the near constancy of the He I emission strength indicating the emission source is never substantially occulted by the stars over the course of the orbit. We measured the net equivalent width of the feature by a numerical integration from to km s-1 across the profile. The larger, positive boundary necessarily includes the Na I line because the resolution of the R-C spectrograph blends the red wing of He I with the blue emission wing of Na I . The entire Na D component remains approximately constant and makes a negligible contribution to the variability of He I (see Fig. 4). The formal errors associated with these equivalent width measurements are for all of these data, primarily set by lower signal-to-noise in the echelle data and by uncertain continuum placement in the Cassegrain spectra (due to the large number of unresolved emission lines). These measurements are listed in Table 3 and are plotted in Figure 7. There is a systematic 1.1 Å difference in the average equivalent width for the two data sets that is due to differences in continuum placement. If the absolute emission flux remains constant throughout the orbit, then we would expect to observe an apparent change that varies as the inverse of the continuum flux. We overplot in Figure 7 scaled versions of the inverse of the flux from the smoothed ASAS -band light curve, and we see that the equivalent width variations are similar to those expected for a constant emission line flux relative to a changing continuum. This indicates that the emission source remains clearly visible throughout the orbit.
3.4.2 H
HDE 326823 is extremely hydrogen deficient with a H mass fraction of 3% (Marcolino et al. 2007), and the only hydrogen lines observed in the optical spectrum are H and H (Borges Fernandes et al. 2001). We show in Figure 8 the phase-related behavior of H observed in echelle spectroscopy from 2010. The feature appears more or less constant throughout the orbit, a property confirmed in the set of Cassegrain spectra.
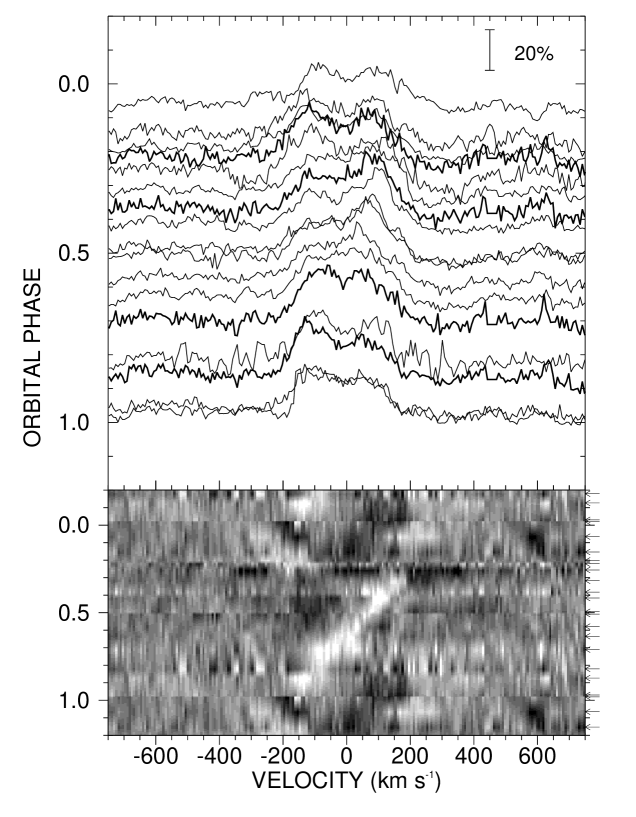
3.4.3 Metal Lines
There are several Fe II emission lines in our spectra of HDE 326823 that are weak, double-peaked features. In general, the S/N ratio of our data is too low to investigate the orbital-related variations in these lines, but we show one example in Figure 9. This emission feature is identified by Borges Fernandes et al. (2001) as a blend of Fe II , Si II , and Ni II . We see some evidence of changes in the blue and red emission peak strength, and the difference profiles shown in the lower panel suggest a progressive flux shift from the red to blue emission extremes between orbital phases 0.3 and 0.9. Our interpretation will be discussed in §4.
4 Discussion
The facts that have emerged from our spectroscopic analysis are striking and challenging. HDE 326823 is a short period binary with a massive, yet unseen companion. The low H abundance of the visible star (Marcolino et al. 2007) indicates that it has lost a significant fraction of its outer envelope, and the presence of strong emission lines indicates the presence of circumstellar gas from ongoing mass loss. All these properties suggest that HDE 326823 is an interacting binary which is experiencing active mass transfer. Here we propose that HDE 326823 is related to the W Serpentis class of massive binaries (Tarasov 2000), systems in which the mass donor appears as the visible, lower mass component and the more massive, mass gainer is hidden behind a thick accretion torus (Nazarenko & Glazunova 2006).
The mass function (Table 2) indicates that the total mass of the system is large,
where the mass ratio is and the subscripts 1 and 2 denote the visible and unseen companion star, respectively. Both the terms involving and on the right hand side of the expression are greater than unity, so the total mass is potentially very large. On the other hand, Marcolino et al. (2007) found that the total luminosity of HDE 326823 corresponds to that of a single star with an initial mass of , and this suggests that the mass ratio term should be relatively small or, equivalently, . This agrees with our expectation that the visible mass donor has lost most of its mass to the gainer and that the mass ratio has reversed. We can make an initial estimate of the mass ratio by comparing the projected rotational velocity to the orbital semiamplitude (Gies & Bolton 1986),
This expression relates the size of the visible star to the Roche radius (Eggleton 1983) through a fill-out factor ( for a Roche filling star), and the angular rotational rate is expressed relative to the synchronous rate through factor . Based upon the absorption line profiles published by Borges Fernandes et al. (2001; see their Fig. 5), we estimate that km s-1 (or smaller if the line broadening is significantly influenced by macroturbulence) from a visual estimate of the FWHM of the profile. We assume that the visible star fills its Roche lobe at periastron (based upon evidence of mass transfer and mass loss), so that the average fill-out factor is . Furthermore, we imagine that tidal forces have acted to force the star into the synchronous rotation rate that occurs at periastron (when tides peak), and therefore, . Then the expression above can be solved for the mass ratio, , which is again consistent with the mass ratio reversal expected for the advanced stage of evolution of this binary.
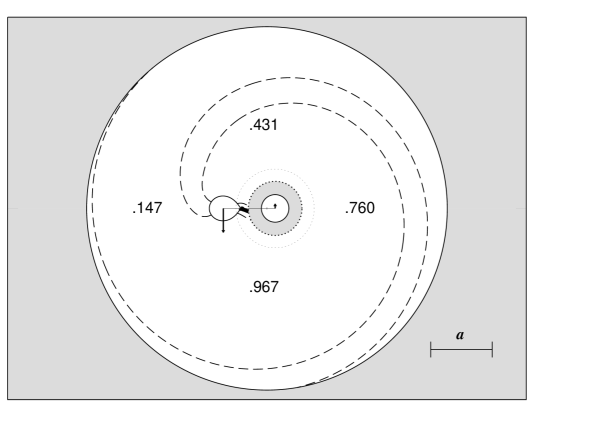
We present a graphic representation of the system geometry in Figure 10 that shows the binary as viewed from above the orbital plane. For the purposes of this diagram, we adopt and , which leads to masses of and . The central binary is drawn to a scale for the time of minimum separation at periastron. The visible star (left) is assumed to fill its Roche surface at periastron, and the companion star (right) is shown with a radius of , appropriate for a main sequence star with the adopted mass (Martins et al. 2005). Arrows centered in each star represent their orbital velocity about the center of mass (indicated by a tick mark within the figure of the companion), and the numbers in each quadrant surrounding the binary give the orbital phase corresponding to the direction to the observer.
We suggest that many of the properties of HDE 326823 can be understood in the context of the mass transfer and mass loss processes observed in other W Ser systems such as Lyr (Zhao et al. 2008) and RY Sct (Grundstrom et al. 2007). The visible star in such systems is losing mass by Roche lobe overflow (RLOF) to the companion. Mass transfer is accompanied by angular momentum transfer that can spin-up the companion to the critical speed where it can no longer easily accrete additional gas. The gas then accumulates in a thick torus that surrounds and obscures the companion star. The RLOF is indicated in Figure 10 by thick and thin stream lines between the stars, while the torus is shown as a shaded region surrounding the companion (out to an assumed radius of of the companion’s Roche lobe). The large optical depth of the torus gas is the probable explanation for the absence of the companion’s spectral features in the observed spectrum.
Hydrodynamical models by Nazarenko & Glazunova (2006) suggest that mass loss from the binary can occur through the loss of torus gas through the L3 region and through the lower gravitational potential region around L2 on the far side of the mass donor. We show in Figure 10 example trajectories of the gas leaving the donor through the L2 region (left of mass donor). These were calculated in the restricted three-body approximation ignoring the small eccentricity of the orbit. This mass stream feeds a circumbinary disk (outer shaded region in Fig. 10) with an inner radius of (where is the semimajor axis) that corresponds to the innermost stable orbit according to the calculations of Pichardo et al. (2008).
We suspect that the emission lines in the spectrum of HDE 326823 form in the circumbinary disk of the system. This location is consistent with the lack of observed binary orbital motion, the large volume of formation, cooler gas conditions, and Keplerian motion that are required to explain the double-peaked emission profiles of H and the He I and Fe II lines. The projected Keplerian rotational velocity of circumbinary disk gas as a function of distance from the binary is given by
Thus, the highest emission speed we would expect in the model for circumbinary gas would occur for the inner disk boundary at , or km s-1 (for ). This is consistent with the He I profiles that have an average half-width at half-maximum of 146 km s-1 (see Fig. 4).
A circumbinary disk being fed through the L2 point would explain two observed features in the He I profiles. We see an excess of blue-shifted emission near phase 0.2 (Fig. 4). From our depiction of the binary (Fig. 10), this phase corresponds to times where the mass stream that is ejected from L2 appears in the foreground with negative radial velocity. As the gas stream moves away from L2 and lags behind the binary motion, the velocities within the outward spiral will become closer to the Keplerian speeds given above. Thus, the fastest motions we observe at any given orbital phase will correspond to the projected gas speed in the part of spiral with the largest projected separation from the central binary. Since this separation will increase and the associated Keplerian velocity decrease with advancing phase, we might expect to observe a gradual decline in the wing velocity that is similar to what we observe after phase 0.0 in the blue wing and especially after phase 0.5 in the red wing of He I (see Fig. 4).
The binary scenario may also explain the lack of H variability (§3.4.2) and the orbital phase-dependent behavior of the metal lines (§3.4.3). We suggest that all these emission lines form in the circumbinary disk, since they are generally constant in radial velocity. Unlike the He I emission lines, there is no apparent photospheric component crossing H (Fig. 8), and this may be due to the low H abundance in the atmosphere of the mass donor. We suspect that Fe II formation is favored in the somewhat cooler and dense gas conditions of the circumbinary disk, and the donor star’s atmosphere may be too hot to produce any photospheric Fe II absorption lines. Indeed, Marcolino et al. (2007) found that models for the star alone were characterized by higher ionization states in the atmosphere (Fe III and Fe IV), so the presence of a somewhat cooler circumbinary disk offers a reasonable explanation for the presence of the Fe II emission lines. The moving emission peak observed in Fe II (Fig. 9) may result from a gas density enhancement that occurs where the spiral stream from L2 meets the inner boundary of the circumbinary disk (lower, left part of the boundary in Fig. 10). If the disk thickness and inclination act to restrict our view to the far side of the inner cavity, then we would expect to observe this over-dense part of the boundary with maximum redshift near phase 0.4 and maximum blueshift near phase 0.9, more or less in agreement with the emission shift observed in the Fe II difference profiles (Fig. 9).
We think that the binary model can also explain qualitatively the main features of the -band light curve (Fig. 1). Since the visible star fills or nearly fills its Roche surface, it will be tidally distorted and will display a characteristic ellipsoidal flux variation as we view the wide and narrow dimensions of the star with changing orbital phase. According to the binary geometry shown in Figure 10, we expect to observe maxima near phases 0.97 and 0.43 and minima near phases 0.15 and 0.76, and these phases correspond to the observed extrema in the light curve. Furthermore, if the accretion torus is a significant contributor to the continuum flux, then changes in the torus size with the elliptical orbit may affect the light curve. For example, increased mass transfer at periastron followed by increasing binary separation to apastron may allow the optically thick torus to increase in size (to a radius shown by the dotted line in Fig. 10), and consequently the torus flux contribution would increase over the interval from phase 0.0 to 0.5. This may explain why the maximum at phase 0.43 is brighter than the maximum at phase 0.97. A detailed model of these flux variations should provide an estimate of the binary inclination, since the amplitude of the ellipsoidal variation varies as while the amplitude of the torus size variation varies as (in the thin disk limit).
We explored three other explanations of the periodic variations, but none of these were satisfactory in the end. First, suppose that HDE 326823 is a triple system consisting of a single LBV star with a distant 6 d binary. This picture agrees with the radial velocity constancy of the emission lines, but it is inconsistent with the apparent changes in the emission line wing morphology with orbital phase (Figs. 4, 5, and 6). Second, perhaps the emission lines originate in the accretion torus surrounding the mass gainer star and the mass ratio is so extreme that the gainer’s orbital motion is negligible. However, in this case the Keplerian gas motion in the torus would be very large because the gas is so close to the massive gainer star, and we would expect the emission line widths to exceed the semiamplitude of the binary companion. This is opposite to our results that show that the binary semiamplitude ( km s-1) is much larger than the characteristic half-width at half-maximum of the emission lines ( km s-1 for He I 5876, with similar values for other species). Lastly, consider the possibility that HDE 326823 is a single star with a magnetically channeled wind that is observed at different orientations as the star rotates (Townsend & Owocki 2005; Ud-Doula et al. 2009). Suppose that the magnetic and spin axes are slightly misaligned (the oblique rotator model; Shore & Brown 1990) and that the outflow is observed in spectral lines as the magnetic pole transits the visible hemisphere. However, in the spectral lines of magnetically active massive stars, the wind material appears in absorption when its projected velocity falls within and in emission at larger velocities. This is not the case in the spectrum of HDE 326823 where the N II absorption features are Doppler shifted far beyond their characteristic line width.
5 Summary
Our spectroscopic results demonstrate that HDE 326823 is a close, interacting binary with a 6.123 d orbital period that was originally found in ASAS light curve. We propose that the visible star (which has a spectrum similar to that of a B-supergiant) is the mass donor, and it is transferring mass to a more massive gainer star that is enshrouded in a thick accretion torus. In addition, mass loss is occurring through both the L2 and L3 Lagrangian points into a large, circumbinary disk that is the source of the stationary emission lines. The complex light curve probably results from a combination of the tidal distortion of the mass donor and variations in the size of the accretion torus related to the elliptical orbit.
HDE 326823 bears many similarities to other W Serpentis interacting binaries that are experiencing a phase of dramatic mass transfer. However, its orbital period is shorter than that of most W Serpentis binaries (with the possible exception of BD with d; Williams et al. 2009), and because mass transfer leads to an increasing period after mass ratio reversal, HDE 326823 may have emerged from its closest, most intense interaction. Further analysis of a long term light curve could yield a value for a changing period and yield an estimate of the mass transfer rate. The spectral properties of HDE 326823 are perhaps most closely matched in the massive LBV MWC 314 that is also a binary with a 60.85 d period (Muratorio et al. 2008; Lobel et al. 2012). Lobel et al. (2012) find radial velocity variations in one set of absorption lines, while the double-peaked emission lines are constant in velocity, again suggesting a RLOF binary surrounded by a circumbinary disk.
There are other known examples of luminous stars that are LBV candidates and that display prominent Fe II emission lines in their spectra (Walborn & Fitzpatrick 2000; Massey et al. 2007), and some of these may in fact be binaries with circumbinary disks like HDE 326823. However, we caution that the appearance of Fe II emission only signifies the presence of relatively cool, dense, circumstellar gas, and such an environment might be attained in a dense stellar wind rather than in a circumbinary disk. Verification of the similar binary nature of such targets will require high resolution, multiple-epoch spectroscopy to search for evidence of orbital Doppler shifts and to check for the presence of double-peaked and stationary emission lines.
These new spectroscopic observations of HDE 326823 support the idea that some WR stars can be formed in a binary system through envelope loss by mass transfer. In this picture, the initially more massive star will expand to fill its Roche Lobe and begin mass transfer onto the smaller star. The mass donor will lose its hydrogen envelope and develop a WR spectrum. The mass gainer will emerge as an O-type star, with a large mass and high effective temperature. HDE 326823 may evolve into a system like Vel (North et al. 2008), where the mass donor is now observed as a hydrogen stripped WR star, that is orbiting a more massive O star. Assuming that this binary history is correct, it is unlikely that the donor star in HDE 326823 experienced a RSG or LBV episode in the past since both kinds of objects have radii much larger than the current binary separation. HDE 326823 is likely experiencing a short, late stage of binary evolution, and it represents an important opportunity to explore the mass loss processes that occur at this juncture.
References
- Borges Fernandes et al. (2001) Borges Fernandes, M., de Araújo, F. X., Bastos Pereira, C., & Codina Landaberry, S. J. 2001, ApJS, 136, 747
- Eggleton (1983) Eggleton, P. P. 1983, ApJ, 268, 368
- Gies & Bolton (1986) Gies, D. R., & Bolton, C. T. 1986, ApJ, 304, 371
- Grundstrom et al. (2007) Grundstrom, E. D., Gies, D. R., Hillwig, T. C., et al. 2007, ApJ, 667, 505
- Hillier & Miller (1998) Hillier, D. J., & Miller, D. L. 1998, ApJ, 519, 354
- Howell et al. (2006) Howell, S. B., Walter, F. M., Harrison, T. E., et al. 2006, ApJ, 652, 709
- Lanz & Hubeny (2007) Lanz, T., & Hubeny, I. 2007, ApJS, 169, 83
- Lobel et al. (2012) Lobel, A., Groh, J., Torres, K., Gorlova, N., & Martayan, C. 2012, in Four Decades of Research on Massive Stars, A Scientific Meeting in the Honour of Anthony Moffat, ed. C. Robert, N. St-Louis, & L. Drissen (San Francisco: ASP), in press
- lopes (1992) Lopes, D. F., Damineli Neto, A., & de Freitas Pacheco, J. A. 1992, A&A, 261, 482
- Manfroid et al. (1995) Manfroid, J., Sterken, C., Cunow, B., et al. 1995, A&AS, 109, 329
- Marcolino et al. (2007) Marcolino, W. L. F., de Araújo, F. X., Lorenz-Martins, S., & Borges Fernandes, M. 2007, AJ, 133, 489
- Martins et al. (2005) Martins, F., Schaerer, D., & Hillier, D. J. 2005, A&A, 436, 1049
- Massey et al. (1981) Massey, P., Conti, P. S., & Niemela, V. S. 1981, ApJ, 246, 145
- Massey et al. (2007) Massey, P., McNeill, R. T., Olsen, K. A. G., et al. 2007, AJ, 134, 2474
- Meynet (2003) Meynet, G., & Maeder, A. 2003, A&A, 404, 975
- Morbey & Brosterhus (1974) Morbey, C. L., & Brosterhus, E. B. 1974, PASP, 86, 455
- Muratorio et al. (2008) Muratorio, G., Rossi, C., & Friedjung, M. 2008, A&A, 487, 637
- Nazarenko & Glazunova (2006) Nazarenko, V. V., & Glazunova, L. V. 2006, Astr. Rep., 50, 369
- North et al. (2007) North, J. R., Tuthill, P. G., Tango, W. J., & Davis, J. 2007, MNRAS, 377, 415
- Pichardo et al. (2008) Pichardo, B., Sparke, L. S., & Aguilar, L. A. 2008, MNRAS, 391, 815
- Pojmański (2002) Pojmański, G. 2002, Acta Astron., 52, 397
- Pojmański & Maciejewski (2004) Pojmański, G., & Maciejewski, G. 2004, Acta Astron., 54, 153
- Porter & Rivinius (2003) Porter, J. M., & Rivinius, T. 2003, PASP, 115, 1153
- Scargle (1982) Scargle, J. D. 1982, ApJ, 263, 835
- Shafter et al. (1986) Shafter, A. W., Szkody, P., & Thorstensen, J. R. 1986, ApJ, 308, 765
- Shore & Brown (1990) Shore, S. N., & Brown, D. N. 1990, ApJ, 365, 665
- Shore et al. (1990) Shore, S. N., Brown, D. N., Bopp, B. W., et al. 1990, ApJS, 73, 461
- Smith et al. (2011b) Smith, N., Gehrz, R. D., Campbell, et al. 2011b, arXiv:1105.2329
- Smith et al. (2011a) Smith, N., Li, W., Silverman, J. M., Ganeshalingam, M., & Filippenko, A. V. 2011a, MNRAS, 415, 773
- Smith & Owocki (2006) Smith, N., & Owocki, S. P. 2006, ApJ, 645, L45
- Sterken (1993) Sterken, C., Manfroid, J., Anton, K., et al. 1993, A&AS, 102, 79
- Sterken (1995b) Sterken, C., Manfroid, J., Beele, D., et al. 1995b, A&AS, 113, 31
- Sterken (1995a) Sterken, C., Stahl, O., Wolf, B., Szeifert, T., & Jones, A. 1995a, A&A, 303, 766
- Tarasov (2000) Tarasov, A. E. 2000, in ASP Conf. Ser. 214, The Be Phenomenon in Early-Type Stars, ed. M. A. Smith, H. F. Henrichs, & J. Fabregat (San Francisco: ASP), 644
- Townsend & Owocki (2005) Townsend, R. H. D., & Owocki, S. P. 2005, MNRAS, 357, 251
- Ud-Doula et al. (2009) Ud-Doula, A., Owocki, S. P., & Townsend, R. H. D. 2009, MNRAS, 392, 1022
- van Genderen (2001) van Genderen, A. M. 2001, A&A, 366, 508
- Walborn & Fitzpatrick (2000) Walborn, N. R., & Fitzpatrick, E. L. 2000, PASP, 112, 50
- Williams et al. (2009) Williams, S. J., Gies, D. R., Matson, R. A., & Huang, W. 2009, ApJ, 696, L137
- Zhao et al. (2008) Zhao, M., Gies, D., Monnier, J. D., et al. 2008, ApJ, 684, L95
- Zucker (2003) Zucker, S. 2003, MNRAS, 342, 1291


| Date | Orbital | ||
|---|---|---|---|
| (HJD2,450,000) | Phase | (km s-1) | (km s-1) |
| 4623.8538 | 0.2323 | 59.5 | 5.7 |
| 4624.8424 | 0.3938 | 184.6 | 5.9 |
| 4626.8519 | 0.7220 | 6.7 | 4.0 |
| 4627.8460 | 0.8844 | 252.9 | 4.2 |
| 5327.8527 | 0.2122 | 31.6 | 3.6 |
| 5339.8048 | 0.1643 | 40.2 | 8.5 |
| 5348.8753 | 0.6457 | 63.0 | 5.8 |
| 5377.5490 | 0.3288 | 68.8 | 20.0 |
| 5387.6646 | 0.9810 | 276.3 | 4.7 |
| 5406.6203 | 0.0769 | 216.8 | 4.6 |
| 5409.6502 | 0.5717 | 110.8 | 8.0 |
| 5413.6381 | 0.2231 | 87.2 | 3.3 |
| 5429.6113 | 0.8319 | 166.1 | 10.0 |
| 5430.5901 | 0.9917 | 262.7 | 7.8 |
| 5444.5214 | 0.2670 | 57.2 | 3.4 |
| 5446.5006 | 0.5903 | 108.7 | 6.1 |
| Element | Value |
|---|---|
| (d) | 6.1228aaFixed to value obtained from analysis of ASAS photometry (§2). |
| (HJD – 2,400,000) | |
| (deg) | |
| (km s-1) | |
| (km s-1) | |
| () | |
| () | |
| r.m.s. (km s-1) | 29.3 |
| HJD | aaThe measurements include Na D emission and absorption, since the He I and Na D features are blended in the lower resolution R-C spectra. | |||
|---|---|---|---|---|
| 2,400,000 | Phase | Spectrograph | (Å) | (km s-1) |
| 54552.698 | 0.611 | R-C | 9.06 | 31.3 |
| 54587.861 | 0.354 | R-C | 8.20 | 36.0 |
| 54600.788 | 0.465 | R-C | 9.70 | 2.2 |
| 54623.846 | 0.231 | echelle | 8.13 | 13.8 |
| 54624.835 | 0.392 | echelle | 6.23 | 14.2 |
| 54626.844 | 0.721 | echelle | 8.40 | 6.7 |
| 54627.838 | 0.883 | echelle | 8.39 | 12.7 |
| 54638.821 | 0.677 | R-C | 10.02 | 4.5 |
| 54642.773 | 0.322 | R-C | 8.91 | 8.9 |
| 54647.788 | 0.141 | R-C | 10.50 | 22.5 |
| 54652.770 | 0.955 | R-C | 9.27 | 5.6 |
| 54682.716 | 0.846 | R-C | 10.97 | 4.0 |
| 54690.703 | 0.150 | R-C | 10.40 | 30.3 |
| 54902.828 | 0.795 | R-C | 10.48 | 6.1 |
| 54926.868 | 0.722 | R-C | 11.42 | 12.6 |
| 54984.862 | 0.194 | R-C | 9.91 | 38.8 |
| 54991.812 | 0.329 | R-C | 8.28 | 17.6 |
| 55020.802 | 0.063 | R-C | 9.95 | 2.3 |
| 55070.652 | 0.205 | R-C | 10.08 | 24.6 |
| 55111.530 | 0.882 | R-C | 9.59 | 10.6 |
| 55124.516 | 0.002 | R-C | 9.05 | 2.3 |
| 55325.864 | 0.887 | R-C | 9.51 | 9.2 |
| 55327.853 | 0.212 | echelle | 9.76 | 17.3 |
| 55335.854 | 0.519 | echelle | 8.03 | 1.2 |
| 55339.805 | 0.164 | echelle | 9.60 | 21.8 |
| 55346.866 | 0.317 | R-C | 9.48 | 23.9 |
| 55348.875 | 0.646 | echelle | 8.77 | 3.3 |
| 55358.505 | 0.218 | R-C | 9.72 | 17.6 |
| 55377.549 | 0.329 | echelle | 7.89 | 14.0 |
| 55378.634 | 0.506 | echelle | 8.81 | 5.4 |
| 55387.665 | 0.981 | echelle | 9.37 | 1.2 |
| 55385.828 | 0.681 | R-C | 10.27 | 12.3 |
| 55406.620 | 0.077 | echelle | 8.01 | 1.2 |
| 55429.611 | 0.832 | echelle | 9.37 | 1.8 |
| 55430.590 | 0.992 | echelle | 9.36 | 20.5 |
| 55444.521 | 0.267 | echelle | 9.14 | 12.3 |
| 55445.502 | 0.427 | echelle | 6.92 | 19.2 |
| 55446.501 | 0.590 | echelle | 9.10 | 5.6 |