The peer reviewed version of the following article has been published in final form at J. Phys. Chem. B, 2010, 114, 14426, doi: 10.1021/jp1012347.
Spin Signatures of Photogenerated Radical Anions in Polymer–[70]Fullerene Bulk Heterojunctions: High Frequency Pulsed EPR Spectroscopy
Abstract
Charged polarons in thin films of polymer–fullerene composites are investigated by light-induced electron paramagnetic resonance (EPR) at 9.5 GHz (X-band) and 130 GHz (D-band). The materials studied were poly(3-hexylthiophene) (PHT), [6,6]-phenyl-C61-butyric acid methyl ester (\ceC60-PCBM), and two different soluble \ceC70-derivates: \ceC70-PCBM and diphenylmethano[70]fullerene oligoether (\ceC70-DPM-OE). The first experimental identification of the negative polaron localized on the \ceC70-cage in polymer–fullerene bulk heterojunctions has been obtained. When recorded at conventional X-band EPR, this signal is overlapping with the signal of the positive polaron, which does not allow for its direct experimental identification. Owing to the superior spectral resolution of the high frequency D-band EPR, we were able to separate light-induced signals from P+ and P- in PHT–\ceC70 bulk heterojunctions. Comparing signals from \ceC70-derivatives with different side-chains, we have obtained experimental proof that the polaron is localized on the cage of the \ceC70 molecule.
I Introduction
Photovoltaic (PV) cells are the most promising man-made devices for direct solar energy utilization. In analogy with natural photosynthesis, the key steps in PV solar energy conversion are the generation, separation, and extraction of charges. PV systems can be classified into three big groups based on the active media: inorganic, organic, and hybrid devices. In spite of the fact that organic based PVs did not demonstrate competitively high conversion efficiency so far, they are considered as a high potential option with many attractive features like low cost fabrication and tunability of electronic properties of organic materials. Recently, a considerable improvement of the efficiency in the range of 8% has been recorded for PVs based on conjugated polymer–fullerene composites Green et al. (2010). In general, by blending the conjugated polymer and fullerenes, efficient light-induced charge separation (CS) can be achieved, thus making these materials attractive for solar energy conversion Sariciftci et al. (1992); Morita et al. (1992).
As it was demonstrated for natural photosynthesis, an extremely effective technique for investigation of the light-induced generation, separation, and recombination of the charge carriers is the advanced electron paramagnetic resonance (EPR) technique, such as light-induced, multifrequency, time-resolved, pulsed, high frequency EPR Borbat et al. (2001); Poluektov et al. (2005). Light-induced EPR (LEPR) has been extensively used to characterize the electronic structure of the charges in composites of poly[2-methoxy-5-(3’,7’-dimethyloctyloxy)-1,4-phenylenevinylene] and [6,6]-phenyl-\ceC61-butyric acid methyl ester (\ceC60-PCBM), a soluble derivative of \ceC60 Dyakonov et al. (1999). Under illumination of the sample, two paramagnetic species are formed due to photoinduced CS between conjugated polymer and fullerene. They are the positive, P+, and the negative, P-, polarons on the polymer backbone and \ceC60-cage, respectively. EPR spectra of these species were completely resolved and characterized using high spectral resolution of the high frequency (HF) EPR Ceuster et al. (2001); Aguirre et al. (2008).
One of the downsides of the \ceC60-PCBM acceptor material for photovoltaic applications is a very low absorption coefficient in the visible spectral region and, as a consequence, a relatively small contribution to the photocurrent. The substitution of the \ceC60 by \ceC70 fullerene considerably improves the photocurrent due to the low symmetry of the \ceC70 molecules and thus higher absorption coefficient in the visible region Wienk et al. (2003).
While the understanding of the elementary steps of the efficient charge separation and charge stabilization in the photovoltaic materials is a prerequisite for improving the efficiency of the organic PV cells, there is little known on the photophysics in \ceC70 containing composites. VIS-NIR spectra of \ceC70 anions obtained by reduction using potassium in tetrahydrofuran solution as well low frequency (LF) EPR studies were reported more than a decade ago Gherghel and Baumgarten (1995). Recent studies of fullerene \ceC70 and \ceC60 dimers revealed additional photoinduced absorption and LF EPR features due to \ceC70 fullerenes Delgado et al. (2009).
Here, we report on the photoinduced CS state in polymer–\ceC70-fullerene composites. This is the first characterization of the CS polaron states (radical anion and cation) in \ceC70-based polymer–fullerene heterojunctions by high frequency (130 GHz) LEPR. Having high spectral resolution, the HF LEPR allows identification of the spectra of the positive polaron localized on the polymer and the negative one on the fullerene cage.
The LEPR spectra of the polymer–\ceC70-fullerene blends studied with the conventional X-band (9.5 GHz) technique were found to be significantly different from those of polymer–\ceC60-PCBM and poorly resolved, which makes the direct identification of the CS species speculative. To clarify this issue, we have carried out a comparative high and low frequency LEPR study of polymer–fullerene composites.
II Experimental Section
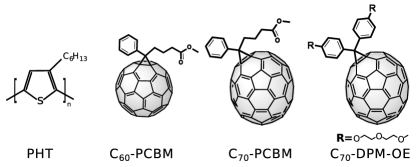
The polymer used in this work was the regioregular poly(3-hexylthiophene) (PHT, Rieke Metals), and the fullerenes were soluble derivatives \ceC60- and \ceC70-PCBM (Solenne B.V.). We have also synthesized and studied a new compound \ceC70-DPM-OE, in which each phenyl group of the diphenylmethanofullerene (DPM) moiety is decorated with a solubilizing oligoether (OE) chain. The synthesis has been carried out as reported for related compounds Riedel et al. (2005) (see the Supporting Information). The chemical structures of the materials studied are shown in Figure 1.
The PHT–fullerene composites were prepared from toluene and chlorobenzene solutions of the PHT–fullerene mixture (1:1 weight ratio) by (1) drying sample in the N2 atmosphere, (2) removing the rest of the solvent by pumping samples for 48 h, (3) annealing the sample in N2 atmosphere at 130 ∘C for 10 min. The LEPR experiments were carried out with continuous wave (cw) X-band (9.5 GHz/0.33 T) EPR (modified Bruker 200D) by using excitation of 532 nm with a cw diode-pumped solid state laser. By using the static magnetic field modulation and the lock-in techniques, cw EPR spectra were recorded as the first derivative of the absorption. High frequency EPR measurements were performed on a pulsed high frequency D-band (130 GHz/4.6 T) spectrometer equipped with a single mode cylindrical cavity TE011 Poluektov et al. (2002). EPR spectra of the composites were recorded in the pulse mode in order to get rid of the microwave phase distortion due to fast-passage effects. The absorption line shape of the EPR spectra was recorded by monitoring the electron spin echo (ESE) intensity from a two microwave pulse sequence as a function of magnetic field. The duration of the /2 microwave pulse was 40–60 ns, and typical separation times between microwave pulses were 150–300 ns. The differential line shapes of the spectra were obtained by numerical differentiation. Light excitation of the sample was achieved with an optical parametric oscillator (Opotek) pumped by a Nd:YAG laser (Quantel), the output of which was coupled to an optical fiber. The optical fiber allows delivery of up to 2 mJ per pulse to the sample. The excitation wavelength was 532 nm. The g-tensor parameters were obtained from theoretical simulation of the EPR spectra using SIMFONIA and EasySpin software Stoll and Schweiger (2006).
III Results and discussion

| -tensor | P+ in PHT | P- in \ceC60-deriv. | P- in \ceC70-deriv. |
|---|---|---|---|
| 2.00380 | 2.00058 | 2.00592 | |
| 2.00230 | 2.00045 | 2.00277 | |
| 2.00110 | 1.99845 | 2.00211 |
a) The relative error in the g-tensor measurements is 0.00005.
Prior to illumination, no EPR signals in the blends were observed. Under illumination at temperatures below 150 K, the X-band spectra of the composites containing \ceC60-derivatives show two distinct polaron signals (Figure 2a). These signals were previously assigned to photogenerated positive and negative polarons in the blends: low field signal to P+ localized on the polymer and high field signal to P- on the \ceC60-cage Sariciftci et al. (1992); Morita et al. (1992); Dyakonov et al. (1999); Ceuster et al. (2001). At lower temperatures, however, part of the signal remains persistent after switching off the excitation, as shown in Figure 2b and can be eliminated only by warming up the sampleDyakonov et al. (1999).
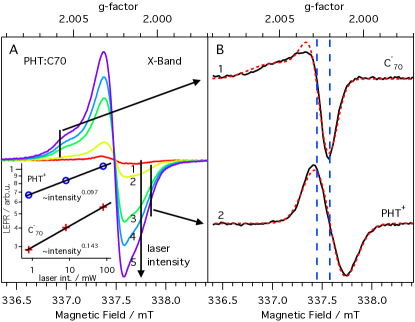
Remarkably, X-band spectra of \ceC70-based blends do not demonstrate any signal in the high field region (Figure 3). Instead, only one signal, corresponding to the low field signal in Figure 2 and being attributed to P+ (radical cation) on a PHT chain can be seen. It is slightly broadened and reveals a low field (B = 336.9 mT) shoulder. We assume the appearance of this shoulder is related to the negative polaron P- localized on \ceC70-PCBM.
In order to decompose strongly overlapping signals, the “light on–light off” method with subsequent annealing can be applied. In general, the LESR line intensity is proportional to the number of spins in the sample, which is in turn proportional to the illumination intensity. Figure 3A shows the spectral series taken in the dark, under ambient light illumination, at 0.8, 8, and 80 mW laser excitation powers, respectively. The vertical markers in Figure 3A indicate the positions (shoulders) of interest, at which the amplitudes of the spectra were determined. These values are shown in the inset to Figure 3A, indicating slightly different behavior for different parts of the EPR spectra. In particular, it is seen that, at the lowest excitation intensities, the low field shoulder is strongly suppressed. This finding was used for tentative decomposition of the LEPR to positive (PHT+) and negative (\ceC70-) polarons by normalization and subsequent subtraction, as shown in Figure 3B. The line shape and the g-value of the \ceC70- EPR spectrum obtained as described above considerably differ from those of \ceC60- in a similar composite environment. This striking observation is ambiguous, as the applied decomposition method is based on the assumption that \ceC70- and PHT+ EPR signals have different light saturation behavior. Therefore, a direct experimental confirmation is necessary.
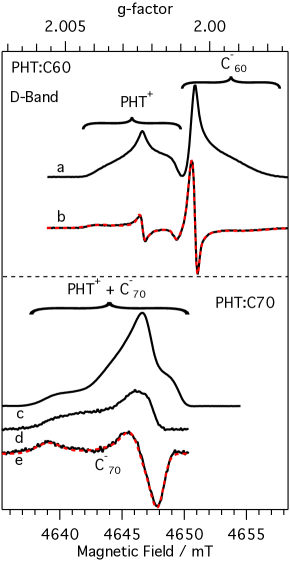
To separate overlapping signals with close g-values and to extract the parameters of the g-tensor, we applied the high field EPR technique. HF LEPR spectra of PHT–\ceC60 and PHT–\ceC70 are shown in Figure 4. The P+ and P- signals of PHT–\ceC60-PCBM composites are now completely separated (Figure 4a). Note, in a pulsed EPR experiment, the signals are detected as microwave absorption, while, in cw EPR experiments, the signals are detected as the first derivative of the absorption. For better comparison, we depicted the first derivative EPR spectrum together with the fit in Figure 4b. The signal at high field corresponds to P- and shows near axial symmetry of the g-tensor. The high field part of this signal (corresponding parallel component of the g-tensor of the P- spectrum) is very broad. Such large broadening is typical for g-strain effect, when one or another g-tensor component is distributed mainly owing to the interaction with the environment. In the first approximation, the bigger initial shift of the g-tensor component from the free electron g-tensor, ge = 2.0023, the stronger g-strain effect. The large g-strain of the gpar component reflects the sensitivity of the \ceC60- molecular orbital energy levels of unoccupied molecular orbitals (see below) to the heterogeneous environment.
The low field line (Figure 4a,b) is due to a positive polaron on the polymer chain with rhombic symmetry of the g-tensor. The low field component of P+ is also unusually broadened which might be explained by the g-strain effect as well, and sensitivity of the PHT+ energy levels of occupied orbitals (see below) to the heterogeneous environment.
The HF LEPR spectra of PHT–\ceC70-derivatives show only a broad signal at low field (Figure 4c). This signal is much more extended toward the lower field than the signal of P+ in PHT–\ceC60-derivative blends. Presumably, it consists of two overlapping spectra, one corresponding to P+ and another one to P-. As the line shape of the P+ signal, which is localized on PHT, is expected to be identical for the \ceC60 and \ceC70 composites, we can obtain a spectrum of the radical anion P- localized on \ceC70 by subtracting the low field parts of these two spectra, as shown in Figure 4d. Again, to draw parallels between cw- and pulsed-EPR, the spectrum Figure 4e is plotted as the first derivative of Figure 4d together with the fit. The residual signal demonstrates the g-tensor close to axial symmetry, with higher anisotropy compared to the polaron localized on \ceC60, which reflects lower symmetry of the \ceC70 molecule.
The signal obtained by the subtraction procedure is definitely due to a negative polaron localized on the \ceC70-PCBM molecule. However, it can be localized either on the \ceC70-cage or on the side-chain. To resolve this question, we recorded spectra from the composites of PHT–\ceC70-derivatives that differ by the side-chains (Figure 1), e.g., the \ceC70-DPM-OE. Both X- and D-band EPR spectra were found to be identical, i.e., did not depend on the chemical structure of the side-chain. Thus, we believe that the spectra in Figure 4 are due to negative polarons being localized on the \ceC70-cage. The previously identified by the subtraction technique charge transfer polaron P- (Figure 3B) is in good agreement with the spectrum measured directly by HF LESR. The g-tensor parameters of the polaronic signals are summarized in Table 1.
It is important to note that, while the components of the g-tensor of the \ceC60 anion radical are lower than the free electron g-factor, ge = 2.0023, for \ceC70-, the g-tensor components are mostly higher than ge = 2.0023. According to the classical Stone theory of g-factors Stone (1963), negative deviation of the g-factor from the free electron value is due to spin–orbit coupling with empty p- or d-orbitals, while spin–orbit coupling with occupied orbitals leads to positive deviations. The latter case is more often encountered for pure organic radicals. Thus, a difference in the g-value is an indication of the different electronic structure of molecular orbitals in \ceC60 vs \ceC70 anion radicals. Previous studies of \ceC70- in the liquid phase at room temperatures Gherghel and Baumgarten (1995); Friedrich et al. (1994) demonstrate that the average g-factor of \ceC70- is higher than the g-factor of \ceC60-.This positive shift of the g-factors in solution for \ceC70- relative to \ceC60- has been explained on the basis of the static Jahn–Teller effect Dubois et al. (1991); Adrian (1996). It is probable that Jahn–Teller dynamics in the solid phase is quite different for \ceC60 and \ceC70 molecules, which might contribute to different signs of the g-value shifts Adrian (1996). Nevertheless, there is no unified theory that can explain g-tensors of both \ceC60- and \ceC70- radicals yet. Our precise measurements of the anisotropic g-tensor of \ceC70 anion radical in the solid phase might be a reference point for developing and testing such a unified theory.
Finally, the reported pulsed HF EPR experiments were carried out on samples that were dried in the N2 atmosphere. Upon removing the solvent by evaporation, the intensities of the lines considerably decrease and almost completely disappear after annealing of the films. At the same time, narrowing of the P+ spectra was observed for all samples. We believe that this effect is connected to phase separation of the polymers and fullerenes during which leads to the higher delocalization of the polarons. A high degree of the polaron delocalization in the annealed samples is also confirmed by shortening of the relaxation time T1 as measured by the spin echo technique at HF EPR.
IV Conclusion
To summarize, we have provided the first experimental EPR identification of negative polaron (radical anion) localized on the \ceC70-cage in PHT–\ceC70-derivative composites using the LEPR technique. When recorded with conventional X-band LEPR, this signal is overlapping with the signal of the positive polaron, which does not allow for its direct identification. Owing to the superior spectral resolution of the HF (130 GHz) EPR technique, we were able to separate light-induced signals from P+ and P-. Comparing signals from \ceC70-derivatives with different side-chains, we got a confirmation that the polaron is localized on the cage of the \ceC70 molecule. The obtained g-tensor parameters are of importance, as these are the characteristics of the structure, symmetry, and dynamics of the localized/delocalized unpaired spin states.
Acknowledgements.
The work at ANL was supported as part of the ANSER, an Energy Frontier Research Center funded by the U.S. Department of Energy, Office of Science, Office of Basic Energy Sciences. The work at the University of Würzburg was supported by the German Research Foundation, DFG, within the SPP “Elementary processes in organic photovoltaics”, under contract DY18/6-1. The MICINN of Spain (project CT2008-00795/BQU, R&C program, and Consolider-Ingenio 2010C-07-25200) and the CAM (project P-PPQ-000225-0505) are also acknowledged. V.D. acknowledges financial support from ANSER during his research visit at ANL.Supporting Information Available
Chemical synthesis and spectroscopic analysis of compounds. This material is available free of charge via the Internet at http://pubs.acs.org.
References
- Green et al. (2010) M. A. Green, K. Emery, Y. Hishikawa, and W. Warta, Prog. Photovolt: Res. Appl., 18, 346 (2010).
- Sariciftci et al. (1992) N. Sariciftci, L. Smilowitz, A. Heeger, and F. Wudl, Science, 258, 1474 (1992).
- Morita et al. (1992) S. Morita, A. A. Zakhidov, and K. Yoshino, Sol. State Comm., 82, 249 (1992).
- Borbat et al. (2001) P. P. Borbat, A. J. Costa-Filho, K. A. Earle, J. K. Moscicki, and J. H. Freed, Science, 291, 266 (2001).
- Poluektov et al. (2005) O. G. Poluektov, L. M. Utschig, A. A. Dubinskij, and M. C. Thurnauer, J. Am. Chem. Soc., 127, 4049 (2005).
- Dyakonov et al. (1999) V. Dyakonov, G. Zoriniants, M. Scharber, C. Brabec, R. Janssen, J. Hummelen, and N. Sariciftci, Phys. Rev. B, 59, 8019 (1999).
- Ceuster et al. (2001) J. D. Ceuster, E. Goovaerts, A. Bouwen, J. C. Hummelen, and V. Dyakonov, Phys. Rev. B, 64, 1 (2001).
- Aguirre et al. (2008) A. Aguirre, P. Gast, S. Orlinskii, I. Akimoto, E. J. J. Groenen, H. El Mkami, E. Goovaerts, and S. Van Doorslaer, Phys. Chem. Chem. Phys., 10, 7129 (2008).
- Wienk et al. (2003) M. M. Wienk, J. M. Kroon, W. J. H. Verhees, J. Knol, J. C. Hummelen, P. A. van Hal, and R. A. J. Janssen, Angew. Chem. Int. Ed., 42, 3371 (2003).
- Gherghel and Baumgarten (1995) L. Gherghel and M. Baumgarten, Synth. Met., 70, 1389 (1995).
- Delgado et al. (2009) J. Delgado, E. Espíldora, M. Liedtke, A. Sperlich, D. Rauh, A. Baumann, C. Deibel, V. Dyakonov, and N. Martin, Chem. Eur. J., 15, 13474 (2009).
- Riedel et al. (2005) I. Riedel, E. von Hauff, J. Parisi, N. Martín, F. Giacalone, and V. Dyakonov, Adv. Funct. Mater., 15, 1979 (2005).
- Poluektov et al. (2002) O. Poluektov, L. Utschig, S. Schlesselman, K. Lakshmi, G. Brudvig, G. Kothe, and M. Thurnauer, J. Phys. Chem. B, 106, 8911 (2002).
- Stoll and Schweiger (2006) S. Stoll and A. Schweiger, J. Magn. Res., 178, 42 (2006).
- Stone (1963) A. J. Stone, Proc. R. Soc. Lond. A, 271, 424 (1963).
- Friedrich et al. (1994) J. Friedrich, P. Schweitzer, K.-P. Dinse, P. Rapta, and A. Stasko, Appl. Magn. Reson., 7, 415 (1994).
- Dubois et al. (1991) D. Dubois, K. M. Kadish, S. Flanagan, R. E. Haufler, L. P. F. Chibante, and L. J. Wilson, J. Am. Chem. Soc., 113, 4364 (1991).
- Adrian (1996) F. J. Adrian, Chem. Phys., 211, 73 (1996).