CARMA Survey Toward Infrared-bright Nearby Galaxies (STING) II: Molecular Gas Star Formation Law and Depletion Time Across the Blue Sequence
Abstract
We present an analysis of the relationship between molecular gas and current star formation rate surface density at sub-kpc and kpc scales in a sample of 14 nearby star-forming galaxies. Measuring the relationship in the bright, high molecular gas surface density (20 ) regions of the disks to minimize the contribution from diffuse extended emission, we find an approximately linear relation between molecular gas and star formation rate surface density, , with a molecular gas depletion time, Gyr. We show that, in the molecular regions of our galaxies there are no clear correlations between and the free-fall and effective Jeans dynamical times throughout the sample. We do not find strong trends in the power-law index of the spatially resolved molecular gas star formation law or the molecular gas depletion time across the range of galactic stellar masses sampled ( ). There is a trend, however, in global measurements that is particularly marked for low mass galaxies. We suggest this trend is probably due to the low surface brightness , and it is likely associated with changes in CO-to-H2 conversion factor.
Subject headings:
galaxies: general — galaxies: spiral — galaxies: star formation — galaxies: ISM — ISM: molecules1. Introduction
It is well known that the star formation activity in a galaxy correlates strongly with its stellar mass or stellar surface density (Dopita & Ryder 1994; Hunter et al. 1998; Kauffmann et al. 2003; Blitz & Rosolowsky 2004, 2006), and only weakly on galaxy morphology (Boselli et al. 2001). Characterizing the relations between stellar mass, star formation rate (SFR), and gas densities over cosmic time will provide important constraints on galaxy evolution by connecting the past history, present activity, and future growth of a galaxy (Schiminovich et al. 2010).
A key factor in galaxy evolution is the rate at which molecular gas is converted to stars. Observational studies find that the relationship between SFR and gas content in galaxies can be written in the form, , where and are the SFR and gas surface densities respectively, is the normalization constant representing the efficiency of the process, and is the power-law index (Schmidt 1959; Kennicutt 1989, 1998). The gas can be atomic (HI) or molecular () or a combination of both (HI+). This relationship is generally known as the Kennicutt-Schmidt law or the star formation law, and variations on it are used as a empirical recipe in galaxy modeling (Schaye & Della Vecchia 2008; Lagos et al. 2010).
In recent years has become increasingly clear the importance of understanding the link between star formation activity and gravitationally bound molecular clouds (Wong & Blitz 2002; Tutukov 2006; Kennicutt et al. 2007; Bigiel et al. 2008; Leroy et al. 2008, hereafter L08; Blanc et al. 2009; Verley et al. 2010; Onedara et al. 2010; Bigiel et al. 2011; Schruba et al. 2011). Recent observational studies indicate a strong relationship between the HI-to- transition and the gravitational potential of the stellar disk and thus evince the connection between stellar pressure and the phase transition in the interstellar medium (Wong & Blitz 2002; Blitz & Rosolowsky 2004, 2006). Numerical simulations that include cold gas and heating from young stellar population in evolution of interstellar medium (ISM) are in general agreement with the observations (Robertson & Kravtsov 2008).
Most properties of galaxies, not least their star formation activity, are strongly correlated with mass (see Gavazzi 2009 for a review). Because new stars are born inside giant molecular clouds (GMCs), which themselves evolve within the existing galactic stellar potential (Rafikov 2001; Li et al. 2005, 2006), it is important to characterize the interconnections between stellar mass, , and SFR (see Shi et al. 2011 for a recent study). To this end, we investigate the - relation at sub-kpc and kpc scales in 14 nearby star-forming disk galaxies. While gas-SFR surface density relation provides an understanding of on-going activities in the disk, the molecular gas depletion time () provides a measure of its future evolution. It is a quantitative measure of the efficiency of the star formation activity in molecular clouds, defined as the time required for available molecular gas to be converted into stars while maintaining the existing rate of star formation (Roberts 1963; Larson et al. 1978; Kennicutt 1983; Kennicutt et al. 1994).
| Object | Hubble | Corr. | Corr. | ||||||||||||||||
|---|---|---|---|---|---|---|---|---|---|---|---|---|---|---|---|---|---|---|---|
| Type | Mpc | kpc | pc | kpc | Gyr | 6″ | 6″ | 1 kpc | 1 kpc | ||||||||||
| (1) | (2) | (3) | (4) | (5) | (6) | (7) | (8) | (9) | (10) | (11) | (12) | (13) | (14) | (15) | |||||
| NGC 628 | SA(s)c | 7.30† | 21.23 | 211 | 4.24 | 9.95 | 7.81 | 2.91 | 0.75 | -0.23 | 0.05 | 0.86 | 0.04 | … | … | +0.31 | -0.24 | ||
| NGC 772 | SA(s)b | 32.00 | 51.77 | 925 | 18.62 | 11.39 | 9.71 | 7.20 | 1.59aafootnotemark: | -0.59 | 0.19aafootnotemark: | 0.88 | 0.10a | -0.59 | 0.19 | 0.88 | 0.10 | -0.40 | -0.67 |
| NGC 1637 | SAB(rs)c | 10.92 | 11.38 | 316 | 6.35 | 9.83 | 8.25 | 2.62 | 0.84 | 0.07 | 0.11bbfootnotemark: | 0.69 | 0.08b | -0.20 | 0.22 | 1.16 | 0.13c | -0.54 | -0.66 |
| NGC 3147 | SA(rs)bc | 43.13 | 43.39 | 1247 | 25.09 | 11.36 | 9.90 | 6.16 | 1.35aafootnotemark: | -0.51 | 0.10aafootnotemark: | 0.87 | 0.05a | -0.51 | 0.10 | 0.87 | 0.05 | -0.25 | -0.62 |
| NGC 3198 | SB(rs)c | 13.70† | 21.11 | 396 | 7.97 | 10.25 | 8.14 | 1.18 | 0.28 | -0.34 | 0.16 | 1.16 | 0.09 | 0.28 | 0.03 | 0.78 | 0.02 | +0.25 | +0.09 |
| NGC 3593 | SA0/a?(s) | 5.50 | 5.12 | 159 | 3.20 | 9.81 | 8.21 | 1.98 | 1.00 | -0.60 | 0.09 | 1.20 | 0.04 | -0.65 | 0.03 | 1.23 | 0.02 | +0.37 | +0.14 |
| NGC 3949 | SA(s)bc? | 18.41 | 11.74 | 532 | 10.71 | 10.00 | 8.22 | 5.16 | 1.61 | … | … | … | … | +0.34 | -0.25 | ||||
| NGC 4254 | SA(s)c | 16.60† | 24.33 | 480 | 9.66 | 10.48 | 9.44 | 3.71 | 0.94aafootnotemark: | -0.24 | 0.06aafootnotemark: | 0.86 | 0.03a | -0.20 | 0.11 | 0.82 | 0.05 | -0.50 | -0.61 |
| NGC 4273 | SB(s)c | 33.68 | 18.50 | 974 | 19.59 | 10.35 | 9.34 | 1.41 | 0.36 | -0.01 | 0.06 | 0.93 | 0.03 | -0.01 | 0.06 | 0.93 | 0.03 | -0.24 | -0.34 |
| NGC 4536 | SAB(rs)bc | 14.40† | 20.66 | 416 | 8.38 | 10.24 | 8.95 | 1.13 | 0.37 | 0.04 | 0.10 | 0.96 | 0.05 | -0.03 | 0.11 | 0.98 | 0.06 | -0.20 | -0.25 |
| NGC 4654 | SAB(rs)cd | 14.10‡ | 17.55 | 472 | 8.20 | 10.21 | 8.77 | 2.11 | 0.54 | -0.19 | 0.05 | 0.93 | 0.03 | -0.18 | 0.07 | 0.84 | 0.04 | -0.16 | -0.37 |
| NGC 5371 | SAB(rs)bc | 35.25 | 39.89 | 1019 | 20.51 | 11.30 | 8.94 | 4.34 | 1.16 | -0.25 | 0.09 | 0.75 | 0.06 | -0.25 | 0.09 | 0.75 | 0.06 | -0.61 | -0.65 |
| NGC 5713 | SAB(rs)bc pec | 29.40† | 22.63 | 850 | 17.10 | 10.59 | 9.59 | 1.67 | 0.85 | -0.32 | 0.06 | 1.09 | 0.03 | -0.29 | 0.11 | 1.05 | 0.05 | +0.15 | 0.00 |
| NGC 6951 | SAB(rs)bc | 22.83 | 23.53 | 660 | 13.28 | 10.77 | 9.37 | 3.04 | 1.33 | -0.43 | 0.06 | 1.00 | 0.03 | -0.50 | 0.07 | 1.03 | 0.03 | +0.10 | -0.17 |
Note. — Column : Galaxy name. Column : Galaxy Morphology from the RC3 catalog (de Vaucouleurs et al. 1991). Column : Distance () in Mpc (†Prescott et al. 2007; ‡Tully et al. 2009). Column : Optical diameter () in kpc. Column : Spatial resolution () in parsec corresponding to 6″ angular resolution at the adopted distance. Column : Physical extent () of the central arc-minute (in diameter) of the disk in kpc. Column : Logarithmic stellar mass (). Column : Logarithmic molecular gas mass in estimated within including the contribution of helium. Column : Average molecular gas depletion time () and its dispersion in Gyr at 6″ resolution. Column & : Normalization constant and power-law index () of molecular gas SF law at 6″ resolution. Column & : Normalization constant and power-law index at 1 kpc resolution. Column : Spearman’s rank correlation coefficient () from - relation at 6″ resolution. Column : Spearman’s rank correlation coefficient () from - relation at 6″ resolution.
The 6″ resolution of galaxies NGC 772, NGC 3147, NGC 4273, and NGC 5371, shown in bold face, corresponds to kpc in spatial scale.
Stellar mass () in Column (7) is derived from Two Micron All Sky Survey (2MASS) -band total magnitude with a range of mass-to-light ratio, , varying from galaxy to galaxy. It is this what we call as the integrated stellar mass which incorporate the flux from the entire optical disk. The uncertainty is few percent in and .
a Parameters are derived for the surface density limit, .
b Parameters are derived from and maps with masked central region. The corresponding parameters for the unmasked central region are (-1.200.09) and (1.620.05).
c Central region was not masked at 1 kpc resolution.
In this study we measure in a sample of galaxies from the Survey Toward Infrared-bright Nearby Galaxies (STING), observed in CO with the Combined Array for Research in Millimeter-wave Astronomy (CARMA), to investigate its relation with stellar mass and various dynamical timescales associated with gravitational instability. The STING sample is composed of 23 northern (), moderately inclined (), high metallicity ( ) galaxies within 45 Mpc. These blue-sequence star-forming galaxies (Salim et al. 2007) have been selected to have uniform coverage in stellar mass (), star formation activities, and morphological types (A. D. Bolatto et al., 2011, in preparation). This is the second in a series of papers dedicated to exploiting the CO STING data set. In a previous study we investigated the impact of methodology on the determination of the spatially resolved molecular gas star formation law in NGC 4254, a member of the STING survey (Rahman et al. 2011; hereafter Paper I). In this study we explore relationships among current SFR, molecular gas, and stellar mass in normal star-forming galaxies using similar data analysis methodologies as in Paper I.
2. Data
The maps are obtained as part of the STING survey using the CARMA interferometer. While the full description of the CARMA observations will be presented in a forthcoming paper (A. D. Bolatto et al., 2011, in preparation), we briefly mention here some aspects of the interferometric data. The maps have a full sensitivity field-of-view of 2′ diameter, and are performed using a 19-pointing hexagonal mosaicing pattern with 26″ spacing. The angular resolution, measured as the full width at half maximum (FWHM) of the synthesized beam of the interferometer, varies from galaxy to galaxy in the range 3″-5″. To construct molecular gas column density maps, we use the spectral cube to produce integrated intensity maps. To avoid integrating over noisy channels we use a velocity masking technique similar to that used by the BIMA Survey of Nearby Galaxies (SONG; Helfer et al. 2003).
To construct SFR tracer maps we use mid-infrared (MIR) 24 m images from the Multi-band Imaging Photometers (MIPS; Rieke et al. 2004) instrument on board the Spitzer Space Telescope. The calibrated images are obtained from the Spitzer Heritage Archive. We further process them by masking bright point sources such as Active Galactic Nuclei (AGN) which sometimes dominate the emission in the galaxy centers. The images of NGC 1569, NGC 1637, NGC 3147, NGC 3949, NGC 5371, and NGC 6503 contain either foreground or background point sources, which we mask after visual inspection. The central regions of NGC 1637 and NGC 3198 contain bright sharply peaked point-like sources, despite the fact that galaxies are not known as AGN in the literature. The shapes of these central sources are consistent with the point spread function of the MIPS instrument, which has a FWHM of . To remove the contributions of the point sources we mask the central regions of these two galaxies. Four STING galaxies (NGC 3147, NGC 3486, NGC 4151, and NGC 5371) harbor AGN at their centers, which we also masked.
The maps of stellar mass are constructed from Two Micron All Sky Survey (2MASS; Skrutskie et al. 2006) NIR 2.2 m(-band) images. The image resolution is 2″ for -band images. At this wavelength masking of foreground and background objects was necessary for several STING sources.
3. Data Analysis
We select 14 galaxies from the 23 star-forming galaxies in the STING sample. The selection is based on secured detection, availability of data at other wavelengths, and a surface density threshold as we explain below. The subset spans stellar masses in the range . Basic information is provided in Table 1.
3.1. Molecular Gas and Star Formation Data
We carry out our data analysis at two different resolutions: a fixed angular resolution (6″), determined by our SFR indicator, and a fixed spatial scale (1 kpc), to remove biases introduced by the different distances to our objects. The high resolution near-infrared and CO images were Gaussian-convolved to have the same angular as the 24 m images. The 6″ angular resolution covers a range of physical scales in our sample, pc, corresponding to physical distances Mpc. The galaxies NGC 772, NGC 3147, NGC 4273, and NGC 5371, shown in bold face in Table 1, have distances such that 6″ corresponds to kpc in spatial scale — those galaxies are left at their native resolution in the 1 kpc analysis, while the remaining 10 galaxies are Gaussian convolved to the angular resolution corresponding to 1 kpc. All the analysis is carried out in images that have been regrid to the same pixel-scale and sampled at Nyquist-rate. We note here that, although we approximate the PSF of the MIR map as a Gaussian, the actual shape of the PSF is complex. It has prominent first and second Airy rings, with the second ring stretching out to 20″. Nevertheless, approximately 85% of the total source flux is contained within the central peak with the FWHM of 6″ (Engelbracht et al. 2007).
We construct molecular gas surface density () maps and SFR surface density () maps in a similar manner as described in Paper I. In the latter case following the prescription by Calzetti et al. (2007) who show that MIR 24 m emission can be used as a SFR tracer for galaxies of normal metallicity and where the energy output is dominated by recent star formation. The MIR 24 m SFR tracer is given by,
| (1) |
where (in ) is the luminosity spectral density at 24 m. We use a conversion factor cmto determine from . The sensitivity () of the maps varies among galaxies from 1.0 to 5.1 . The surface densities are multiplied by a factor of 1.36 to account for the mass contribution of helium.
3.2. Stellar Masses and Surface Densities
Construction of stellar surface density maps () involves two steps. First, we convert -band luminosity () to stellar mass (). We use the optical colors for our galaxies and the relations by Bell & de Jong (2003) to compute the mass-to-light ratios in each galaxy. In our sample, we find a mass-to-light ratio /. Next, each pixel of the map of a given galaxy is multiplied by the appropriate to derive the stellar mass map, i.e., . Each pixel value of the map is then divided by the area of the pixel to obtain the map. The galaxy integrated stellar masses are determined by integrating their -band 2-D surface brightness profile after masking of foreground or background objects. The NIR and MIR images were background subtracted prior to analysis. All surface densities have been inclination-corrected by applying a factor.
There are uncertainties associated with the measurements of stellar masses. Although NIR emission is a good tracer of old (Gyr) stellar populations and it experiences little internal extinction, there is uncertainty associated with the determination of mass-to-light ratios. For one, extinction affects the optical colors used in the calibration and consequently the employed mass-to-light ratio. More fundamentally, the mass-to-light ratio depends on the star formation history of the disk. Hence it varies considerably among galaxies of the same Hubble type and even within galaxies. For example, young M-supergiants near the plane of the disk (Aoki et al. 1991) as well as massive OB-associations (Regan & Vogel 1994) can contribute about of the total NIR disk emission (Rix & Rieke 1993; Regan & Vogel 1994), potentially lowering the actual mass-to-light ratio and causing us to overestimate masses by factors of .
3.3. Analysis
The sensitivity and flux recovery of the interferometric map limits the physical extent of the disk that can be studied. To minimize the effects of deconvolution and flux recovery problems we analyze the central 1′ (in diameter) of the disks. Table 1 shows the physical extent of disk () corresponding to the inner arcminute for the STING galaxies. Following the methodology developed in Paper I we set a surface density threshold of . Studying the emission from the bright regions of the molecular gas and SFR tracer maps ensures that: 1) the signal-to-noise is good, 2) interferometric deconvolution issues are minimized, 3) the potential contribution by the diffuse emission (DE) is less problematic, and 4) we focus on regions dominated by molecular gas. The DE is a component of the total disk emission that is unrelated to star formation activity and extended over the disk, in comparison to the localized emission associated with star formation. For example, a potential contributor to the DE at 24 m is infrared cirrus emission. The distribution of a galaxy can also contain DE not necessarily associated with the star-forming molecular clouds (Magnani et al. 1985; Blitz & Stark 1986; Polk et al. 1988). Below our chosen surface density limit the DE in both SFR and molecular gas tracers has the potential to affect the molecular gas-SFR surface density relation (see Paper I for a detailed discussion on this issue).
Isolating the contribution of emission related to star formation activity from widespread DE is a complex issue. Recent work has shown that the DE has a potentially important impact in the determination of the star formation law, depending on its magnitude relative to emission coming from the star formation activity (Paper I; Liu et al. 2011). In Paper I we used an unsharp masking technique to remove a diffuse extended component, and showed that the most robust measurements of the star formation law are those performed on the bright regions of the studied galaxy (NGC 4254). In those regions the contribution from DE is least significant, and the recovered star formation law was approximately linear. Here we adopt the methodology of Paper I, and minimize the impact of DE by focusing on the bright regions of our sample of disks. Finally, observational studies suggest that HI-to- phase transition occurs around (Wong & Blitz 2002; Bigiel et al. 2008; Leroy et al. 2008) and the nature of total gas-SFR surface density relation changes dramatically around this range (Kennicutt et al. 2007; Bigiel et al. 2008; L08; Schruba et al. 2011 ). By focusing on high molecular gas surface density regions we avoid this issue.
We carry out a pixel-by-pixel analysis (where the pixels are sampled at Nyquist-rate) to probe the highest possible spatial resolution. We use the Ordinary Least Square (OLS) bisector method (see Isobe et al. 1990) to fit the molecular gas-SFR surface density relation and account for the measurement errors in each variable. As discussed in Paper I, it is important to consider the impact of the sampling methodologies, fitting procedures, and measurement errors when determining the - relation. Some authors normalize at a characteristic surface density prior to regression analysis to minimize the covariance between the exponent and the normalization constant of the power-law (see Bigiel et al. 2008 and Blanc et al. 2009 in this regard). We do not apply such normalization, and we have verified that our results are robust to this choice.
In this study we use the 24 m emission as the SFR tracer because it has several advantages over other single- or multi-wavelength tracers employed in the literature (Kennicutt et al. 2007; L08; Blanc et al. 2009; Verley et al. 2010). Most importantly, 24 m images of uniform quality are available for every galaxy in our sample, and no internal extinction correction is needed for this tracer. This is a major drawback for other SFR tracers at shorter wavelengths. Second, among various tracers studied in Paper I we find that the SFR obtained from 24 m displays the tightest correlation with the molecular gas. The scatter varies in the range dex depending on the subtraction of diffuse emission. Third, there is a striking spatial correspondence between the 24 m and maps (see also Relaño & Kennicutt 2009), suggesting that 24 m is a faithful tracer of young (few million years), embedded star formation.
In the following discussion, we use to denote the power-law index of the molecular gas star formation law, where the gas includes the contribution from helium.
4. Results
At 6″ resolution our analysis includes all 14 galaxies. NGC 628 drops out of the sample at 1 kpc resolution, however, as its peak surface density falls below the selected threshold after smoothing. We have 2000 (1000) Nyquist-sampled pixel measurements arising from 14(13) galaxies at 6″ (1 kpc) resolution. The molecular gas and star surface densities span a wide range, and . Our results are presented in Figures 1-4. The first three figures highlight spatially resolved cases whereas Fig. 4 shows global quantities such as average depletion time (, mean value of within the central arcminute, calculated in the logarithm), and integrated stellar mass as given in Table 1.
4.1. Molecular Gas Star Formation Law
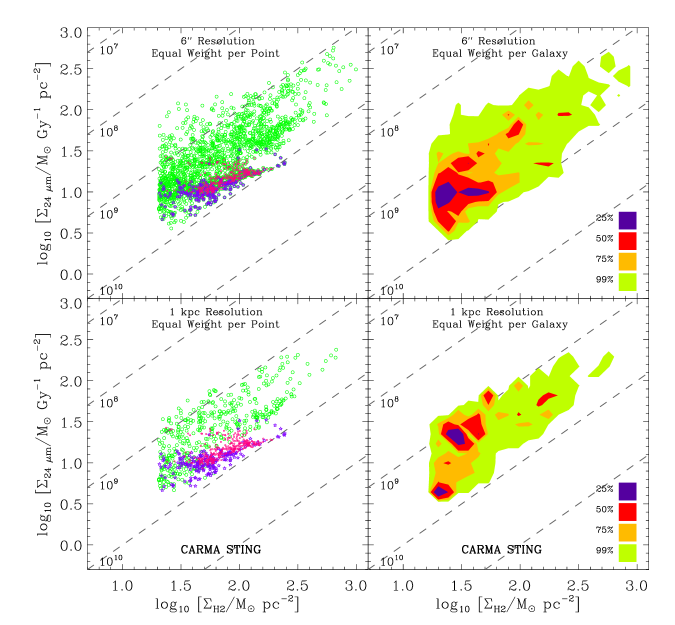
Figure 1 shows the molecular gas-SFR surface density relation at 6″ (top panels) and 1 kpc resolution (bottom panels). The diagonal dashed lines represent constant molecular gas depletion time defined as, , assuming zero recycling of the materials by massive stars into the ISM. The left panels show the scatter plots where each Nyquist-sampled pixel has equal weight in the distribution. NGC 772 (shown in violet) and NGC 3147 (magenta) create a feature in the distribution with a slower rise in with than other galaxies. We discuss this further in §4.2.
A simple correlation test shows that the points in this diagram are strongly correlated: at either resolution we find Spearman’s rank correlation coefficient . The OLS bisector method yields a power-law index 1.10.1 at either resolution, where the error is derived from bootstrapping. Despite the fact these measurements are coming from wide variety of galactic environments and galaxy properties, the ensemble of points yields an approximately linear star formation law.
To right side panels of Figure 1 provide a view of the sample that is not biased by galaxy size. In these panels any given measurement is weighted by the inverse of the total number of measurements of the galaxy to which the point belongs. Since larger galaxies contribute more points to the ensemble, the weighting scheme removes this bias by giving equal weight to each galaxy (Bigiel et al. 2011). The contours enclose 99%, 75%, 50% and 25% of the distribution. We note here that in extragalactic studies the inverse of is sometimes known as the star formation efficiency (Young & Scoville 1991; McKee & Ostriker 2007).
4.2. Molecular Gas Depletion Time
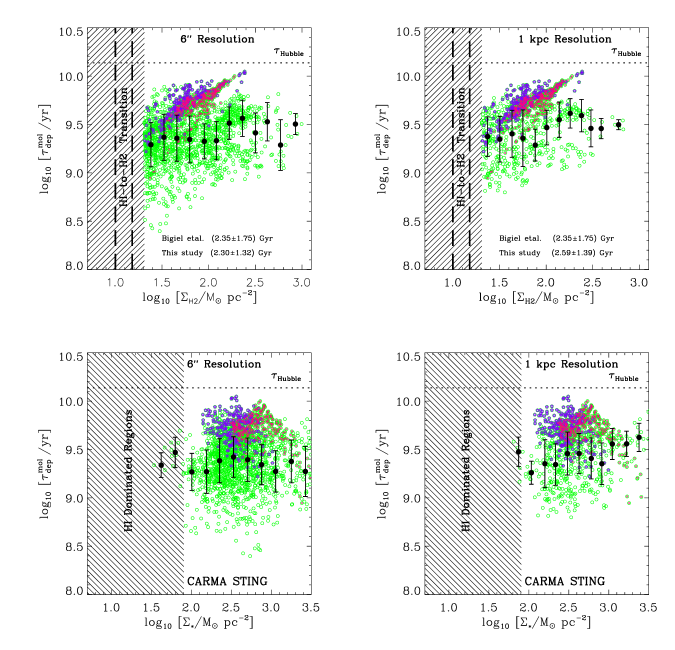
We show as a function of the molecular surface density in the top panels of Fig. 2. The vertical hatch on the left of the panel demarcates the region where 20 , the threshold discussed in §3. The individual measurements in STING galaxies are shown by green points, with the binned medians and (1) dispersions in black where the measurements from NGC 772 and NGC 3147 are excluded from the bins (see below). A horizontal dotted line represents the Hubble time, 13.7 Gyr (Spergel et al. 2007).
It is clear from these diagrams that the depletion time has at most very weak dependence on . A small correlation coefficient () suggests that is mostly uniform across the disk The measurements from NGC 772 and NGC 3147 are responsible for the plume of points showing a slow rise in the depletion time with for . Indeed the - relations in these two galaxies show flatter than average power-law indices (). The reason for this is unclear, but one possibility is that the contribution of DE to their 24 m luminosity is worse than for the rest of the sample. Indeed is increasingly closer to 1 if we increase the threshold over 20 . These galaxies are two of the most distant, thus most massive and intrinsically luminous, objects in our sample. Excluding NGC 772 and NGC 3147 we find Gyr and Gyr at 6″ and 1 kpc resolution, respectively (where the numbers correspond to the median and dispersion in the logarithm of the measurements). The depletion time increases slightly to Gyr and Gyr at the respective resolutions when these two galaxies are included. In any case with the adopted definition appears significantly shorter than the Hubble time.
Our measurements agree very well with the results by Bigiel et al. (2011), who studied the molecular gas depletion time in 30 nearby ( Mpc) spirals from the HERACLES Survey (Leroy et al. 2009). Given the minimal overlap between the samples, the difference in the criteria used to select the galaxies in both surveys, and the fact that HERACLES is a single-dish survey, this agreement shows that determined in the molecular gas is very similar in disks across a wide range of galaxy properties.
We show versus the stellar surface density in the bottom panels of Fig. 2. The hatched section on the left shows the region where decreases monotonically with increasing , and HI dominates the gas surface density (L08). We do not find any correlation between and showing that the molecular gas consumption time is independent of stellar surface density in the region of the disk where is the dominant component of the ISM (see also L08 for a similar result). Since stellar mass surface density dominates the underlying gravitational potential in these objects, this result suggests that locally the molecular gas-SFR surface density relation is independent of the large scale galactic potential. In other words, once diffuse molecular clouds turns into isolated, self-gravitating objects, the conversion of into stars in GMCs is not sensitive to the overall gravitational potential GMCs reside.
Note that while both star formation rate and molecular gas mass surface densities correlate with , their ratio does not correlate with either quantity. Both panels of Fig. 2 show is independent of and . For the STING data set we find that the correlation coefficients for and relations are and , respectively, when all galaxies at 6″ resolution are included. The correlation strengthens, and for the respective relations, if the contributions from NGC 772 and NGC 3147 are removed from the distribution of points. The correlation coefficients are similar at 1 kpc resolution.
4.3. Dynamical vs. Star Formation Timescale in the Molecular Disk
Molecular gas and stellar mass surface densities as shown in Fig. 2, along with the gas and stellar velocity dispersions, can be used to derive dynamical timescales associated with the growth of GMCs such as the Jeans time () and the free-fall () time. We would expect or if either of these dynamical timescale is relevant to star formation, which translates into a proportionality between and either dynamical time (L08; Wong 2009).
For a plane parallel, axisymmetric, and isothermal two-component (gas and star) disk under hydrostatic equilibrium, the Jeans time can be written as,
| (2) |
under the assumption that the gas surface density is dominated by . The quantities and are the velocity dispersion of gas and stars respectively along the -direction, and is the vertical scale height of the gaseous disk. The Jeans time defined this way should be regarded as the “effective” Jeans time since originally it was defined in terms of thermal motions, with corresponding to the sound speed. Our is defined in terms of the gas velocity dispersion, which is dominated by turbulent motions. The free-fall time of gas in the same disk can be written as,
| (3) | |||||
where is the mid-plane volume density, related to the surface density by . These relations stem from the fact that in the two-component disk the scale height and the velocity dispersion of each component are interrelated (Kellman 1972; Talbot & Arnett 1975; van der Kruit 1983, 1988). For example, the relation between stellar velocity dispersion and scale height can be written as (see equation 16 in Talbot & Arnett 1975),
| (4) |
In order to estimate dynamical timescales we require both and , but direct measurement of either quantity is challenging. We use the fact that and are interrelated and so to obtain we first estimate stellar vertical scale height using the empirical relation between radial scale-length () and vertical scale-height () from Kregel et al. (2002), , where for STING galaxies is obtained from the 2MASS data. For we adopt a constant value of 10 km sec-1, very similar to that used by L08 and Wong (2009).
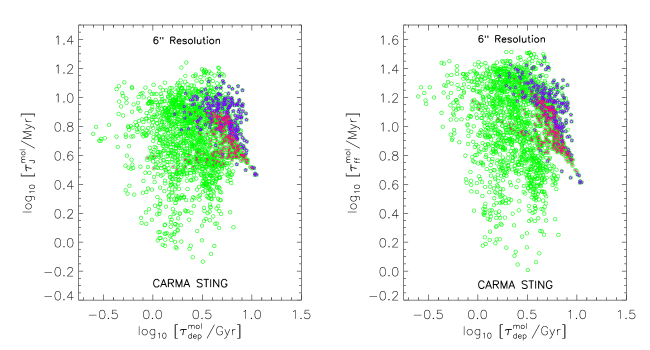
Figure 3 shows the correlations between , , and at 6″ resolution. When the entire STING sample is considered we find no correlation between and either of the dynamical timescales (the correlation coefficients are for either timescale). Wong (2009) analyzed several star-forming galaxies employing radial profiles, and finding weak or no correlation between these quantities. Our results, with slightly different normalization for and and with a general solution of , corroborate these results in the molecular regions of disks for the ensemble of STING galaxies.
When considering individual galaxies, however, a clear negative correlation emerges between and for most galaxies in the STING sample. Table 1 shows that this result is significant: the correlation coefficients for vs. are small and scattered around 0 pretty much symmetrically, suggesting that the growth of Jeans-type dynamical instabilities is not responsible for the regulation of star formation. By contrast, for vs. half the sample has and only one galaxy has . Although the sign of the correlation is puzzling, taken at face value this would suggests that some type of gravitationally driven accretion of molecular gas onto GMCs may be related to the regulation of star formation in the inner disks, and that the degree to which this plays a role may be different from galaxy to galaxy. But there are key caveats that make us skeptical of such conclusion.
We think that the observed correlation is likely not physical, but introduced by how we calculate and , and the fact that moderate () to strong () correlations exist between , , and . Thus there is a coupling between the X and Y axes computed in this manner that is difficult to avoid with the current state of the observations. To explore further we conduct a Monte Carlo experiment and use the fact that , , and are interrelated (see the appendix for a detailed account of the numerical experiment). We approximately reproduce the observed correlations, vs. and vs. , assuming as the independent variable. Our numerical experiment, although crude, strongly suggest that the observed galaxy by galaxy correlations may be almost entirely attributed to this effect. Additionally, there is considerable uncertainty in the degree of coupling between scale heights and velocity dispersions that complicates the interpretation.
4.4. Global Correlations
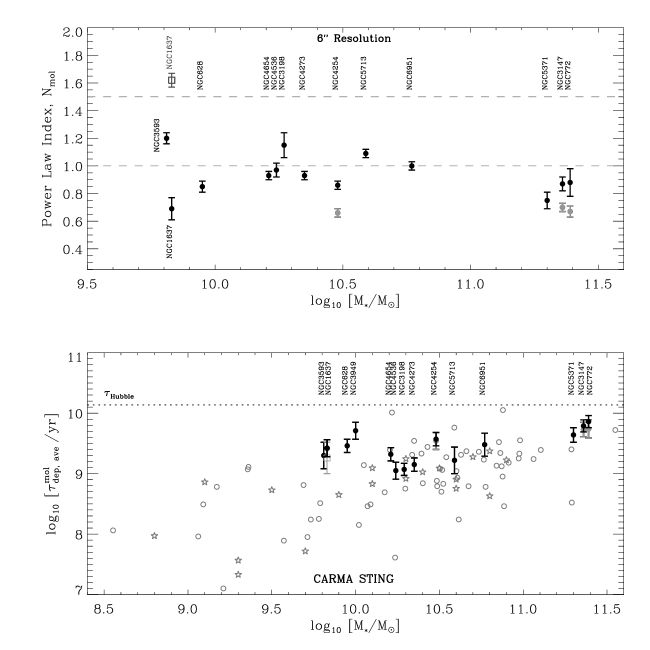
The top panel of Figure 4 shows the distribution of the molecular power-law index as a function of galaxy (total) stellar mass . We only display the results at 6″ resolution, as the results for a fixed 1 kpc spatial scale are effectively identical (see Table 1). Most of the galaxies show an approximately linear relation between molecular gas and SFR surface densities, with little indication of a trend with galaxy stellar mass. The STING sample average is . Note that the panel does not show the measurement of for NGC 3949, which has a very small dynamic range (0.3 dex) in both and yielding a correlation coefficient close to zero.
The largest value of the power-law index is found for NGC 1637, , if we do not mask its nuclear region (gray square in Fig. 4). As mentioned in section 2, despite not being a bona fide AGN the 24 m image of NGC 1637 contains a point source at the center. This source makes the relation very steep when included. On the other hand, when the central part of the is masked in order to remove the contribution of the point source the power-law index becomes significantly flatter (). This illustrates the potential effect of AGN or nuclear clusters on the star formation law determination, and some of the care that should be exercised to obtain unbiased results (see also Momose et al. 2010).
We find significantly flatter than unity power-law indices () in three other galaxies: NGC 772, NGC 3147, and NGC 4254. The indices for these galaxies are shown in gray in the top panel of Fig. 4. The reason for the low index in the power-law fits is that in these sources is almost constant in the range . Consequently the distribution of points in the plane possesses flat tails at the low surface density end. Although the extended tail contains a small number of points ( per galaxy), these points significantly impact the regression analysis, yielding flatter indices. By contrast, we obtain in each case by raising the surface density threshold to , showing that the high surface brightness regions display a linear trend.
The average molecular depletion time, , in the STING galaxies is shown in the lower panel of Fig. 4 as a function of galaxy stellar mass. The average is computed in the logarithm over the pixels where is larger than the threshold. For the STING sample we find Gyr with a range of 1.1 to 7.2 Gyr for individual galaxies (see Table 1). This sample average is slightly longer than the previous mentioned results for the spatially resolved case, because of the “per galaxy” weighting. NGC 772 and NGC 3147 are again the contributing galaxies that to push to the larger value.
We observe a weak correlation between and galaxy mass: a linear regression analysis yields . We should caution, however, that this correlation is entirely driven by the high-mass galaxies — particularly NGC 772 and NGC 3147. The rank correlation coefficient between and total is 0.50 and 0.15 with and without these two galaxies. As discussed in the previous paragraphs, these are the galaxies where we also see a small . Note that although the derivation of stellar mass from NIR light has uncertainties (discussed in §3.2) the large dynamic range in lessens their impact on this study.
In a recent study, Saintonge et al. (2011) report an interesting correlation between depletion time and stellar mass in star-forming galaxies, in the stellar mass range . Using unresolved molecular gas measurements and estimating SFRs using FUV+optical spectral energy distribution fitting, Saintonge et al. (2011) find a global disk-average 1 Gyr in star-forming galaxies which increases by dex for galaxies with stellar masses from to . By comparison the mean resolved depletion time of the STING sample is Gyr, consistent within the uncertainties with the depletion time found by both L08 and Bigiel et al. (2011) who employ the same methodology.
The difference between these two sets of results is due to the fact that the studies measure fundamentally different quantities. The resolved measurement is carried out in regions where CO is detected, and it is thus a statement about the depletion time in GMCs (particularly inner disk GMCs). The unresolved measurement includes emission from all regions inside the beam, particularly the outer disk, and it includes SFR tracer emission from regions that have little or no molecular gas. It is thus a statement about the time it would take for the galaxy to run out of molecular gas, modified by variations in the factor (which are likely to be significant for outer disks) and contribution from diffuse emission and regions of star formation that have no detectable CO emission to the global SFR (which can be very significant in low surface brightness regions).
To explore further whether a correlation is a general property of star-forming disk galaxies we compile the global measurements from L08 and Kennicutt (1998). This sample extends the dynamic range in stellar mass by more than an order of magnitude compared to Saintonge et al. (2011), incorporating many more low mass systems . The measurements of L08 and Kennicutt (1998) are shown by open stars and open circles, respectively, in Fig. 4. L08 use to derive the stellar mass for a sample of 23 galaxies. This value is roughly in the middle of the range of used in this study. The SFR estimation and used by L08 are similar to ours, so no adjustment of the measurements are necessary. The panel shows the measurements of 19 galaxies in L08 that have secure estimates. Kennicutt (1998) provides the global and of a sample of 61 star-forming galaxies. We adjust the original and measurements to be consistent those of L08 and this study. To derive for these galaxies we use . There is a minor overlap between the STING, and the L08 or Kennicutt samples. On the other hand, there is a substantial overlap between the samples of L08 and Kennicutt. Since we do not intend to make any quantitative relation between and , we treat these samples as independent because of their significant methodological differences. It is apparent from Fig. 4 that there is a trend in the global measurements, once the small mass galaxies are included. The global varies almost three orders of magnitude in the stellar mass range , where small mass galaxies have systematically lower global . The trend for the small mass galaxies is simple to understand in terms of a higher value for in galaxies that are of lower mass and lower metallicity (Leroy et al. 2011; Krumholz et al. 2011). A recent study of the Small Magellanic Cloud that avoids using CO to trace at low metallicity finds a strong metallicity effect in the CO emission, but not a measurable one in , suggesting that the trend in Fig. 4 is mostly an effect (Bolatto et al. 2011).
Are systematic changes in associated with metallicity strong enough to explain the magnitude of the observed trend? Reproducing the mean behavior of the unresolved data requires typically increasing by a factor of 1.3 dex (20) going from galaxies with stellar mass to 9.0. The corresponding metallicity change expected, according to the mass-metallicity relation (Tremonti et al. 2004; Mannucci et al. 2010) is approximately 0.6 dex. That is approximately the change in metallicity between the Milky Way (Baumgartner & Mushotzky 2006) and the Small Magellanic Cloud (Pagel 2003). Our best estimates of on the large scales in the Small Magellanic Cloud show that it is 30 to 80 times larger than Galactic (Leroy et al. 2011). If this behavior is typical, we conclude that changes could indeed be the main driver behind the trend for global apparent in the lower panel of Fig. 4.
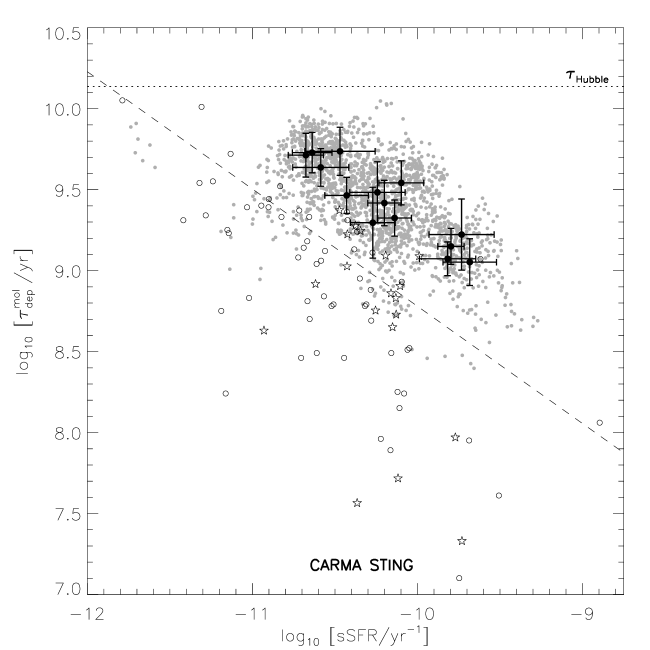
The past evolution of a galaxy is usually quantified by the the stellar mass assembly time (Kennicutt et al. 1994; Salim et al. 2007). It is the time required for a galaxy to assemble the current stellar mass at its present SFR. Assuming zero recycling of the materials by massive stars into the ISM, this timescale is defined as, . The inverse of this timescale is commonly known as the specific star formation rate ().
Figure 5 shows versus for the STING sample as well as the literature data discussed earlier. It also shows the relation between and for star-forming galaxies in the local universe reported by Saintonge et al. (2011). Note that there are 7 outliers at the top-left corner associated with the spatially resolved measurements of NGC 5371 which are coming from its central regions where each of pixel has 2000 . Local galaxies form a bi-modal distribution in the - plane (Salim et al. 2007) where star-forming galaxies form an horizontal branch. In terms of Fig. 5, this observation, however, would imply that the large, massive galaxies would form a locus at the upper left whereas the low mass system would fall to the lower right, likely due the effects discussed above. The global measurements from the literature are broadly consistent with the fit by Saintonge et al. (2011), with significant deviations at low masses. The resolved 6″ (gray dots), 1 kpc (not plotted), and average (black symbols and error bars) measurements of STING galaxies show a similar correlation between and (). The differences in the normalization between these measurements and the empirical relation reflects the difference in the aperture selection e.g., central arc-min vs. extended disk. As it can be surmised from the fact that is approximately constant with (Fig. 2), the negative correlation observed in the STING data set is likely attributable to the fact that the horizontal axis is proportional to the SFR whereas the vertical axis is proportional to the inverse of the SFR. We have further explored this correlations using a Monte Carlo experiment which suggests that the negative correlation between and is governed at the fundamental level by the inter-connections among , , and (see appendix for more on this experiment).
5. Discussion
In this section we interpret the results of this study and relate them to the existing scenarios of star formation and the molecular ISM. In the spatially resolved case our results can be summarized as follows: within the range of , , and explored in this study, 1) the resolved molecular gas depletion time is independent of cloud properties in the disk such as . 2) Dynamical timescales, such as the (effective) Jeans time and the free-fall time in the molecular disk, do not correlate with the molecular gas depletion time over the entire sample. And, 3) the resolved molecular gas depletion time is approximately independent of the disk environment represented, for example, by or .
The uniformity of over a wide range of is most naturally explained as the consequence of the approximate constancy of the depletion time for molecular gas in GMCs. Indeed, observations of galaxies in the Local Group and beyond suggest that the properties of GMCs are fairly uniform (Blitz et al. 2007; Bolatto et al. 2008; Fukui & Kawamura 2010; Bigiel et al. 2010). In this scenario a linear star formation law follows naturally, where the relation arises from the number of GMCs filling the beam (Komugi et al. 2005; Bigiel et al. 2008). A linear molecular gas star formation law is consistent with the scenario in which GMCs turn their masses into stars at an approximately constant rate, irrespective of their environmental parameters (Krumholz & McKee 2005).
For our second result we determined two of the dynamical timescales associated with the gravitational growth of GMCs in the molecular part of the disk; the effective Jeans time and the free-fall time. This is a challenging determination, because it relies on a number of assumptions to estimate the relevant velocity dispersions and scale heights. The lack of a clear correlation between these dynamical timescales and suggest that the star formation regulation is not necessarily associated with the growth time of large scale gravitational instabilities that may create and grow GMCs. We see a correlation between and in individual galaxies. Indeed, approximately half the sample shows a correlation, although it is a physically puzzling inverse correlation where longer free-fall times correspond to shorter molecular depletion times, thus more star formation activity per unit molecular mass. But our numerical experiments suggest that where we see it, it is explained by the observed correlations between , , and .
The third result connects with the local gravitational potential traced by . This result implies that is mostly independent of the local potential in the molecule rich regions of the disk. L08 reaches a similar conclusion, and our result corroborates their findings. Following theoretical studies of Elmegreen (1989, 1993) and Elmegreen & Padoan (1994) that rely on the equilibrium balance between formation and radiative dissociation, Wong & Blitz (2002) and Blitz & Rosolowsky (2004, 2006) suggested that the mid-plane hydrostatic pressure plays a critical role in governing the equilibrium fraction of molecular gas phase in the disk. A recent theoretical study by Ostriker, McKee, & Leroy (2010) explains the same observations as due to the equilibrium in a multiphase ISM, where the stellar potential plays also an important role. If the disk gravity is dominated by the stellar potential and the gas scale height is smaller than the stellar scale height, these studies show that the molecular ratio, defined as , increases approximately linearly with the ambient pressure,
| (5) |
where and is the mid-plane total gas (HI+) surface density (L08). In the regions that are dominantly molecular, however, and , thus is independent of . In other words, the stellar potential plays a role at determining the fraction of gas that is molecular, but it does not affect the rate at which GMCs collapse and their gas is converted into stars. Blitz & Rosolowsky (2004, 2006) show that the ISM becomes molecular around . The mean (median) of the STING galaxies is 580 (395) . It is, therefore, very likely that we probe the molecular ISM where the assumption is well justified (Xue et al. 2011, in preparation).
We should, however, stress here that whether the formation of molecular clouds is regulated by the mid-plane pressure (Blitz & Rosolowsky 2004, 2006), gravitational instability (e.g., Mac Low & Glover 2010), or photo-dissociation (Krumholz et al. 2009) is still not settled. A combination of dynamical and thermodynamic factors may be required to regulate the formation GMCs and the subsequent star formation inside the clouds (e.g., Ostriker et al. 2010).
We find that the resolved molecular gas depletion time, averaged over the central regions of our galaxies, shows a positive but weak correlation with the integrated stellar mass in the stellar mass range . Given that the correlation is dominated by a few galaxies in this sample, it is difficult to assert it with any degree of confidence. If it were real, it would suggest that there are weak environmental effects on the in the GMCs, and analytical models must be able to reproduce this large scale behavior. A systematic resolved study with a large, well-defined sample having homogeneous measurements over the extended disk is necessary to shed more light on this issue.
Finally, using literature data we show that star forming galaxies, spanning a large dynamic range in stellar mass (), show a clear correlation between molecular depletion time and galaxy mass. This correlation is, at least in the low-mass galaxies, most likely explained as arising from systematic variations, although systematic trends in the SFR calibration may also play a role. Fundamentally, however, it highlights different physical processes than the resolved molecular gas measurements. The approximate constancy of in the resolved molecular measurements is a statement about the depletion time in GMCs, which are regions of the disk dominated by molecular gas. The unresolved measurement provides information about the time it would take for the entire galaxy to run out of molecular gas at its current SFR, and it folds in the effects of the factor and the contribution to the global SFR from emission arising in regions with no CO.
6. Summary
We present a comprehensive analysis of the relation between and as a function of stellar mass at sub-kpc and kpc scales using a sample of 14 nearby star-forming galaxies observed by the CARMA interferometer spanning the range of galaxy stellar masses . We measure the relation in the bright, high molecular gas surface density (20 ) regions of star-forming disks. Sampling these CO-bright regions has the advantage of minimizing the contribution from diffuse extended emission present in the SFR tracer and molecular gas disk. Our main results are:
-
1.
The per-galaxy average star formation law for the sample, determined using as the SFR indicator, is Gyr and .
-
2.
The resolved molecular depletion time is independent of both molecular and stellar surface densities, and , respectively. We find Gyr and Gyr at 6″ and 1 kpc resolution, respectively.
-
3.
There is no clear correlation between and the effective Jeans time, , or the free-fall time, , in the molecular regions of our galaxies. These dynamical timescales, which may be important for GMC growth, do not appear to regulate the star formation once the gas is molecular.
-
4.
There are no strong trends across our range of stellar masses for either the power-law index or the normalization of the resolved molecular star formation law.
References
- Aoki et al. (1991) Aoki, T. E., Hiromoto, N., Takami, Hi., Okamura, S. 1991, Pub. Astron. Soc. Japan, 43, 755
- Baumgartner & Mushotzky (2006) Baumgartner, W. H. & Mushotzky, R. F. 2006, ApJ, 639, 929
- Bell & de Jong (2001) Bell, E. F. & de Jong, R. S. 2001, ApJ, 550, 212
- Bigiel et al. (2008) Bigiel, F., Leroy, A., Walter, F., et al. 2008, AJ, 136, 2846
- Bigiel et al. (2010) Bigiel, F., Bolatto, A. D. Leroy, A., et al. 2010, ApJ, 725, 1159
- Bigiel et al. (2011) Bigiel, F., Leroy, A., Walter, F., et al. 2011, ApJ, 730, L13
- Blanc et al. (2009) Blanc, G. A., Heiderman, A., Gebhardt, K., Evans, N. J., & Adams, J. 2009, ApJ, 704. 842
- Blitz & Rosolowsky (2004) Blitz, L., & Rosolowsky, E. 2004, ApJ, 612, L29
- Blitz & Rosolowsky (2004) Blitz, L., & Rosolowsky, E. 2006, ApJ, 650, 933
- Blitz & Stark (1986) Blitz, L., & Stark, A. A. 1986, ApJ, 300, L89
- Bolatto et al. (2011) Bolatto, A. D., Leroy, A. K., Jameson, K., et al.2011, ApJ, 741, 12
- Boselli et al. (2001) Boselli, A., & Gavazzi, G., Donas, J., & Scodeggio, M. 2001, ApJ, 121, 753
- Calzetti et al. (2007) Calzetti, D., et al. 2007, ApJ, 666, 870
- de Vaucouleurs et al. (1991) de Vaucouleurs, G., de Vaucouleurs, A., Corwin, H. G., et al. 1991, Third Reference Catalog of Bright Galaxies, (Austin: University of Texas Press), RC3 catalog
- Dolphin et al. (2001) Dolphin, A. E., Kakarova, L., Karachentsev, I. D., et al. 2001, MNRAS, 324, 249
- Dopita & Ryder (1994) Dopita, M. A. & Ryder, S. D. 1994, ApJ, 430, 163
- Elmegreen et al. (1989) Elmegreen, B. G. 1989, ApJ, 338, 178
- Elmegreen et al. (1993) Elmegreen, B. G. 1993, ApJ, 411, 170
- Elmegreen & Parravano (1994) Elmegreen, B. G., & Parravano, A. 1994, ApJL, 435, 121
- Engelbracht et al. (2007) Engelbracht, C. W., et al. 2007, PASP, 119, 994
- Gavazzi (2009) Gavazzi, G. 2009, in Rev. Mex. Astron. Astrofis. Conf. Ser., 37, 72
- Helfer et al. (2003) Helfer, T. T., Thronley, M. D., Regan, M. W., et al. 2003, ApJS, 145, 259
- Hunter et al. (1998) Hunter, D. A., Elmegreen, B. G., & Baker, A. L. 1998, ApJ, 493, 595
- Isobe et al. (1990) Isobe, T., Feigelson, E. D., Akritas, M. G., & Babu, G. J. 1990, ApJ, 364, 104
- Kauffmann et al. (2003) Kauffmann, G., Heckman, T. M., White, S. D. M., et al. 2003, MNRAS, 341, 54
- Kellman (1972) Kellman, S. A. 1972, ApJ, 175, 353
- Kennicutt (1983) Kennicutt, R. C., Jr. 1983, ApJ, 272, 54
- Kennicutt (1989) Kennicutt, R. C., Jr. 1989, ApJ, 344, 685
- Kennicutt et al. (1994) Kennicutt, R. C., Jr., Tamblyn, P. Congdon, C. E. 1994, ApJ, 435, 22
- Kennicutt (1998) Kennicutt, R. C., Jr. 1998, ApJ, 498, 541
- Kennicutt et al. (2007) Kennicutt, R. C., Jr., et al. 2007, ApJ, 671, 333
- Komugi et al. (2005) Komugi, S., Sofue, Y., Nakanishi, H., & Onodera, S. 2005, PASJ, 57, 733
- Kregel et al. (2002) Kregel, M., van der Kruit, P. C., & de Grijs, R. 2002, MNRAS, 334, 646
- Krumholz et al. (2011) Krumholz, M. R., Leroy, A. K., & McKee, C. F. 2011, ApJ, 731, 25
- Krumholz & McKee (2005) Krumholz, M. R. & McKee, C. F. 2005, ApJ, 630, 250
- Krumholz et al. (2009) Krumholz, M. R., McKee, C. F., & Tumlinson, J. 2009, ApJ, 699, 850
- Lagos et al. (2010) Lagos, C. del P., Lacey C. G., Baugh, C. M., Bower, R. G., & Bension, A. G. 2011, MNRAS, 416, 1566
- Larson et al. (1980) Larson, R. B., Tinsley, B. M., & Caldwell, C. N. 1980, ApJ, 237, 692
- Leroy et al. (2011) Leroy, A. K., Bolatto, A. D., Gordon, K. et al.2011, ApJ, 737, 12
- Leroy et al. (2008) Leroy, A. K., Walter, F., Brinks, E., et al. 2008, AJ, 136, 2782 (L08)
- Leroy et al. (2009) Leroy, A. K., Walter, F., Bigiel, F., et al. 2009, AJ, 137, 4670
- Li et al. (2005) Li, Y., Mac Low, M.-M. & Klessen, R. S. 2005, ApJ, 626, 823
- Li et al. (2006) Li, Y., Mac Low, M.-M. & Klessen, R. S. 2006, ApJ, 639, 879
- Liu et al. (2011) Liu, G., Koda, J., Calzetti, D., Fukuhara, M., & Momose, R. 2011, ApJ, 735, 63
- Mac Low & Glover (2011) Mac Low, M.-M. & Glover, S. C. O. 2011, MNRAS, 412, 337
- Magnani et al. (1985) Magnani, L., Blitz, L., & Mundy, L. 1985, ApJ, 295, 402
- Mannucci et al. (2010) Mannucci, F., Cresci, G., Maiolino, R., Marconi, A., & Gnerucci, A. 2010, MNRAS, 408, 211
- McKee & Ostriker (2007) McKee, C. F., & Ostriker, E. C. 2007, ARA&A, 45, 565
- Momose et al. (2010) Momose, R., Okumura, S. K., Koda, J., & Sawada, T. 2010, ApJ, 721, 383
- Onodera et al. (2010) Onodera, S. Kuno, N., Tosaki, T., et al. 2010, ApJ, 722, 1270
- Ostriker et al. (2010) Ostriker, E. C., McKee, C. F., & Leroy, A. K. 2010, ApJ, 721, 975
- Pagel (2003) Pagel, B. E. J. 2003, in ASP Conf. Series 304, CNO in the Universe, ed. C. Charbonnel, D. Schaerer, & G. Meynet (San Francisco, CA:ASP), 187
- Polk et al. (1988) Polk, K. S., Knapp, G. R., Stark, A. A., Wilson, R. 1988, ApJ, 332, 432
- Press et al. (1992) Press, W. H., Teukolsky, S. A., Vetterling, W. T., & Flannery, B. P. 1992, Numerical Recipes (2d ed.; Cambridge: Cambridge Univ. Press)
- Prescott et al. (2007) Prescott, M. K., et al. 2007, ApJ, 668, 182
- Relano & Kennicutt (2009) Relaño, M. & Kennicutt, R. C., Jr. 2009, ApJ, 699, 1125
- Rafikov (2001) Rafikov, R. R. 2001, MNRAS, 323, 445
- Rahman et al. (2011) Rahman, N., Bolatto, A. D., Wong, T., et al. ApJ, 730, 72 (Paper I)
- Regan & Vogel (1994) Regan, M. W., & Vogel, S. N. 1994, ApJ, 434, 536
- Rieke et al. ((2004) Rieke, G. H., et al. 2004, ApJS, 154, 25
- Rix & Rieke (1993) Rix, H. W., & Reike, M. J. 1993, ApJ, 418, 123
- Roberts (1963) Roberts, M. S. 1963, ARA&A, 1, 149
- Robertson & Kravtsov (2008) Robertson, B. E. & Kravtsov, A. V. 2008, ApJ, 680, 1083
- Saintonge et al. (2011) Saintonge, A., et al. 2011, MNRAS, 415, 61
- Schmidt (1959) Schmidt, M. 1959, ApJ, 129, 243
- Schaye & Dalla Vecchia (2008) Schaye, J., & Dalla Vecchia, C. 2008, MNRAS, 383, 1210
- Schimonovich et al. (2010) Schiminovich, D. et al.2010, MNRAS, 408, 919
- Shi et al. (2011) Shi, Y., Helou, G., Yan, L., Armus, L., Wu, Y., Papovich, C., & Stierwalt, S. 2011, ApJ, 733, 87
- Schruba et al. (2011) Schruba, A., Leroy, A. K. Walter, F., et al. 2010, AJ, 142, 37
- Skrutskie et al. (2006) Skrutskie, M. F., et al. 2006, AJ, 131, 1163
- Spergel et al. (2007) Spergel, D. N., et al. 2007, ApJS, 170, 377
- Talbot & Arnett (1975) Talbot, R. J. Jr.,& Arnett, W. D. 1975, ApJ, 197, 551
- Tremonti et al. (2004) Tremonti, C. A., Heckman, T. M., Kauffmann, G., et al. 2004, ApJ, 613, 898
- Tully et al. (2009) Tully, R. B., Rizzi, L., Shaya, E. J., et al. 2009, ApJ, 138, 323
- Tutukov (2006) Tutukov, A. V. 2006, Astronomy Reports, vol. 50, no. 7, p.526
- van der Kruit (1983) van der Kruit, P. C. 1983, Proc. Astron. Soc. Australia, 5, 136
- van der Kruit (1988) van der Kruit, P. C. 1988, A&A, 192, 117
- Verley et al. (2010) Verley, S., Corbelli, E., Giovanardi, C., & Hunt, L. K., 2010, A&A, 510, 64
- Wong & Blitz (2002) Wong, T., & Blitz, L. 2002, ApJ, 569, 157
- Wong (2009) Wong, T. 2009, ApJ, 705, 650
- Young & Scoville (1991) Young, J. S., & Scoville, N. Z. 1991, ARA&A, 29, 581
Appendix A Investigating Correlations Between Molecular Gas Depletion Time vs. Dynamical Timescales and Specific Star Formation Rate
In this study we show that the observed trends in molecular gas depletion time vs. dynamical timescales for individual STING galaxies vary significantly, showing little or no correlation to strong negative correlation (see Table 1). The correlations for either dynamical timescales, however, vanishes ( in - and in - ) when the entire ensemble is considered (see Fig. 3). The molecular gas depletion time, on the other hand, shows strong negative correlation () with the specific star formation rate (see Fig. 5). In this appendix we demonstrate by a simple Monte Carlo experiment that these trends, particularly - relation, are mostly driven by the existing correlations among , , and and their connections to the stellar velocity dispersion. We carry out this experiment using the 6″ resolution STING data set.
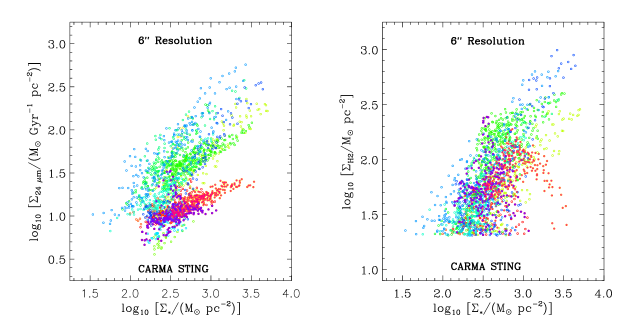
We begin with the assumption that the stellar mass surface density is a fundamental parameter that influence both local and global evolution and organization of molecular gas in the disk and star formation. Indeed observational evidence shows that almost all physical variables strongly correlate with both global (Gavazzi 2009) and (Dopita & Ryder 1994) suggesting that both stellar mass and its surface density have significant roles in galaxy evolution. Strong positive correlations also exists between spatially resolved measurements of , and and . Figure 6 shows such correlations () in both - and - diagrams for local measurements of STING galaxies. With the assumption about made above, we express these relations by the following power laws,
| (A1) |
| (A2) |
where are normalization constants and are power law indices. For each galaxy we derive these parameters using the OLS Bisector regression method in log space. We also obtain observed scatter () in each of these relations using the best-fit line. These parameters are used as inputs in the Monte Carlo simulation and are shown in Table 2.
We use the transformation method to randomly sample stellar mass surface density from its observed distribution (see section 7.2 in Press et al. 1992 for a detailed account of transformation method). This method provides three simple steps to generate random numbers from any arbitrary distribution function: 1) construction of the normalized cumulative distribution function of any given variable, 2) selection of a random number from a uniform distribution and inspection of the cumulative function to find the match between the two, and 3) selection of the variable within the domain that corresponds to the match in step 2. We use this method with two additional conditions while sampling from the observed distribution. These conditions are: 1) the lower and upper limits of the samples surface density must be within the range of observation, and 2) the number of observed measurements and simulated points must be the same. With a randomly sampled , we generate SFR and molecular gas mass surface densities using, , where , , and are the corresponding variables in equations A1 and A2. The last term introduces scatter in the relation assuming a normally distributed . Following this relation, we derive Y for any given X, which is then offset randomly using . We repeat this for all the points contributed by any given galaxy. For each galaxy we generate 5000 realizations and for each realization we compute stellar velocity dispersion, dynamical timescales, and . A similar Monte Carlo method has been used previously in two-dimensional color-magnitude fitting analysis by Dolphin et al. (2001) and in constraining the - relation by Blanc et al. (2009).
NGC 3949 has a very small dynamic range (0.3 dex) in both and yielding a negative correlation in the - plane and a correlation coefficient close to zero in the - plane. We exclude this galaxy from our simulation. It contributes only 2% to the ensemble of points and has virtually no impact on our results. We also exclude the seven outliers with from NGC 5371 data.
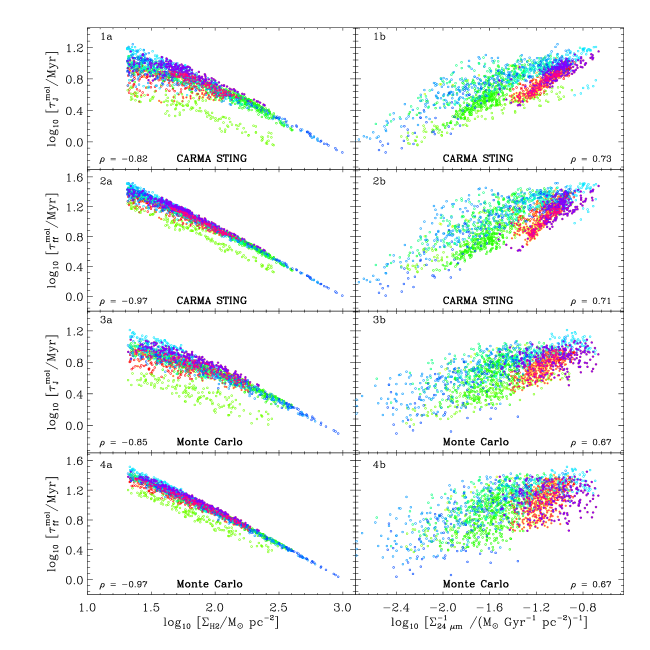
The results of our simulations are presented in Figs. 7 and 8. Figure 7 highlights various observed relations and their reproductions from a single realization. While panels 1 and 2 demonstrates relationships between dynamical timescales and and for the observed data, panels 3 and 4 show these timescales for simulated measurements. Simple correlation analysis strongly suggests that the simulation reproduce the observation reasonably well. Simulated measurements, however, show slightly larger scatter (0.15 dex in panels 1b and 3b as compared to 0.25 dex in panels 2b and 4b), which is mostly due to . Since is a quadratic sum of intrinsic scatter () and measurement error (), in absence of the observed scatter would always overestimate the true scatter present in any relation.
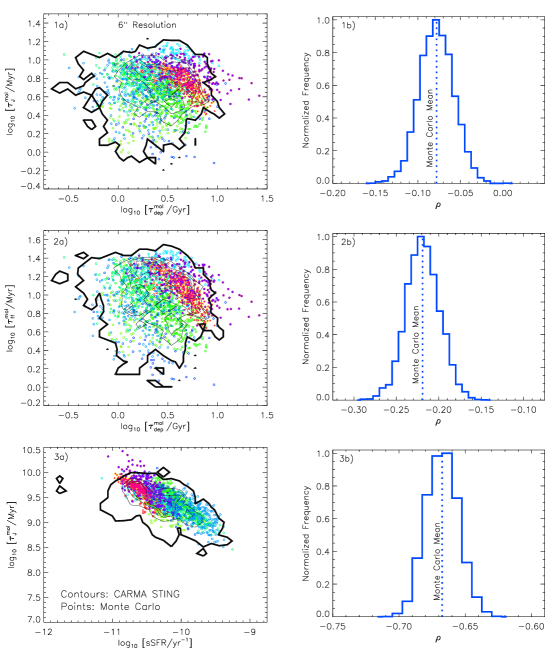
Figure 8 shows all three major correlations for both observed and simulated measurements. For the purpose of demonstration the simulated data are drawn from the same realization as in Fig. 7. A comparison of the correlation coefficients of individual galaxies in Tables 1 and 2 shows that the simulation approximately reproduces the observed - dynamical timescale correlations. The simulation also produces - correlation comparable () to the observed one (). The right panels show the normalized distribution functions of the correlation coefficient derived from 5000 realizations. The mean () and the standard deviation () of the corresponding distribution functions are (-0.080.02), (-0.220.02), and (-0.680.01). The mean values of the respective distribution functions reflect the intrinsic strengths of these correlations. For example, a small correlation coefficient () derived from a large set of measurements indicates no correlation between with either Jeans timescale or free-fall timescale. Likewise, one can find a strong anti-correlation between and .
The properties of the distribution functions shown in Fig. 8 depends on how scatter is introduced in Eqs. A1 and A2. While simulation of each individual galaxy takes normally distributed as an input, the observed scatter, however, is not symmetric and varies with surface density (see Fig. 6). An outcome of this simple choice of is the narrow distribution functions of and the offsets between and observation. However, even with this simplistic approach we approximately reproduce the observed strengths of various correlations using Eqs. A1 and A2 which suggests that these relations are mostly determined by the interrelations among , , and and .
| Object | N | Corr. | Corr. | ||||||
|---|---|---|---|---|---|---|---|---|---|
| dex | dex | ||||||||
| (1) | (2) | (3) | (4) | (5) | (6) | (7) | (8) | (9) | (10) |
| NGC 628 | -0.50 | 0.62 | 0.11 | -0.81 | 0.92 | 0.11 | 131 | -0.23 | -0.45 |
| NGC 772 | -1.12 | 0.85 | 0.19 | 0.16 | 0.63 | 0.19 | 217 | -0.40 | -0.54 |
| NGC 1637 | -0.80 | 0.82 | 0.09 | -1.45 | 1.27 | 0.09 | 47 | -0.72 | -0.76 |
| NGC 3147 | -0.20 | 0.49 | 0.06 | -0.65 | 0.90 | 0.06 | 298 | -0.79 | -0.82 |
| NGC 3198 | -3.65 | 2.13 | 0.08 | -2.99 | 1.89 | 0.08 | 18 | 0.41 | +0.24 |
| NGC 3593 | -1.53 | 1.08 | 0.17 | -0.74 | 0.89 | 0.17 | 141 | 0.19 | -0.04 |
| NGC 3949 | … | … | … | … | … | … | 27 | … | … |
| NGC 4254 | -0.14 | 0.64 | 0.10 | -0.58 | 0.99 | 0.10 | 308 | -0.64 | -0.67 |
| NGC 4273 | -1.10 | 1.12 | 0.09 | -1.19 | 1.22 | 0.09 | 103 | -0.10 | -0.16 |
| NGC 4536 | -0.44 | 0.89 | 0.15 | -0.52 | 0.94 | 0.15 | 67 | -0.16 | -0.28 |
| NGC 4654 | -1.05 | 0.96 | 0.10 | -0.93 | 1.03 | 0.10 | 168 | -0.20 | -0.32 |
| NGC 5371 | -1.41 | 0.94 | 0.11 | -1.50 | 1.22 | 0.11 | 58 | -0.57 | -0.61 |
| NGC 5713 | -0.94 | 1.07 | 0.21 | -0.59 | 0.99 | 0.21 | 220 | -0.12 | -0.20 |
| NGC 6951 | -1.98 | 1.26 | 0.18 | -1.54 | 1.26 | 0.18 | 135 | -0.10 | -0.17 |
Note. — Column : Galaxy name. Column , & : Normalization constant, power-law index, and observed scatter (in dex) derived from - relation. Column , & : Normalization constant, power-law index, and observed scatter (in dex) derived from - relation. Column : Number of independent observed measurements. Column & : Spearman rank correlation coefficients () from - and - relations, respectively, for one realization of Monte Carlo simulation.