Detection of LS I +61 303 in a low VHE -ray emission state with the MAGIC telescopes
Abstract
The gamma-ray binary system LS I +61 303 was studied in great detail in VHE gamma-rays in the last years by the MAGIC telescope. The VHE emission of the system exhibited a prominent periodic outburst in the orbital phases 0.6-0.7 between September 2005 to January 2008. In Fall 2008 the Fermi collaboration reported as well periodic emission in the MeV to GeV energy range, but with a shifted outburst in the phases 0.35-0.45. MAGIC observed again LS I+61 303 in 2009 with the twice more sensitive stereo mode to allow for detailed correlation studies between the VHE gamma-ray and Fermi/LAT energy band. Here we present our new results, which show a significant reduction in the VHE gamma-ray flux in the phase of the periodic outburst by almost one order of magnitude compared to our previous measurements. Furthermore, the 0.1-phase averaged light curve shows no significant outburst, but a rather constant flux. Here we will discuss the implications of our results for future gamma-ray studies of LS I +61 303.
1 Introduction
The LS I +61 303 system consists of a Be star and a compact object of still uncertain nature, either a neutron star or a black hole. Its orbital period, which is most precise measured in radio, is days [1]. Soft X-ray outbursts modulated with the same period as in the radio waveband were reported by [2] but the peak of the emission changes its phase over several years [3]. Many orbital parameters of the system remain controversial (see [6, 5, 4]) but observations indicate a highly eccentric orbit () with the periastron passage at orbital phase [4]. These orbital parameters are important for modelling the VHE emission of the system as shown in,e.g., [7] or [8].
In 2006 the MAGIC collaboration discovered variable VHE -ray emission from LS I +61 303 [12]. A following extensive observational campaign in Fall 2006 found a period for the VHE emission of days [16]. The VHE -ray emission showed an outburst in the orbital phase interval 0.6–0.7 with no significant -ray emission detected during the rest of the orbit. In particular, no VHE -ray signal was detected by MAGIC around the periastron passage of the system. The data from Fall 2006 also suggested a correlation between the X-ray and VHE -ray flux. An extensive multi-wavelength campaign conducted in 2007, including MAGIC, XMM-Newton and Swift, provided strong evidence for the X-ray/VHE -ray flux correlation in the strictly simultaneous taken data [18]. In contrast, no correlation was found between the radio wavelength flux and the VHE -ray flux from the Fall 2006 campaign [15].
The VHE emission of LS I +61 303 was confirmed by VERITAS [10]. However, in observations conducted by the VERITAS collaboration in Fall 2008 and early 2009, no VHE signal was detected. More recent VERITAS observations in Fall 2009 (the same time period considered in the present paper) also yielded only upper limits for the VHE emission from LS I +61 303 [11]. Very recently the VERITAS collaboration reported a detection of the system with a significance of more than ([26, 11]) between orbital phases 0.05 and 0.23. This places the detection at superior conjunction and 5.8 to 1.3 days before the periastron passage a phase range where no VHE -ray emission was previously detected.
The binary system was observed in high energy (HE, ) -rays by EGRET [27], but the large position uncertainty of the source and inconclusive variability studies of the emission[31], prevented its unambiguous identification. The spacial association with LS I +61 303 was only achieved following HE -ray observations by AGILE [28]. Most recently, Fermi/LAT found that the HE -rays are periodically modulated in very good agreement with the (radio) orbital period [9] and firmly established LS I +61 303 as the counterpart of the HE emission. The HE outburst was not, however, observed at the same phases as the VHE outburst but occurred just after the periastron passage between phases 0.3–0.45. This difference in phase may indicate that different processes are responsible for the HE and VHE -ray emission. On the other hand, the same process might produce both emissions if the GeV -rays are produced by inverse Compton (IC) pairs cascading developing in the radiation field of the star. For more details on such a scenario see [20]. Another possibility is that the shift in the peak emission could be caused by a different location of the -ray production site in the system [32]. We note that no simultaneous VHE observations are available for the same time (Aug 2009 to Jan 2009) of the first reported Fermi observations [9]. An unambiguous interpretation of the non simultaneous SED from MeV to TeV energies of LS I +61 303 is not possible because the system might have changed its VHE emission in the meantime.
Two principal scenarios have been proposed to explain the nonthermal emission from LS I +61 303: an accretion powered microquasar (e.g. [30, 19, 25, 22]) and a rotational powered compact pulsar wind (e.g. [24, 7, 33]). An alternative model assumes that the compact object is an accreting magnetar and that the -rays are produced along the accretion flow onto the magnetar [21]. Although high resolution radio measurements [23] show an extended and variable structure emerging from the system, it is not clear if they are produced by collimated plasma outflows (jets) or by a pulsar wind interacting with that of the Be star. Neither of the two proposed scenarios could be validated by accretion disk features, e.g. a thermal component in the X-ray spectrum, or the presence of pulsed emission at any wavelength. Thus the engine behind the VHE emission remains an open question.
Here we present new observations of LS I +61 303 conducted with the MAGIC stereo system. This has twice the sensitivity of the previous MAGIC campaigns, and results in a significant detection of the binary system during a newly identified low emission state.
2 Observations
The observations were performed between 2009 Oct 15 and 2010 Jan 22 using the MAGIC telescopes on the Canary island of La Palma (N, W, 2225 m a.s.l.), from where LS I +61 303 is observable at zenith distances above 32∘. The MAGIC stereo system consists of two imaging air Cherenkov telescopes, each with a 17 m diameter mirror. The observations were carried out in stereo mode, meaning that only shower images which trigger simultaneously both telescopes are recorded. The stereoscopic observations provides a signal above 300 GeV from a source which exhibits 0.8% of the Crab Nebula flux in 50 hours observation time, a factor of two more sensitive than our single telescope campaign on LS I +61 303 in 2007. Further details on the design and performance of the MAGIC stereo system can be found in [17].
The LS I +61 303 data set spans four orbits of the system, with two of these orbits observed for only one and three nights, respectively. The data taken in 2009 Oct and 2009 Nov were restricted to moonless nights. The data sample the orbital phases 0.55 to 0.975 for 2009 Oct , and 0.575 to 1.025 for 2009 Nov , the last night of which is in the next orbital cycle. The data recorded in 2010 Jan cover the phases 0.22 to 0.32 and were obtained during moonlight conditions. All data were taken at zenith angles between 32∘ and 48∘. After pre-selection of good quality data a total of 48.4 hours of data remained for the analysis. The observation strategy aimed to cover consecutive nights with at least three hours of observation in each individual night. Due to adverse observation conditions such as bad weather or too high zenith angle, the data set does not have uniform coverage during the orbital phases and some nights have shorter observation times than the planned three hours.
3 Data Analysis
The data analysis was performed with the standard MAGIC reconstruction software. The recorded shower images were calibrated, cleaned and used to calculate image parameters individually for each telescope. The energy of each event was then estimated using look up tables generated by Monte Carlo (MC) simulated -ray events. Events that triggered both telescopes simultaneously were then selected (so called stereo events)111This step is only needed for the 2009 October data where no hardware stereo trigger was yet available. and further parameters, e.g. the height of the shower maximum and the impact parameter from each telescope, were calculated. The gamma hadron classifications and reconstructions of the incoming direction of the primary shower particles were then performed using the Random Forest (RF) method [14]. Finally, the signal selection used cuts in the hadronness (calculated by the RF) and the squared angular distance between the shower pointing direction and the source position (). The energy dependent cut values were determined by optimizing them on a sample of events recorded from the Crab Nebula under the same zenith angle range and similar epochs than the LS I +61 303 data. For the energy spectrum and flux, the effective detector area was estimated by applying the same cuts used on the data sample to a sample of MC simulated -rays. Finally, the energy spectrum was unfolded, accounting for the energy resolution and possible energy reconstruction bias [13].
4 Results
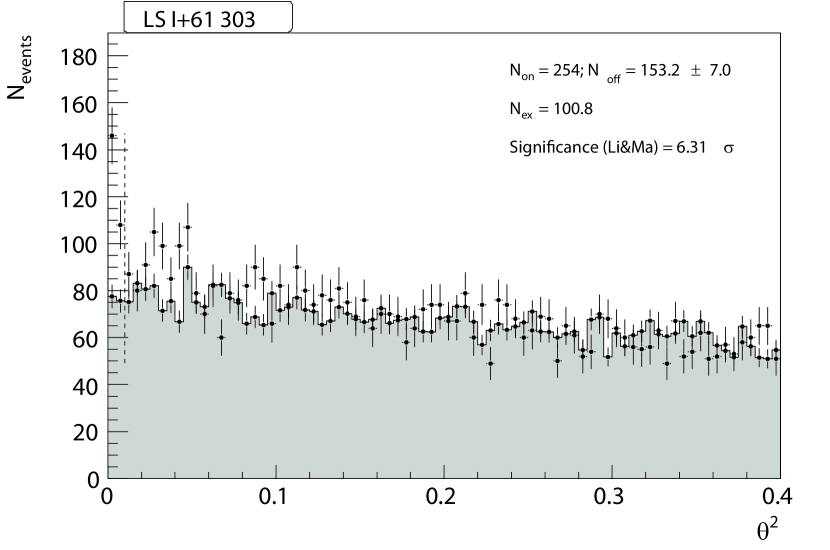
The integral data set of 48.8 hours shows a detection of VHE -ray emission above 400 GeV from LS I +61 303 (see Fig. 1). The integrated flux above 300 GeV is
| (1) |
corresponding to about 1.25% of the Crab Nebula flux in the same energy range.
4.1 Light curve
We derived a nightly light curve above an energy of 300 GeV that is shown in Fig. 2. A constant flux fit to the light curve yields a () and hence is unlikely. Thus, as in previous observations, the emission is variable and reaches a maximum flux around orbital phase 0.62 of corresponding to 5.4% of the Crab Nebula flux. This is a much lower peak emission than detected in our previous campaigns at the same orbital phases and sampled with very similar cadence. For a more quantitative comparison of the 2009 emission level with the previous MAGIC observations, we included the phase averaged 2007 light curve in Fig. 2.
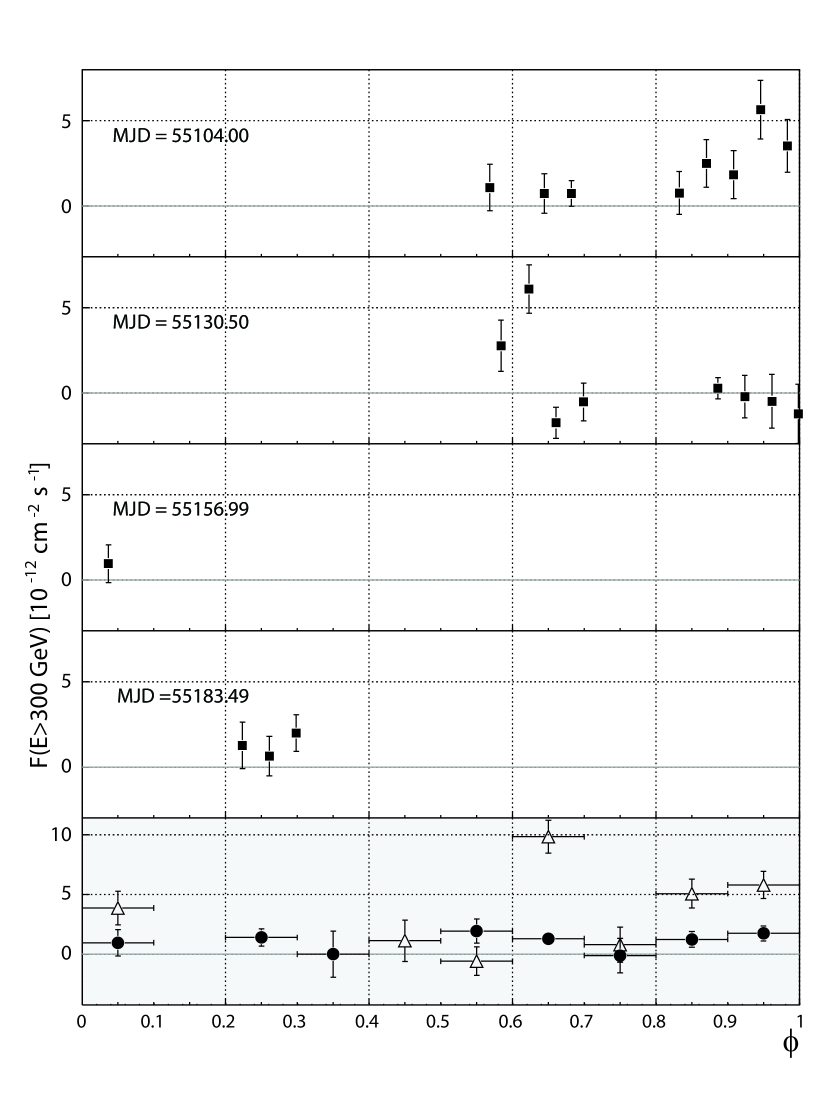
It is clear that the averaged emission level is lower than the data from 2005 to 2007. Not only had the flux changed but a VHE -ray excess was also observed at phases other than those of the periodic outburst between 0.6–0.7. The highest flux is, however, again detected in an outburst during the interval 0.6–0.7, and the measurements in the orbital cycle of 2009 Nov show the same burst profile as in previous observations but with a reduced flux level. Whether this outburst is still a periodic property of the VHE emission for LS I +61 303 cannot be determined with the small sample of orbital cycles observed in this campaign; it is noteworthy that the outburst was not detected during the orbit observed in 2009 Oct.
The rather low mean values, even in the phase bin 0.6–0.7, of the individual night peak emission indicates that most of the emission of the system is contributed by only few nights. This is the case at least for the phase bins 0.6–0.7 and 0.9–1.0, where the mean flux shows the highest significance. On the other hand, there are similar fluxes, measured in phase intervals 0.2–0.3 and 0.5–0.6, although with slightly lower significances, without any obvious individual high flux nights.
4.2 Spectrum
The emission level of LS I +61 303 was too low during most phases to obtain statistical significant phase dependent spectra. The total signal, however, was sufficient to form a phase integrated spectrum for the source. The spectrum is well described by a simple power law
| (2) |
with a reduced . The spectral fit parameters match those previously reported by MAGIC [12, 16, 18] showing no evidence for long term spectral variability despite very different fluxes during these different campaigns.
5 Conclusion
The binary system LS I +61 303 was detected emitting VHE -rays in 2009 at a level a factor 10 lower than previously observed in the phase interval 0.6–0.7. The previously observed orbital modulated outburst in this interval was not detected during the first observed orbital cycle, whereas it was observed in the second. From this data set alone it was not possible to determine whether the outburst is still a truly periodic feature of the light curve. Although we could not significantly detect emission at individual orbital phases in the here presented observations because of the weakness of the source, it appears that several phase intervals dominate in the integral signal. This is strong evidence for a new behavior in the VHE -ray emission of LS I +61 303. In previous observations conducted with MAGIC, the 0.6–0.7 interval dominated the total flux.
Furthermore it is evident that the flux during the phase interval 0.6–0.7 is considerable reduced compared to the previous campaigns, and on a similar level as in other phase intervals (e.g. 0.9–1.0). This suggests that a change in the VHE -ray emission of LS I +61 303 has occurred. On the other hand, there was no statistically significant change in the spectrum of the orbit-integrated flux in 2009 compared to the earlier results, suggesting that the same processes continue to produce VHE gamma-rays, but that either fewer are produced or they are more absorbed.
If enhanced absorption decreases the observed VHE flux, the photon energy will be redistributed to lower energies and thus might be visible as a flux increase at lower energies. The produced VHE -rays would thus need to propagate through a circum-source environment denser in photons and we would expect to detect a cut-off or an absorption feature in our spectrum, neither of which is found. Despite the richness of observations of the system, its VHE emission is still not understood.
The VERITAS observations in the same period as the one considered here did not detect VHE -ray emission from the system [11]. Our measurements are not, however, in contradiction to those of VERITAS. Our longer integration combined with a denser sampling of two orbital cycle yielded a fainter detection threshold than the expected VHE -ray signal from LS I +61 303 from previous campaigns expected. Thus it is evident that a frequent sampling with long individual integrations is required not to miss weak emission from binary systems.
This is the first VHE -ray detection of LS I +61 303 in the era of the Fermi satellite. The faint emission at VHE -rays does not yet permit night by night correlation studies but do show that the emission in LS I +61 303 has changed on longer timescale since 2007. More sensitive and even deeper VHE -ray observations should yield shorter timescale correlation studies.
Acknowledgments
We would like to thank the Instituto de Astrofísica de Canarias for the excellent working conditions at the Observatorio del Roque de los Muchachos in La Palma. The support of the German BMBF and MPG, the Italian INFN, the Swiss National Fund SNF, and the Spanish MICINN is gratefully acknowledged. This work was also supported by the Marie Curie program, by the CPAN CSD2007-00042 and MultiDark CSD2009-00064 projects of the Spanish Consolider-Ingenio 2010 programme, by grant DO02-353 of the Bulgarian NSF, by grant 127740 of the Academy of Finland, by the YIP of the Helmholtz Gemeinschaft, by the DFG Cluster of Excellence “Origin and Structure of the Universe”, and by the Polish MNiSzW Grant N N203 390834.
References
- [1] Gregory, P. C.,ApJ, 2002 575, 427
- [2] Paredes, J. M., Marti, J., Peracaula, M., and Ribo, M., A & A, 1997, 320, L25
- [3] Torres, D. F. et al.,ApJL, 2010, 719, L104
- [4] Aragona, C. et al., ApJ, 2009,698, 514
- [5] Grundstrom, E. D. et al.,Astrophys. J. , 2007,656, 437
- [6] Casares, J., Ribas, I., Paredes, J. M., Marti, J., and Allende Prieto, C.,MNRAS, 2005, 360, 1091
- [7] Sierpowska-Bartosik, A. and Torres, D. F.,ApJ, 2009, 693, 1462
- [8] Dubus, G., Cerutti, B., and Henri, G.,A & A, 2010 516, A18+
- [9] Abdo, A. A. et al., ApJL, 2009 701, L123
- [10] Acciari, V. A. et al., ApJ, 2008 679, 1427
- [11] Acciari, V. A. et al., ArXiv e-prints, 2011
- [12] Albert, J. et al., Science, 2006, 312, 1771
- [13] Albert, J. et al., NIM., 2007,A583, 494
- [14] Albert, J. et al., NIM., 2008, A588, 424
- [15] Albert, J. et al., ApJ, 2008, 684, 1351
- [16] Albert, J. et al., ApJ, 2009, 693, 303
- [17] Aleksić, J. et al., 2011, ArXiv e-prints, 2011
- [18] Anderhub, H. et al., ApJL, 2009,706, L27
- [19] Bednarek, W., MNRAS, 2006a, 371, 1737
- [20] Bednarek, W., MNRAS, 2006b, 368, 579
- [21] Bednarek, W., MNRAS, 2009, 397, 1420
- [22] Bosch-Ramon, V., Paredes, J. M., Romero, G. E., and Ribó, M., A & A, 2006, 459, L25
- [23] Dhawan, V., Mioduszewski, A., and Rupen, M., Proceedings of the VI Microquasar Workshop: Microquasars and Beyond. September 18-22, 2006, Como, Italy., p.52.1
- [24] Dubus, G.,A & A, 2006, 456, 801
- [25] Gupta, S. and Böttcher, M.,ApJL, 2006, 650, L123
- [26] Ong, R. A.: 2010, The Astronomer’s Telegram 2948, 1
- [27] Kniffen, D. A. et al.,ApJ, 1997, 486, 126
- [28] Pittori, C. et al.,A & A, 2009, 506, 1563
- [29] Rolke, W., Lopez, A., and Conrad, J., Nucl. Instrum. Meth., 2005, A551, 493
- [30] Romero, G. E., Christiansen, H. R., and Orellana, M., ApJ, 2005, 632, 1093
- [31] Tavani, M. et al.,ApJL, 1998, 497, L89
- [32] Zabalza, V., Paredes, J. M., and Bosch-Ramon, V.,A & A, 2011, 527, A9+
- [33] Zdziarski, A. A., Neronov, A., and Chernyakova, M., MNRAS, 2010, 403, 1873