Distributed cavity phase frequency shifts of the caesium fountain PTB-CSF2
Abstract
We evaluate the frequency error from distributed cavity phase in the caesium fountain clock PTB-CSF2 at the Physikalisch-Technische Bundesanstalt with a combination of frequency measurements and ab initio calculations. The associated uncertainty is , with a frequency bias of . The agreement between the measurements and calculations explains the previously observed frequency shifts at elevated microwave amplitude. We also evaluate the frequency bias and uncertainty due to the microwave lensing of the atomic wavepackets. We report a total PTB-CSF2 systematic uncertainty of .
1 Introduction
Over the past decade the number of primary caesium fountain clocks contributing to International Atomic Time (TAI) has steadily increased and now exceeds the number of contributing primary caesium beam clocks. During the last two years, ten fountain clocks from seven laboratories contributed to TAI [1]. The fountain clocks largely calibrate TAI because of their excellent systematic and statistical uncertainties. While total systematic uncertainties clearly below are routinely reported by several fountains, there has not been widespread agreement about the methods to establish the frequency uncertainties due to spatially distributed phase variations of the field in the microwave cavity.
Until recently, distributed cavity phase (DCP) was the largest uncertainty contribution for several fountains [2, 3, 4, 5]. The resistive losses of the cavity walls lead to small traveling waves, which account for the power flow from the cavity feeds to the walls and produce the spatial phase variations [6]. A recent comprehensive model has clarified the evaluation of DCP frequency shifts [3]. The ab initio model, with no free parameters, has been stringently verified with the French fountain SYRTE-FO2 and already used to evaluate the DCP uncertainties of it and the British NPL-CsF2 fountain [4, 5]. Here we report the results of measurements and calculations, using this model to evaluate the DCP uncertainty of the PTB-CSF2 fountain clock. In contrast to SYRTE-FO2 and NPL-CsF2, the amplitudes and phases of the two cavity feeds of PTB-CSF2 are balanced by symmetry and cannot be independently adjusted [7, 8]. Here, we also evaluate the microwave lensing frequency shift [5, 9] and summarize all of the evaluated systematic biases and uncertainties of PTB-CSF2.
The fountain geometry naturally minimizes frequency shifts from phase variations of the microwave field. In atomic fountain clocks, the atoms interact twice with the microwave field in the same cavity, eliminating the end-to-end phase shifts of beam clocks [10, 11] with a velocity reversal, which largely cancels the Doppler shifts from longitudinal phase gradients. Transverse phase variations clearly produce frequency shifts when the atoms probe the field with different phases when they traverse the cavity at different positions during their ascent and descent in a fountain.
The central feature of the model [6, 3] is to decompose the transverse phase variations into a Fourier series with cylindrical coordinates . This enables densely-meshed finite element calculations of the cavity fields because the 3D problem is reduced to a short series of 2D solutions in and . The transverse phase of the field is proportional to to lowest order and therefore only terms are significant since the cavity apertures restrict the atomic trajectories to small . The azimuthal symmetry of each Fourier term specifies the physical effects in the fountain that produce DCP frequency shifts. While the transverse variations are small, the phase variations are naturally large, representing a linear phase gradient and a power flow from a cavity feed across the cavity to the walls. This gradient is highly suppressed in all fountains by using two or more diametrically opposed feeds. The quadrupolar transverse phase variations are maximally excited by two opposing feeds and can be negligible with four (or more) azimuthally distributed feeds [12].
The DCP shifts of the lowest Fourier terms usually have unique functional dependences on the clock’s microwave amplitude. For example, if the transverse phase variations have no longitudinal variation for all atomic trajectories, then each atom sees the same phase for the entire cavity traversal during ascent and descent. Then, the DCP frequency shifts are independent of microwave amplitude. But, in general, there are longitudinal phase variations and therefore the atoms see a time-dependent phase during each cavity traversal, which often gives a large microwave amplitude dependence of the effective phase of the cavity field [3, 13]. Even longitudinal phase gradients that have no transverse phase variation can produce large amplitude-dependent frequency shifts because the atoms do not have a transverse velocity reversal in the fountain and therefore experience different average microwave pulse areas on the two cavity passages [3, 13]. The , azimuthally symmetric phase deviations have a negligibly small transverse variation and a very large longitudinal variation, primarily due to the endcap losses [6]. Here we measure the resulting large, amplitude-dependent frequency shift, explaining the previously observed frequency shifts of the PTB-CSF1 and PTB-CSF2 fountains at elevated microwave amplitudes [14, 15].
2 DCP evaluation of PTB-CSF2
The cylindrical TE011 Ramsey cavity of PTB-CSF2 is made from OFHC copper, with an inner diameter of 48.4 mm and 28.5 mm height [7, 8]. In the top and bottom endcaps two apertures 10 mm in diameter enable the atoms to pass through the cavity, with 70 mm long waveguide cutoff tubes to minimize microwave leakage from the cavity. The coaxial line that feeds the microwave signal is strongly coupled to a standing wave in a curved waveguide. Two opposed slits (10.8 mm length and 2 mm width) in the curved waveguide feed the cavity. Their strong coupling to the cavity gives a relatively low loaded quality factor , which reduces the effect of the cavity detuning, for example due to temperature changes, as compared to weak coupling. Our finite-element calculations [6, 3] of the cavity geometry give consistent resonant frequencies for the measured TE011 and TM111 modes.
In PTB-CSF2 the entire atom collection and cooling chamber, including the laser beam collimators, can be pivoted around its center on a goniometric stage. It allows a sub-milliradian adjustment of the launch direction to maximize the number of detected atoms. The initial center-of-mass position of the atomic cloud is offset from the fountain axis by 1.7 mm, along the axis of the two cavity feeds. This is inferred from the single Rabi pulse spectrum of transitions, taking advantage of a slight unintended tilt of the static magnetic field in the vertical plane perpendicular to the feeds [16]. Because of this offset, and since PTB-CSF2 is vertically adjusted to maximize the number of detected atoms, the actual angle at which the detected atoms are launched deviates from true vertical by 0.15 mrad so that the atomic cloud is launched with a nonzero horizontal launch velocity of 0.7 mm/s in opposite direction of the offset. Perpendicular to the feed axis, the above evaluation of the spectrum cannot be used since the static magnetic field happens to have a negligible component parallel to the feeds [16]. Instead we evaluate the transition probabilities for a single Rabi pulse on the ascent as a function of the launch angle perpendicular to the feed axis. This transition probability shows no gradient at the launch angle that maximizes the number of detected atoms for a cloud that is launched on the cavity axis. We observe no gradient of the transition probability versus perpendicular tilt and therefore conclude that there is no cloud offset perpendicular to the feed axis. For tilts parallel to the feed axis, this technique is consistent with the above measured offset because there is a gradient of the transition probability versus launch angle.
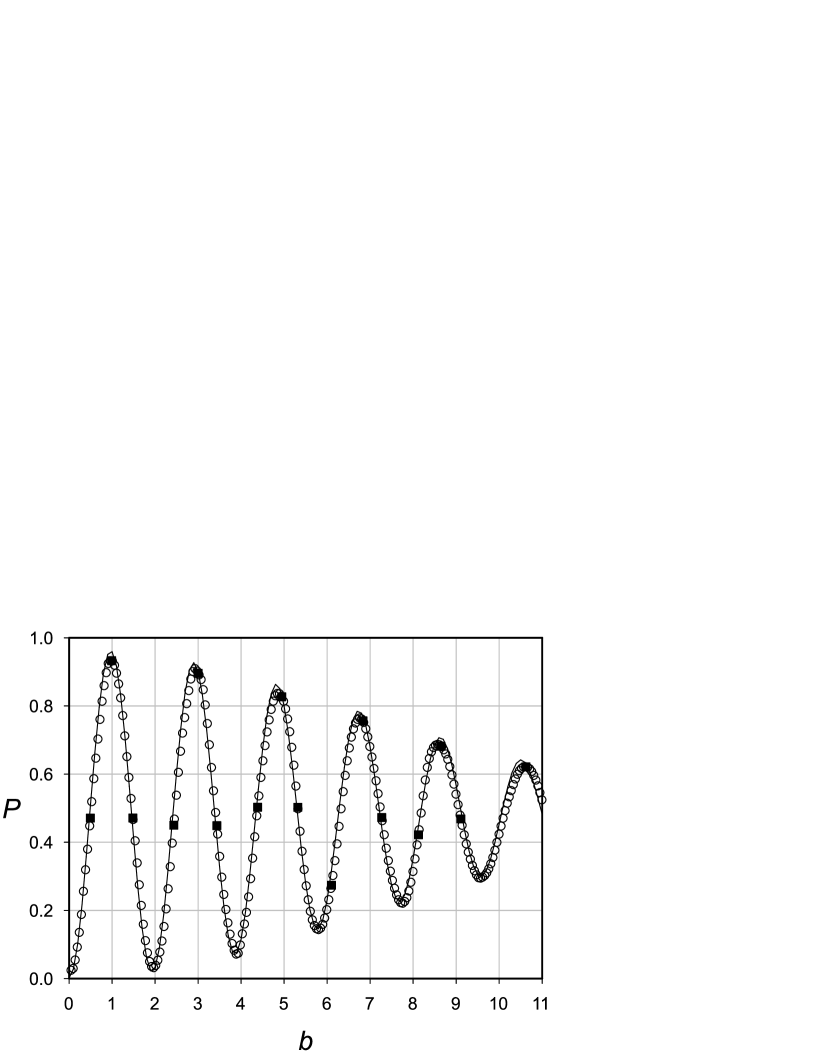
The validity of the Monte-Carlo model of the fountain is confirmed by comparing experimental and calculated transition probabilities as a function of microwave amplitude (see figure 1) [4, 17]. The agreement is sensitive to the size, offset, and velocity distributions, the positions of apertures in the fountain, and the detection inhomogeneity. Here is in units of -pulses during a cavity traversal for a uniform density distribution on a cavity passage [3]. Because the cloud size in PTB-CSF2 is smaller than the cavity aperture during the first cavity passage, the optimum microwave amplitude for normal clock operation, which maximizes the Ramsey fringe contrast, is .
We next evaluate the DCP frequency shifts from each Fourier component . The frequency shifts are often singular near even where the Ramsey fringe contrast vanishes. Therefore, we instead discuss the change in transition probability at detuning , where Hz is the full width of the central Ramsey fringe. The frequency shift is where the Ramsey fringe slope for PTB-CSF2 is Hz at optimum amplitude.
2.1 DCP frequency shift
The DCP shift is primarily due to power flow from the feeds at the cavity midplane to the endcaps. This power flow causes large longitudinal phase variations, which are symmetric about the cavity midplane, and small, azimuthally symmetric transverse phase variations. The longitudinal phase variations are not canceled by the velocity reversal of the two cavity passages because the cloud is larger for the descent than the ascent, and therefore experiences a different average field amplitude [3, 13]. This gives large frequency shifts at elevated microwave amplitude, especially and 8 where the sensitivity function gives the maximum perturbation for a phase variation that is symmetric about the cavity midplane. At low amplitude, , is small because the effective phase is zero since it is simply the average phase along a trajectory through the cavity. At , is also zero because the phase is an even function of [3, 13]. Thus, is highly suppressed at optimum amplitude because, while it increases from zero as for small , it cannot get too large since it returns smoothly to zero near .
The solid curve in figure 2 shows the calculated changes of transition probability as a function of microwave amplitude for PTB-CSF2. The initial measured cloud radius at launch is 3.9 mm and the temperature is 1.2 K. If the cloud is initially centered (no offset), the is almost identical. The curves show the characteristic features of DCP shifts: a very small shift around optimum amplitude and large shifts near and . At the DCP shift is .
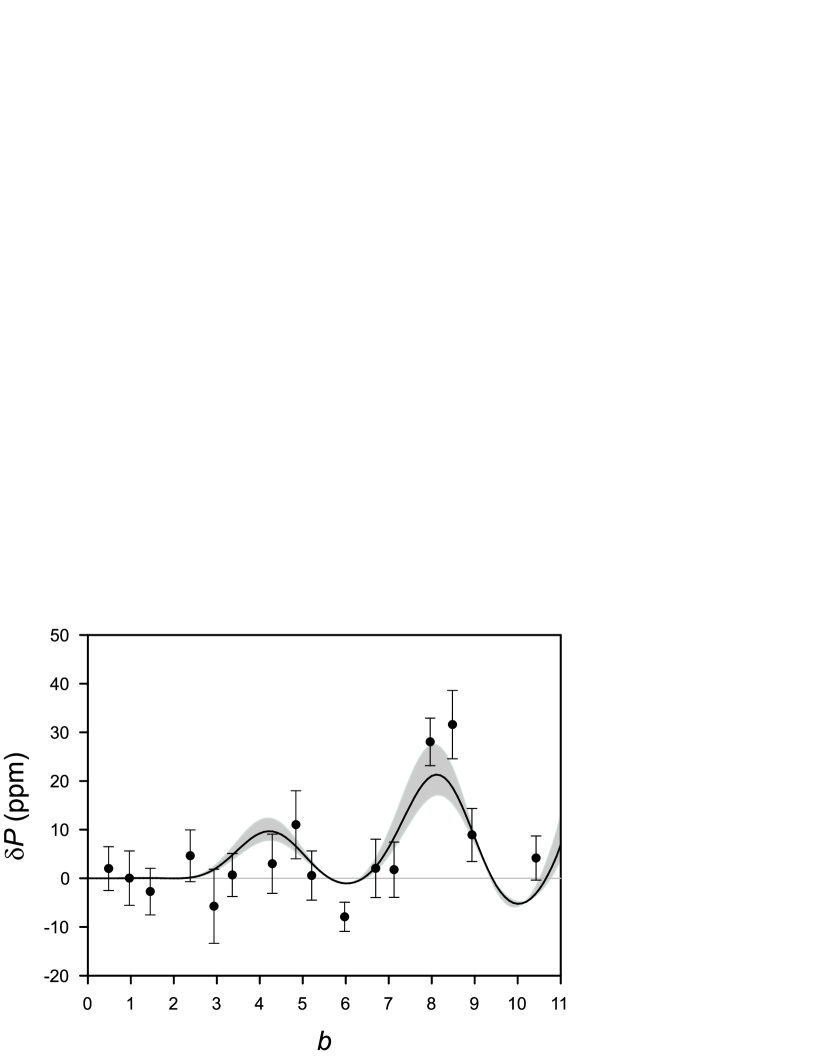
We extract the experimental change in transition probability in figure 2 (full circles) from measurements of the frequency difference between the PTB-CSF2 and PTB-CSF1 fountains, where PTB-CSF1 [18] is operated at optimum amplitude. We also measure the Ramsey fringe slopes of PTB-CSF2 at each . We apply frequency corrections to both fountains for the quadratic Zeeman effect, cold collisions, blackbody radiation, gravity and the relativistic Doppler shift. The error bars are 1 statistical uncertainties. At optimum amplitude of PTB-CSF2, , the two fountains agree within the statistical uncertainty.
The measurements in figure 2 must also include and DCP shifts. Below we show that both are negligible on this scale (see sections 2.2 and 2.3). The calculated DCP shifts agree well with the measurements, which explains the previously observed amplitude dependence of the PTB-CSF2 fountain [7].
At optimum amplitude the calculated frequency shift is . Because the DCP shift depends strongly on the difference of the average microwave amplitudes that the atoms experience on the two cavity passages, the shift is sensitive to the initial cloud size. In figure 2 the gray band shows the range of shifts for initial cloud sizes of 20%. This range of initial cloud size gives a negligible uncertainty of . In [4], measured DCP shifts suggested that the cavity walls could have inhomogeneous conductivities as large as 20%. If the conductivity of the top and bottom endcaps differ by 20%, it would give an DCP shift of at optimum amplitude. The measurements in figure 2 do not exclude this possibility and we therefore take this as our DCP uncertainty.
2.2 DCP frequency shift
The DCP shift is caused by power flow across the cavity, arising from potential imbalances between opposing feeds or resistance inhomogeneities of the copper cavity walls. Near the cavity axis, the phase variations are linear gradients and lead to frequency shifts if the mean transverse positions of the atomic cloud are different on the two cavity passages, for example if the fountain is intentionally tilted [19, 3, 4, 5]. Because power is supplied to the PTB-CSF2 cavity via a single cable to the curved waveguide, we cannot experimentally amplifiy the DCP shift by alternately supplying one feed or the other when the fountain is tilted [19, 4, 5]. We therefore cannot use this technique to balance the feeds or to measure the tilt of the fountain to give no atomic motion along the feed axis and no m = 1 DCP shift.
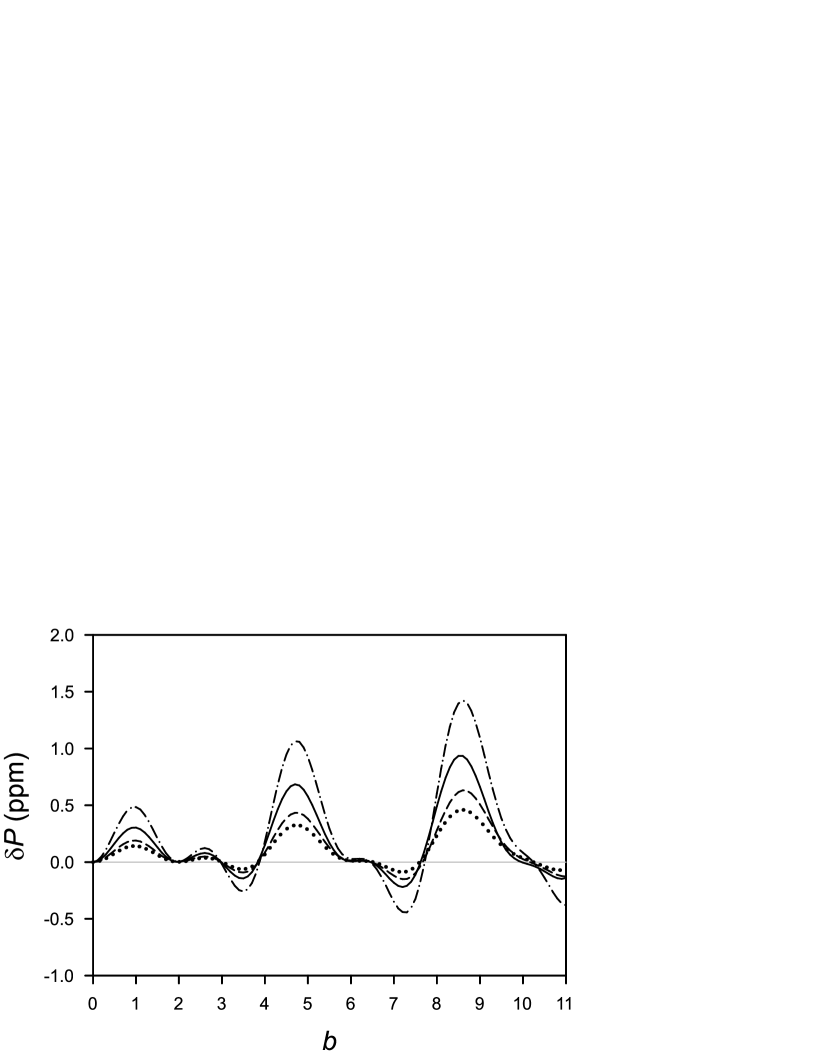
To evaluate the DCP shifts, we measure the frequency change of PTB-CSF2 at optimum amplitude as we change the launch angle to 2.54 mrad from and that maximize the number of detected atoms, parallel and perpendicular to the feed direction (see figure 3) [4, 5]. Here, we again use the PTB-CSF1 fountain as the reference. Phase gradients parallel to the feeds can be caused by feed imbalances and resistance inhomogeneities, while phase gradients perpendicular to the feeds can only be from resistance inhomogeneities. The measured tilt sensitivities are mrad-1 for parallel and mrad-1 for perpendicular tilts.
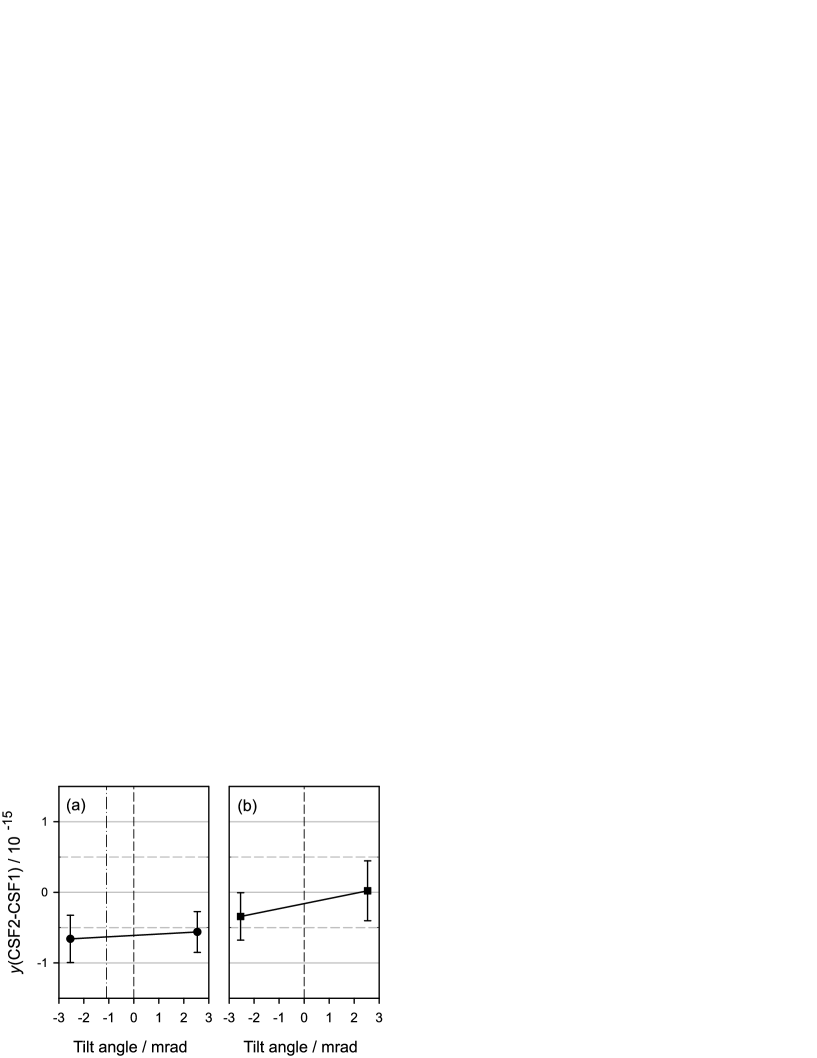
We need to determine the difference between the launch angle for normal operation and the launch angle , where the DCP shift is zero. Note that cancelling the DCP shift of an offset cloud implies launching the atoms towards an even larger mean offset for the descending cloud since it in effect uniformly fills the cavity aperture. Therefore, a moderate offset implies that significantly fewer atoms are detected. For the same reason, a vertical launch gives a non-zero DCP shift because the ascending cloud is offset and the descending cloud is nearly centered. A Monte-Carlo simulation shows that the 1.7 mm initial cloud offset corresponds to a launch angle difference of mrad. Its uncertainty mrad includes the quadratic sum of the uncertainty of the mean position (0.27 mrad) [16] and possible variations (0.5 mrad) from long-term molasses laser-beam intensity imbalances. From , the DCP shift is and its uncertainty is .
Perpendicular to the feeds, the cloud offset is consistent with zero (see section 2) so that a vertical launch maximizes the number of detected atoms. This gives no DCP shift for atomic motion perpendicular to the feeds. The measurements yield an angular uncertainty of mrad. Here, we again add in quadrature an 0.5 mrad uncertainty related to possible long-term molasses laser-beam intensity imbalances. Thus, the DCP uncertainty for the perpendicular direction is . For both tilt directions, we get a total DCP shift of .
It is interesting to deduce the corresponding feed imbalance from the measured parallel tilt sensitivity in figure 3(a). In figure 4 we show the calculated microwave amplitude dependence of the DCP transition probability change of PTB-CSF2 for a single weakly coupled feed. The most likely imbalance for our cavity is an asymmetry in the machined size of the cavity couplings. Such an asymmetry supplies more power to, but also leads to greater loss from one feed. Therefore, a feed imbalance of gives [3]. A 10% imbalance yields a of only 5% of in figure 4. If, however, the microwave amplitude in the curved waveguide is imbalanced at the two couplings, is larger by a factor [3], where is the theoretical quality factor for weak coupling, calculated to be for PTB-CSF2, giving . Assuming no resistance inhomogeneities, the tilt sensitivity in figure 3(a) only constrains the couplings to be the same to 36% and the microwave amplitudes in the curved waveguide to 2%. We expect the balance of both is better than these estimated limits. Additionally, the measured DCP shift of of PTB-CSF2 at optimum amplitude corresponds to ppm. From figure 4, is ppm so our measured bias suggests a suppression factor of and in turn that DCP shifts are negligible in figure 2.
2.3 DCP frequency shift
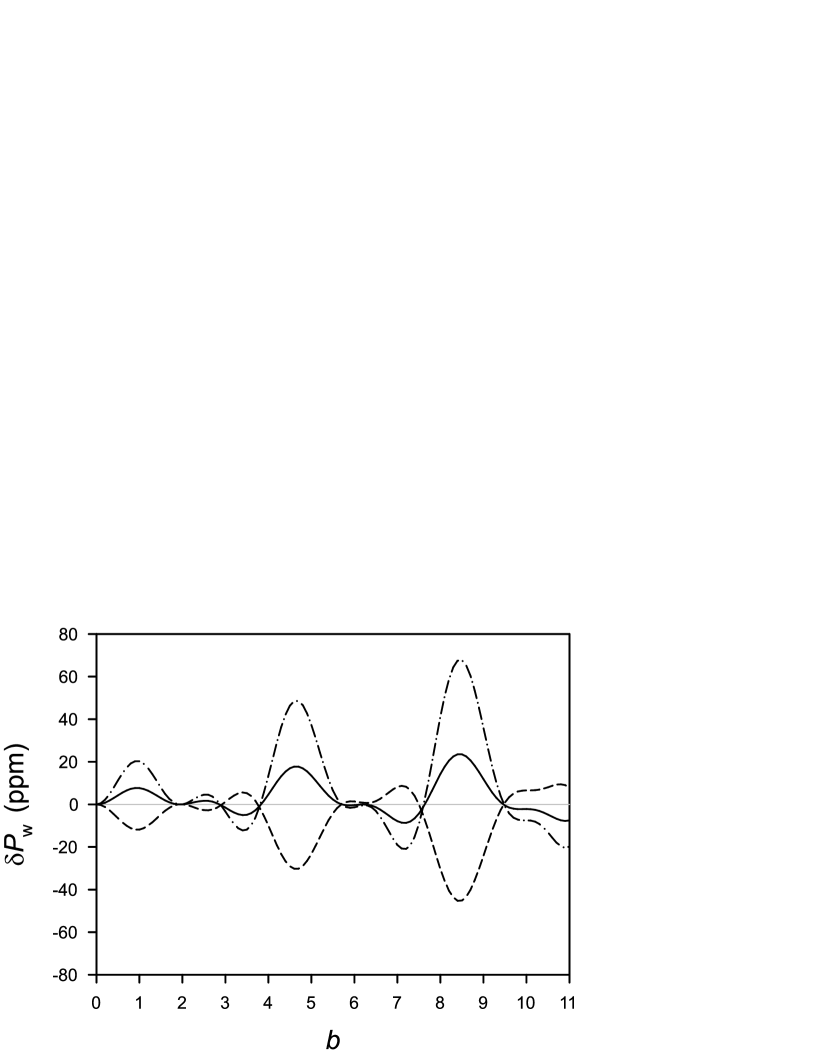
The quadrupolar phase variations are caused by transverse power flow from two feeds to the cavity walls. As for the DCP shifts, the DCP shift also vanishes for a horizontally symmetric cloud, launched vertically on the cavity axis and homogeneously detected. For a centered vertical launch, only the detection system can cause DCP shifts [3]. But, if the detection laser beam propagates perpendicular to the optical axis of the imaging system and both are at 45∘ to the axis of the two cavity feeds, inhomogeneous detection will nonetheless be symmetric and produce no DCP shift [3]. In PTB-CSF2 the orientation of the cavity feeds and the overall detection system are nearly optimal; the detection laser beam propagates at 37.5∘ from the feed axis, resulting in a suppression factor of 3.9 of the DCP shifts due to detection inhomogeneities.
We evaluate the homogeneity of the detection system of PTB-CSF2 with a Monte-Carlo ray tracing simulation. We take into account the detection laser intensity profile and the geometric and optical parameters of the detection system. Because the detection laser intensity is high enough to reasonably saturate the fluorescence detection transition, the relative efficiency only varies from 100% to 90%. The fluorescence collection on the other hand varies much more. It has a minimum of 40% for atoms detected around the edges of the detection zone as compared to the fluorescence collection from atoms on the fountain axis. The dotted line in figure 5 shows the resulting calculated for PTB-CSF2.
The initial cloud offset also produces an DCP shift. The total DCP shift, including the detection inhomogeneity, is the solid line in figure 5. At optimum amplitude, , the DCP frequency shift is . The dashed and dash-dotted lines represent transition probability changes for 50% variations of the initial cloud offset. Considering the variations given by the dashed and dash-dotted lines as an upper limit for long-term drifts of the initial cloud offset, we get as the DCP uncertainty.
2.4 Summary of DCP frequency shifts and overall uncertainty budget of PTB-CSF2
In table 1 the individual DCP contributions of PTB-CSF2 are compiled and the overall correction is given, including its uncertainty. Our evaluation neglects DCP shifts from potential machining burrs [3, 4]. Such shifts could be avoided by using a small cloud [5] or additional apertures to prevent atoms passing near the cutoff waveguide walls from being detected.
-
Effect Correction Uncertainty DCP 0.038 DCP (feed direction) 1.08 DCP (perpendicular to feed direction) — 0.77 DCP 0.14 total 1.33
We now include an entry in the uncertainty budget of PTB-CSF2 for the microwave lensing of the atomic wavefunctions by the microwave standing-wave [5, 9]. On the fountain ascent, the interaction of the atomic wave packets with the microwave standing-wave in the clock cavity gives rise to a spatially dependent phase shift that is nearly quadratic with transverse position, thus acting as a lens on the incident atomic wave [9]. The spatial phase variation from the dipole energy focuses one dressed state and defocuses the other during the first cavity passage. On the high frequency side of the central Ramsey fringe, the microwaves during the second cavity passage transfer the focused dressed-state to the final state of the clock transition and, on the low frequency side of the central fringe, the defocused dressed-state [9]. As a result, the apertures in the fountain cut more of the defocused dressed-state, producing an apparent positive frequency shift of the clock transition.
The microwave lensing frequency shift is analytic if we ignore the apertures during the ascent, the microwave lens aberrations, and the detection inhomogeneities [5]. This analytic result predicts a shift of . Including the lower aperture of the selection cavity during the ascent reduces the shift to , because it truncates the large atomic cloud far from the cavity axis where the dipole forces are large. Adding the higher order lens aberrations gives a small correction, yielding . Finally, with the detection inhomogeneity included [5], the predicted microwave lensing shift is for PTB-CSF2. We take half of this correction as the uncertainty.
The updated uncertainty budget of PTB-CSF2 and the applied corrections are given in table 2. For some corrections, i.e. quadratic Zeeman shift, blackbody radiation shift, collisional shift, typical values are given. The uncertainty due to the collisional shift is improved by a factor of compared to the first evaluation [7] by taking advantage of a better measurement statistics.
-
Frequency shift Correction Uncertainty Quadratic Zeeman shift 0.59 Blackbody radiation shift 0.76 Gravity + relativistic Doppler effect 0.06 Collisional shift 3.0 Cavity phase shift 1.33 Microwave lensing 0.42 AC Stark shift (light shift) 0.01 Majorana transitions 0.001 Rabi pulling 0.002 Ramsey pulling 0.01 Electronics 2.0 Microwave leakage 1.0 Background pressure 0.5 total 4.1
The DCP shift accounts for our previously observed “microwave power dependence” so we no longer include this entry in the uncertainty budget of PTB-CSF2. We note that the currently largest uncertainty is due to collisions and is essentially given by its statistical measurement uncertainty, which will be reduced in future extended evaluations. Using rapid adiabatic passage [20] or tuning the collision energy to cancel the shift [21] could offer more profound reductions.
3 Conclusions
We theoretically and experimentally evaluate the distributed cavity phase shifts of the PTB-CSF2 fountain clock. The DCP frequency shifts due to longitudinal phase gradients are measured and compared with ab initio calculations. The experimental data agrees well with the model that shows a very small correction at optimum microwave amplitude. The transverse phase gradients have been evaluated experimentally. At optimum microwave amplitude the gradient in the direction of the cavity feeds yields the largest DCP uncertainty contribution. The uncertainty is dominated by the statistical uncertainties of the measurements and the knowledge of the initial position and launch angle of the atomic cloud. The contribution from transverse phase variations was modeled, accounting for the detection inhomogeneities and the initial position and horizontal velocity of the atom cloud. We anticipate further reduction of the DCP uncertainty with better centering of the initial position of the atomic cloud. We evaluate the systematic frequency shift due to microwave lensing. Combined with a smaller uncertainty of the collision shift, the inaccuracy of PTB-CSF2 improves to .
References
References
- [1] BIPM CircularT, monthly, available at: http://www.bipm.org/jsp/en/TimeFtp.jsp
- [2] Wynands R and Weyers S 2005 Atomic fountain clocks Metrologia 42 S64–79
- [3] Li R and Gibble K 2010 Evaluating and minimizing distributed cavity phase errors in atomic clocks Metrologia 47 534–51
- [4] Guéna J, Li R, Gibble K, Bize S and Clairon A 2011 Evaluation of Doppler Shifts to Improve the Accuracy of Primary Atomic Fountain Clocks Phys. Rev. Lett. 106 130801
- [5] Li R, Gibble K and Szymaniec K 2011 Improved accuracy of the NPL-CsF2 primary frequency standard: evaluation of distributed cavity phase and microwave lensing frequency shifts Metrologia 48 283–89
- [6] Li R and Gibble K 2004 Phase variations in microwave cavities for atomic clocks Metrologia 41 376–86
- [7] Gerginov V, Nemitz N, Weyers S, Schröder R, Griebsch D and Wynands R 2010 Uncertainty evaluation of the caesium fountain clock PTB-CSF2 Metrologia 47 65–79
- [8] Schröder R, Hübner U and Griebsch D 2002 Design and Realization of the Microwave Cavity in the PTB Caesium Atomic Fountain Clock CSF1 IEEE Transactions on Ultrasonics, Ferroelectrics and Frequency Control 49 383–92
- [9] Gibble K 2006 Difference between a Photon’s Momentum and an Atom’s Recoil Phys. Rev. Lett. 97 073002
- [10] Vanier J and Audoin C 1989 The Quantum Physics of Atomic Frequency Standards (Bristol: Hilger)
- [11] Bauch A, Fischer B, Heindorff T and Schröder R 1998 Performance of the PTB reconstructed primary clock CS1 and an estimate of its current uncertainty Metrologia 35 829–45
- [12] Jefferts S R et al 2002 Accuracy evaluation of NIST-F1 Metrologia 39 321–36
- [13] Li R and Gibble K 2005 Distributed Cavity Phase and the Associated Power Dependence Proc. Joint IEEE International Frequency Control Symposium and Precise Time and Time Interval Systems and Applications Meeting (Vancouver, BC, Canada) pp 99–104
- [14] Weyers S, Wynands R, Szymaniec K and Chałupczak W 2007 Multiple Pulse Area Operation of Caesium Fountains and the Collisional Frequency Shift Proc. of the IEEE Int. Freq. Control Symp. and the 21st European Frequency and Time Forum (Geneva) pp 52–54
- [15] Gerginov V, Nemitz N, Griebsch D, Kazda M, Li R, Gibble K, Wynands R and Weyers S 2010 Recent Improvements and Current Uncertainty Budget of PTB Fountain Clock CSF2 Proc. of the 24th European Frequency and Time Forum (Noordwijk, Netherlands)
- [16] Nemitz N, Gerginov V, Gibble K, Weyers S and Wynands R 2011 Atomic trajectory characterization in a fountain clock using hyperfine transitions, in preparation
- [17] Guéna J, Bize S, Clairon A, Li R and Gibble K 2011 Quantitative Evaluation of Distributed Cavity Phase Shifts to Improve the Accuracy of SYRTE FO2 Proc. of the Joint Conf. IEEE Int. Freq. Control Symp. and Eur. Freq. Time Forum (San Francisco, USA) (in press).
- [18] Weyers S, Hübner U, Schröder R, Tamm Chr and Bauch A 2001 Uncertainty evaluation of the atomic caesium fountain CSF1 of PTB Metrologia 38 343–52; Weyers S, Bauch A, Schröder R and Tamm Chr 2001 The atomic caesium fountain CSF1 of PTB Proc. of the 6th Symposium on Frequency Standards and Metrology (University of St Andrews, Fife, Scotland) (Singapore: World Scientific) pp 64–71
- [19] Chapelet F, Bize S, Wolf P, Santarelli G, Rosenbusch P, Tobar M E, Laurent Ph, Salomon C and Clairon A 2006 Investigation of the distributed cavity phase shift in an atomic fountain Proc. of the 20th European Frequency and Time Forum (Braunschweig, Germany)
- [20] Pereira Dos Santos F, Marion H, Bize S, Sortais Y, Clairon A and Salomon C 2002 Controlling the Cold Collision Shift in High Precision Atomic Interferometry Phys. Rev. Lett. 89 233004
- [21] Szymaniec K, Chalupczak W, Tiesinga E, Williams C J, Weyers S and Wynands R 2007 Cancellation of the Collisional Frequency Shift in Caesium Fountain Clocks Phys. Rev. Lett. 98 153002