Dwarf Galaxies in the Coma Cluster: I. Velocity Dispersion Measurements††thanks: Based in part on observations made with the NASA/ESA Hubble Space Telescope, obtained at the Space Telescope Science Institute, which is operated by the Association of Universities for Research in Astronomy, Inc. under NASA contract NAS 5-26555. These observations are associated with programme GO10861.††thanks: Some of the data presented herein were obtained at the W.M. Keck Observatory, which is operated as a scientific partnership among the California Institute of Technology, the University of California and the National Aeronautics and Space Administration. The Observatory was made possible by the generous financial support of the W.M. Keck Foundation.
Abstract
We present the study of a large sample of early-type dwarf galaxies in the Coma cluster observed with DEIMOS on the Keck II to determine their internal velocity dispersion. We focus on a subsample of 41 member dwarf elliptical galaxies for which the velocity dispersion can be reliably measured, 26 of which were studied for the first time. The magnitude range of our sample is mag.
This paper (paper I) focuses on the measurement of the velocity dispersion and their error estimates. The measurements were performed using pPXF (penalised PiXel Fitting) and using the Calcium triplet absorption lines. We use Monte Carlo bootstrapping to study various sources of uncertainty in our measurements, namely statistical uncertainty, template mismatch and other systematics. We find that the main source of uncertainty is the template mismatch effect which is reduced by using templates with a range of spectral types.
Combining our measurements with those from the literature, we study the Faber-Jackson relation () and find that the slope of the relation is for galaxies brighter than mag. A comprehensive analysis of the results combined with the photometric properties of these galaxies is reported in paper II.
keywords:
galaxies: clusters: individual: Coma; galaxies: elliptical and lenticular, cD; galaxies: dwarf; galaxies: kinematics and dynamics; galaxies: fundamental parameters; galaxies: evolution1 Introduction
A clear understanding of dwarf galaxies and their relation to their most massive counterparts is essential for testing galaxy formation models. Although the lowest luminosity dwarf galaxies () appear to contain large amounts of dark matter (Aaronson et al. 1983; Mateo 1998) for brighter dwarfs the situation is less clear. De Rijcke et al. (2006) find that the dwarf companions to M31, at , contain around 40-50% dark matter by mass within the inner two half-light radii. Geha et al (2002) find that six Virgo cluster dwarfs at do not show evidence for dark matter within an effective radius. Toloba et al. (2011) observe a larger sample of Virgo dwarfs, and again find that they are not dark matter dominated. Here we observe a sample of Coma cluster dwarfs in a somewhat brighter magnitude range () in order to understand better their internal dynamics. Our goals are the extension of the Faber-Jackson relation () and the fundamental plane (FP, Djorgovski & Davis 1987; Dressler et al. 1987; Bender et al. 1992) relating luminosity, velocity dispersion, surface brightness, and scale length of galaxies, to the low luminosity dwarf population, providing important tools for studying formation of galaxies. For example, the precise value of the exponent of the Faber-Jackson relation, , helps to constrain galaxy formation models as it is sensitive to the effect of gas loss from self-gravitating systems (Dekel & Silk 1986; Yoshii & Arimoto 1987). In the case where a dark matter halo governs the galaxy dynamics, is predicted to be 5.26 and . If, instead, the galaxies contain only baryonic matter and have roughly constant , a flatter relation, , is expected (Dekel & Silk 1986).
Clusters of galaxies are ideal for studying scaling relations as they provide large number of galaxies of different types, at a common distance, different environments within the cluster, and allow one to assess the interaction with the Intra-Cluster Medium (ICM). Since the Coma cluster is one of the nearest, rich and dense clusters, it has been a popular target for studies of scaling relations among galaxies including the Faber-Jackson relation (Jørgensen et al. 1996; Moore et al. (2002: MLKC02); Graham & Guzmán 2003).
The Faber-Jackson relation for faint ellipticals in Coma cluster has been studied by Matković & Guzmán (2005: MG05) and Cody et al. (2009: Co09), using WIYN/HYDRA (multi-fiber) spectroscopy. Both MG05 and Co09 find for dwarf ellipticals even though these studies have only 10 galaxies in common whose measurements differ by up to 30% for the faintest galaxies. Thus, it is important to obtain high S/N data to measure velocity dispersions for dwarf galaxies at fainter magnitudes.
In this paper we use the high spectral resolution of DEIMOS (Faber et al. 2003) on the Keck II telescope to measure the velocity dispersions for a sample of 41 faint elliptical galaxies in the core of the Coma cluster. Of these galaxies, 15 are common with the samples of MG05, Co09 or both, and for the remaining 26, these are the first velocity dispersion measurements. The current DEIMOS measurements extend the study to luminosities in the range , about 1 magnitude fainter than the limit reached by the WIYN/HYDRA data in previous studies of Coma dwarf galaxies.
This paper covers mainly the observations and the technical part of the analysis. The emphasis is on the reliable estimate of the uncertainties in measuring the internal velocity dispersion of galaxies. In section 2 we describe the observations, the spectroscopic setup and the data reduction. Section 3 is dedicated to the measurement of radial velocities and the velocity dispersions. The error analysis is described in section 4. The results of the analysis and the Faber-Jackson relation are presented and discussed in section 5.
Throughout this paper, the distance modulus of the Coma cluster is considered to be (Carter et al. 2008).
2 Observations
2.1 Source Selection
Galaxies were selected using the photometry from Adami et al. (2006). The (B-R) versus R colour-magnitude relation was constructed, and the red sequence identified and fitted by a linear relation. Galaxies were then selected from within a region from this relation, with a magnitude range . Images from the HST/ACS Coma Treasury Survey (Carter et al. 2008) were then used to reject a very small number of galaxies with obvious spiral structure. However not all candidates fell within the footprint of the completed survey (which was truncated owing to ACS failure) so some late-type galaxies may remain in the sample. The masks were then designed at the university of Hawaii to accommodate, and as a compromise between the two programmes: the velocity dispersions programme described here, and a separate programme to measure redshifts of a sample of low surface brightness galaxies. The requirement that the spectra from different slits should not overlap, and the need for sufficient slit length to enable sky subtraction, places considerable restriction on the number of galaxies one can observe in each mask.
2.2 Spectroscopic setup
The observations were carried out on the night of March 19th 2007, using DEIMOS on the Keck II telescope. The outer dimension of the rectangular DEIMOS field is 16.75.0 arcmin2 and all observed spectra are mapped onto 24 mosaic of 2K4K CCDs (2 CCDs for each spectrum). We used 1200G grating (1200 grooves/mm BK7, gold-coated, and blazed at 7760 Å). The nominal central wavelength at the centre of the mask was 8700 Å, although of course the central wavelength of a given spectrum depends upon the position of that slitlet in the mask. Although slitlets for the redshift survey observations were drilled at a variety of widths, all of those for the velocity dispersion project described here had widths of 0.7 arcsec. Reciprocal dispersion is 0.33 Å/pixel, giving a spectral resolution (FWHM) of 1.6 Å, and a resolving power R5000. This equates to an instrumental velocity width of 25 km s-1, allowing us to measure velocity dispersions down to 15 km s-1 in spectra with S/N per pixel. The velocity dispersions of galaxies in the dE sample are expected to range between 10 km s-1 and 80 km s-1. The spectral range covered is approximately , although it depends upon the slit position in the mask. This wavelength range is dominated by the very deep calcium II triplet absorption lines (CaT) at and , which depend only weakly upon metallicity, and therefore provide an ideal range over which to measure the kinematic properties of low-luminosity galaxies. A GG495 filter was used to block out the contamination from the second order blue spectrum.
Two masks were observed for each of two pointings, and the exposure time for each mask was in the range 6030 to 6600 seconds. A summary of these observations is presented in Table LABEL:tab:observations. In addition, a number of potential template stars, and flux calibration stars, were observed using a 0.7 arcsec width long slit during twilight at the beginning and end of the night. Wavelength calibration arcs and observations of internal flatfielding lamps were also made at the beginning of the night.
We observed eleven standard stellar spectra of which only two templates were reliable for measurements in this study. The other stellar templates were excluded because they either were not G/K-type stars or were affected by noise near the Ca triplet lines.
2.3 Data reduction
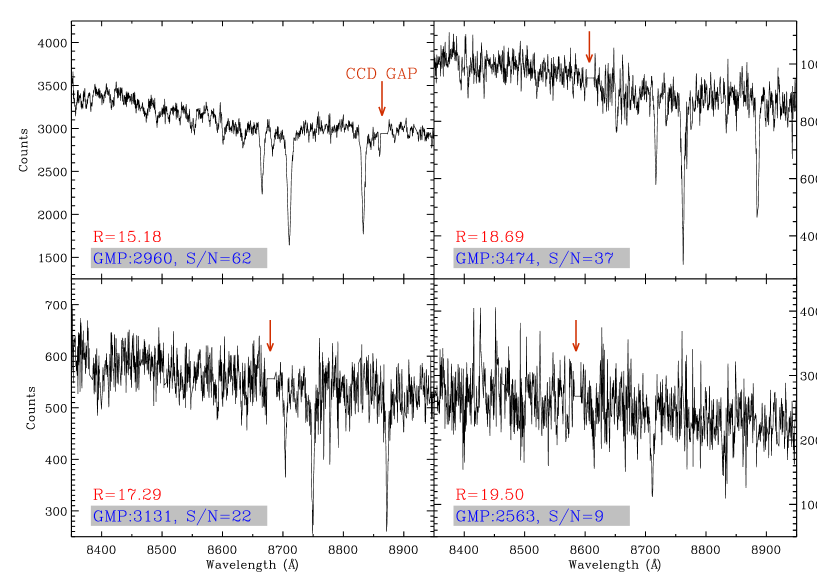
The spectra of dwarf galaxies and template stars were reduced using the IDL spec2d pipeline developed by the DEEP2 Galaxy Redshift Survey team at the University of California-Berkeley for that project (see Davis et al. (2003) for more information). The pipeline performs the flat-fielding using internal quartz flats and the wavelength calibration using the ArKrNeXe arc lamps. The sky subtraction and the data extraction to 1D spectra are also done within the pipeline. For our purpose here, all spectra are not flux calibrated and all partially remaining sky emission lines, particularly near the Ca triplet lines, were manually removed. In this manual process, for each galaxy spectrum, we checked the wavelength of the remaining bright emission lines with the catalogues of the sky emission lines and then we replaced the verified sky emission lines with the continuum fitted underneath the spectrum. Each spectrum was originally located on 2 CCDs. In order to join the blue and red parts of each 1D spectrum, the average value of the nearest 50 pixels to the CCDs gap was calculated and the offset was used to construct the conjoined thorough 1D spectrum. An example of final one-dimensional spectra from the DEIMOS in the range 8300-9000 Å is shown in Figure 1. In this paper all spectral S/N values are estimated per pixel (i.e. 0.33 Å).
| Mask | Mask Centre (J2000) | Exposure | No. of Slits | ||
|---|---|---|---|---|---|
| RA | Dec | Time (s) | dEs | Total | |
| (1) | (2) | (3) | (4) | (5) | (6) |
| Coma1-1 | 12:59:57.83 | 27:59:30.6 | 6600 | 24 | 105 |
| Coma1-2 | 12:59:57.83 | 27:59:31.2 | 6600 | 15 | 109 |
| Coma2-1 | 13:00:04.04 | 27:54:52.2 | 6600 | 22 | 101 |
| Coma2-2 | 13:00:04.04 | 27:54:52.2 | 6030 | 14 | 103 |
3 The Measurement of Radial Velocity and Velocity Dispersion
There are 49 galaxies in our DEIMOS sample with spectroscopically confirmed Coma membership (Marzke et al. 2011). The CaT absorption lines for eight galaxies were either coincident with gaps in the CCD mosaic, or too low signal-to-noise to make reliable measurements and therefore were taken out of the sample. We thus, used 41 spectra with identified CaT lines with signal-to-noise ratio (S/N) ranging from 5 to 87. Figure 1 shows four of the sample spectra.
The line-of-sight radial velocities, and velocity dispersions, , were measured using the pPXF111penalized PiXel Fitting software developed by Cappellari Emsellem (2004). The pPXF technique works in pixel space and uses Gauss-Hermite series to extract the radial velocity and velocity dispersion simultaneously by minimizing the which is defined as
| (1) |
where and are the original and the modelled galaxy spectra respectively. is the error in observed galaxy spectrum and is the number of good pixels used in the fitting process.
First, both galaxy and stellar template spectra are rebinned in wavelength space (). A range of model spectra are obtained by convolving the stellar template with a broadening function, which takes into account the true galaxy radial velocity and a range of trial velocity dispersions. The minimisation is then carried out over this range of broadened templates. Compared to the other methods, Cappellari Emsellem showed that for low S/N, the use of maximum penalized likelihood suppresses the noise effect in the solution. This makes the pPXF method robust for objects with low S/N such as our dwarf galaxies.
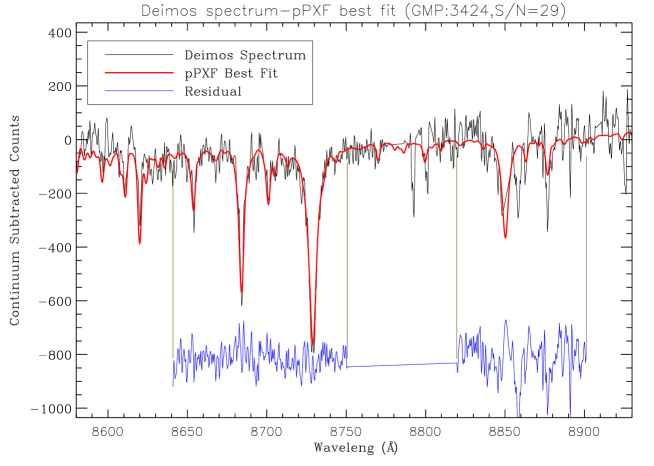
pPXF enables us to use any desired wavelength range for measurements (see Figure 2 for example). In order to benefit from high S/N part of the spectrum, we chose the rest frame spectral range of 8450-8700 Å which covers the CaT features. All galaxy spectra and stellar templates are continuum subtracted. Due to the noise, for a few faint galaxies ( and ), the measured velocity dispersion is very sensitive to the selected wavelength range and therefore, high errors are expected in the final results.
In order to provide realistic initial values of radial velocity to pPXF, the IRAF FXCOR package was used to obtain the relative velocity for each selected pair of the galaxy and template spectra. FXCOR is based on the Fourier cross-correlation technique developed by Tonry & Davis (1979). The location of the highest peak of the correlation function represents the most probable blue/red-shift value of the galaxy. Although the FXCOR task can measure velocity dispersions, it also requires simulations of multiple spectra in order to construct a proper relation between the width of the highest peak of the correlation function and the real velocity dispersion of the galaxy. Such simulations are not necessary when using pPXF. Other advantages of the pPXF package include the use of multiple stellar templates, where these are optimized and weighted, and shorter computing time.
| Library | ID [HD] | SPTYPE | Teff [Fe/H] log(g) |
|---|---|---|---|
| DEIMOS | 44007 | G5IV | 4850 -1.71 2.00 |
| (This Study) | 45282 | G0V | 5280 -1.52 3.12 |
| Indo-US | 44007 | G5IV | 4850 -1.71 2.00 |
| 45282 | G0V | 5280 -1.52 3.12 | |
| 117876 | G8III | 4582 -0.50 2.25 | |
| 161797 | G5IV | 5411 0.16 3.87 | |
| 223-65 | G2IV | 5350 -0.59 3.50 | |
| 142198 | K0III | 4700 -0.08 2.99 | |
| 48433 | K1III | 4425 -0.24 1.35 | |
| 6497 | K2III | 4421 0.02 2.80 | |
| 78479 | K3III | 4509 0.57 2.54 |


Of the eleven stellar templates observed by DEIMOS, only two spectra (i.e. HD44007 and HD45282) had high enough S/N near the strong CaT absorption lines to be used in our analysis. Therefore, we added more G/K-type spectra from the Indo-U.S. Coude Feed spectral library (Valdes et al, 2004). For practical reasons, especially computing time, we used 11 stellar templates (see Table 2) to perform single template analysis and simulations. To find the best optimal synthetic template, a set of 80 mixed templates were used to finalize the results.
| ID | SPTYPE | Teff [Fe/H] log(g) | S50 | S80 |
|---|---|---|---|---|
| HD | [] [cm/s2] | (%) | (%) | |
| 63791 | G0I | 4700 -1.81 1.70 | 17 | 10 |
| 44007 | G5IV | 4850 -1.71 2.00 | 5 | 7 |
| 187111 | G8IV | 4429 -1.54 1.15 | 24 | 22 |
| 45282 | G0V | 5280 -1.52 3.12 | 24 | 29 |
| 81192 | G8III | 4582 -0.70 2.75 | 7 | 2 |
| 210752 | G0V | 5910 -0.64 4.25 | 12 | 20 |
| G_241-18 | G5V | 5511 -0.61 4.00 | - | 10 |
| G_165-11 | G0V | 5725 -0.56 4.00 | 20 | 17 |
| 201099 | G0V | 5872 -0.50 4.06 | - | 7 |
| 157214 | G0V | 5676 -0.41 4.33 | - | 7 |
| 99167 | K5III | 3930 -0.38 1.61 | 10 | 10 |
| 82210 | G5III | 5250 -0.34 3.42 | 7 | 5 |
| 83787 | K5III | 4000 -0.18 1.60 | 17 | 22 |
| 169414 | K2III | 4450 -0.16 2.67 | 7 | 7 |
| 186486 | G8III | 4980 -0.11 3.08 | 12 | 15 |
| 225212 | - | 3700 -0.03 0.80 | 10 | 2 |
| 150680 | G0IV | 5825 0.00 3.80 | - | 7 |
| 237903 | - | 4070 0.00 4.70 | 46 | 20 |
| 17925 | K2V | 5091 0.10 4.60 | 10 | 7 |
| 161797 | G5IV | 5411 0.16 3.87 | 10 | 10 |
| 63302 | K3I | 4500 0.17 0.20 | - | 10 |
| 182293 | K3IV | 4486 0.25 3.00 | 20 | 17 |
| G_196-9 | K5V | 4000 0.28 4.50 | - | 24 |
| 130705 | K4III | 4350 0.51 2.10 | 22 | 20 |
The first pPXF run shows a significant difference in the velocity dispersion values when different templates in Table 2 are used. The scatter in values gives an estimate of the uncertainty due to the multistellarity of galaxies. To reduce the effect of stellar population on the measured , a set of 50 mixed stellar templates (hereafter, Set50) from Indo-US library consisting of G/K-stars were simultaneously given to pPXF and the best combination was obtained by optimizing the values. For each galaxy spectrum, the Set50 pPXF run significantly improves upon a single template, the values are improved by 10% (on average), compared with 7% intrinsic statistical deviation of a single template pPXF run. This also points at the multistellar nature of galaxy spectra. The impact of the stellar template mismatch is discussed in §4.2. In 44% (20%) of the cases, the is improved by more than 10% (20%).
To explore the sensitivity of the final results to the number of templates, a set of 80 templates (hereafter Set80), consisting of Set50 and 30 more G/K-type templates, also chosen from Indo-US library, were used. Comparing the resulting velocity dispersion for Set50 and Set80 indicates that for 36 of 41 galaxies, the discrepancy in the results is less than 2% and it does not exceed 10% for the rest. Although a larger number of templates improves the results, it dramatically increases the computation time. Moreover, the use of Set80 instead of Set50 does not improve the significantly (i.e. 1% on average), and thus we did not continue adding more templates to Set80. We find that all galaxies are modelled with a combination of at least two templates. For 80% of the galaxies in our sample, more than two templates describe the spectra and in 30% of the cases, a mixture of more than 4 templates were chosen. The results of the Set80 pPXF run are assigned to each galaxy and used for the rest of this paper (See Table 6).
When we used Set80 (Set50), 38 (14) templates are not chosen to describe any of sample galaxies. 6 of 26 used templates from Set50 are not chosen again by pPXF when using Set80. Of 30 added templates to Set50, only 14 templates contribute to describe at least one galaxy spectrum in Set80 pPXF run. In table LABEL:tab:ftemplates, a list of stellar templates which are used to reproduce more than two galaxy spectra is provided.
4 Errors and Uncertainties
In this section we discuss the accuracy of our measurements and the sources of uncertainties.
4.1 Statistical Uncertainties
One important source of uncertainty is the statistical error which is highly correlated with the S/N. We adopt a “bootstrapping” technique to quantify this uncertainty. We simulate an ensemble of galaxy spectra covering the observed range of S/N, the broadening parameter, , and the velocity shift , using the stellar template spectra. To achieve a desired , the stellar template spectrum is convolved with a Gaussian function. Then random noise is added to achieve the desired S/N. For each observed galaxy spectra, a set of 300 realizations were generated, noting that, increasing the number of realizations does not alter the results. We then apply the same measurement technique.
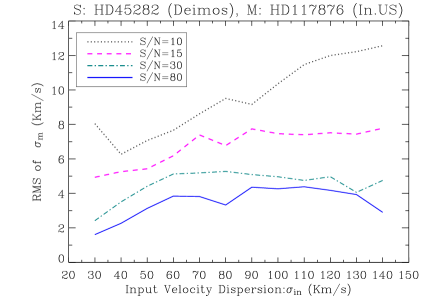
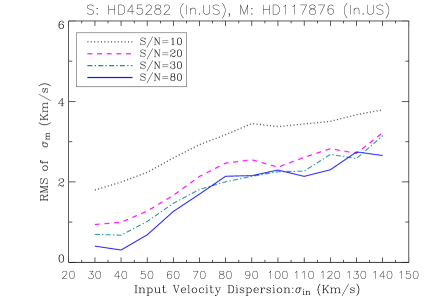
The measurements on each simulated set are carried out with the same initial parameters used in the measurement of original spectrum. Although the input spectral broadening, , for each set of simulated spectra is the same, the measured value () can be different, due to the noise, and forms a Gaussian distribution around a mean value. The mean of the measured values is not necessarily the same as the input value, due to a systematic shift. In general, for all templates in Table 2 and all probable S/N values, we obtained (i.e. the probability of obtaining for simulated galaxy with the initial velocity dispersion of ). To perform the simulations, for any given signal-to-noise ratio, is chosen to have a range of discrete values 10-100 . For other values of , we used the polynomial functions to obtain the mean and RMS of the measured velocity dispersion. This is explained in detail in section 3.3 of Co09. Figure 3 shows the relation between the input velocity dispersion and the RMS of the measured for different S/N values. As expected, is more uncertain when the S/N decreases or velocity dispersion increases. Left panel of Figure 3 indicates that the uncertainty in is higher when the template for the velocity dispersion measurement is from a different instrument compared to that for the simulated galaxy spectra.
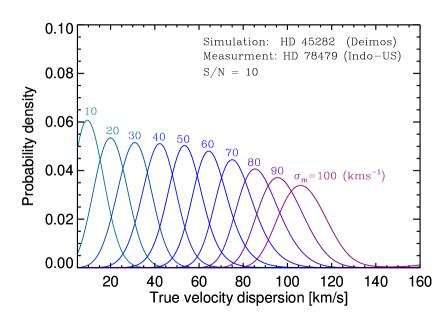
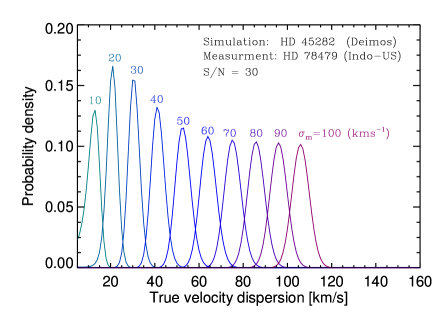
In reality, we have only one spectrum of each galaxy based on which we estimate its velocity dispersion, . Similarly, assume that of each set of simulated spectra with given S/N ratio and , we only have access to one spectrum and its measured velocity dispersion, . Therefore, to derive the initial velocity dispersion () and its uncertainty, we have to inverse the above statistics and find . This is what needs to be done for any given original galaxy spectrum. Having all for each , the probability of finding the true velocity dispersion, for any measured velocity dispersion, , is given by (Co09)
| (2) |
where . Figure 4, shows 4 examples of the probability density of true velocity dispersion for any given measured value, . In order to illustrate the dependency of the results upon the selected templates, for panels “a” and “b” of Figure 4, we used the stellar template HD161797 (G-star) and for panels “c” and “d” we used HD78479 (K-star). As seen, the peak centre of the probability distributions are not centred upon the true velocity dispersion. This systematic shift is mainly due to the template mismatch and other systematics caused by using different instruments for simulation and measurement. As seen in Figure 4, the location of the peak centres changes when we use different templates for measurements and for a given template it is independent of S/N. For any given velocity dispersion and stellar template, the S/N value affects mainly the statistical uncertainty and therefore the width of the Gaussian peaks.
To estimate the statistical inaccuracy of the final results, uncertainty is derived for each peak of the probability density. The simulated galaxy sample is generated based on the same templates used for the measurements. We performed the above procedure for all individual stellar templates in Table 2 which are initially used to measure and of the sample galaxies. Since all sample galaxies are observed with DEIMOS, in another run of simulations we applied DEIMOS stellar templates (i.e HD44007 or HD45282) for simulation and Indo-US templates for measurement. This method makes our analysis more realistic and enables us to study any additional sources of error due to the instrumental differences. When we apply individual stellar templates, the change in measured velocity dispersions for each galaxy is larger than the corresponding statistical error and we attribute this to the effect of the template mismatch which is investigated in §4.2.
4.2 Template Mismatch and Other Source of Uncertainties
The velocity dispersion measurement is highly sensitive to the width of the spectral lines in the stellar template based on which the measurements are carried out. The width of the lines is determined by chemical compositions, temperature and the age of the stars (Schulz et al. 2002; Lejeune at al. 1997 and references therein). On the other hand, any galaxy is a composite of different stellar populations and thus lack of any prior knowledge about the exact dominant stellar type is an additional source of uncertainty.
Velocity dispersion measurements of galaxies using the red part of the spectrum are reported to be less sensitive to systematic errors compared with measurements using the blue and visual spectral regions (Pritchet 1978). Our measurements are based on CaT lines which depend weakly on metallicity in metal rich stars (Mallik 1994). However, for metal poor stars, the effect of the metallicity on CaT lines could not be neglected (Starkenburg et al. 2010; Jorgensen et al. 1992; Zhou 1991; Smith & Drake 1990; Díaz et al. 1989) and therefore CaT lines are also employed as a metallicity indicator (Foster et al. 2010; Carrera et al. 2007; Michielsen et al. 2007). Moreover, evidence has been found for significant anti-correlation between Ca II triplet indices and central velocity dispersion of elliptical galaxies (Cenarro et al. 2003). Therefore, template mismatch may have a significant impact on the final results of measurements and, although, our measurements are based on 80 G/K-type stellar templates, we still need to quantify the uncertainty due to the template mismatch.
Another source of uncertainty appears when the galaxy and template spectra are observed with different instruments. This error is due to the difference in the sensitivity and resolution of the instruments. The full width at half maximum (FWHM) spectral resolution of the Indo-US templates is 1.0 Å and that of DEIMOS is about 1.6 Å for the wavelength range in this study. To take this into account, a proper Gaussian function is convolved with the higher resolution spectrum corresponding to the difference in the spectral resolution. In addition, the sampling rate of Indo-US and DEIMOS spectra are 0.4 Å/pixel and 0.3 Å/pixel, respectively. Although pPXF re-samples and re-bins both template and target galaxy spectra to account for this difference, this still may lead to systematic errors in the final results.
Due to the limited number of stellar templates observed with DEIMOS, we are unable to disentangle the uncertainty due to instrumental differences from the uncertainty due to template mismatch. As seen in Figure 4, the cumulative effect of both template mismatch and difference in the instruments (Indo-US and DEIMOS characteristics) causes systematics in the measured values. Therefore, the shifts seen between the and is due to both effects. Similar diagrams are generated for any selected Indo-US and DEIMOS stellar templates. All pairs of different templates and instruments are considered to study all sources of error and their contributions.
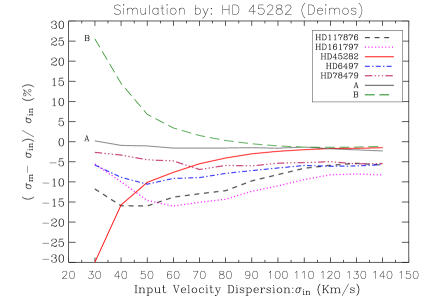
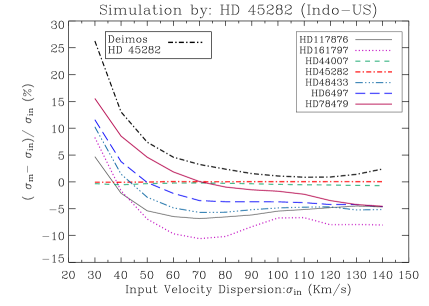
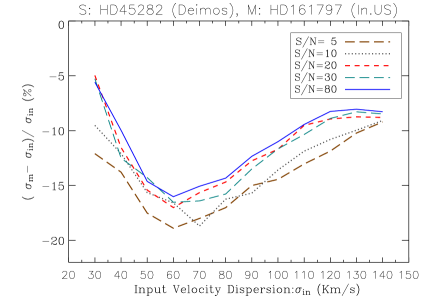
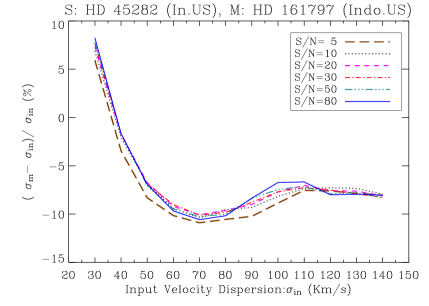
We generated a comprehensive set of simulated data using all stellar templates in Table 2 according to the recipe explained in section 4.1. In this method, measurements and simulations are carried out with different templates of the same instrument or with the similar templates from different instruments. The resulting velocity dispersions and given initial values are, then, compared after performing the cross measurements on the simulated data with various noise levels. Two examples are presented in Figure 5 which show the deviation of the measured values, , from the true input values, , for a given velocity dispersion. All simulations are carried out without adding any noise in order to explore the template mismatch effect. We obtained higher systematic errors by choosing the templates from different instruments. All curves in the left panel of Figure 5 illustrate this fact except for two curves A and B for which DEIMOS templates were used for measurements.
As expected, no significant systematic shift arises when the same template from the same instrument are used for simulation and also the measurement. Typically, the relative systematic errors tend to be constant and to slightly increase, respectively, for higher and lower velocity dispersions. To study the sensitivity of the systematics to the S/N, all aforementioned simulations are repeated with random noise added. Left and right panels in Figure 6 show the results for the same curves in corresponding panels of the Figure 5 including different noise levels. As seen, except for very low S/N (i.e. per pixel), the systematic errors are not affected by value of S/N. We repeated the procedure several times for different wavelength ranges and any pairs of templates and instruments in Table 2. In all cases, for the effective mean value of all uncertainties does not exceed 20% of the true value of the velocity dispersion.
Two examples are presented in Tables 4 and 5. In Table 5, we noticed higher measured values for HD44007 and HD45282 compared to the measured values using the other templates, even though HD44007 and HD161797 (i.e. the template used for simulation) have the same spectral type. We attribute this to lower metallicity (i.e. [Fe/H]) of both HD44007 and HD45282 compared to the other templates (see 2) and consequent systematic errors. As seen in the second and third columns of Table 5 (low metallicity stars with [Fe/H]), for , the average relative discrepancy between the measured values, , and input values, , is 20%. This value is reduced to 10% for the other templates. Further evidence for systematic uncertainties in the presence of metallicity differences is seen when measuring the velocity dispersion of our sample galaxies with HD44007 and HD45282 in a single template run which results in 25% larger values, on average, compared to those measured using multiple templates. This discrepancy is reduced to 5%, on average, for single pPXF run with the other 7 templates of Table 2.
| HD44007 | HD45282 | HD117876 | HD161797 | HD223-65 | HD142198 | HD48433 | HD6497 | HD78479 | ||
|---|---|---|---|---|---|---|---|---|---|---|
| (km s-1) | (G5IV) | (G0V) | (G8III) | (G5IV) | (G2IV) | (K0III) | (K1III) | (K2III) | (K3III) | |
| 10 | 1 | 11 | 5 | 17 | 14 | 8 | 14 | 12 | 5 | - |
| 20 | 11 | 14 | 20 | 22 | 17 | 20 | 22 | 21 | 22 | 45 |
| 30 | 26 | 25 | 27 | 29 | 30 | 27 | 28 | 28 | 29 | 17 |
| 40 | 35 | 36 | 34 | 35 | 40 | 34 | 35 | 36 | 39 | 15 |
| 50 | 46 | 47 | 43 | 43 | 42 | 43 | 44 | 45 | 49 | 16 |
| 60 | 57 | 57 | 52 | 51 | 52 | 53 | 53 | 55 | 58 | 15 |
| 70 | 68 | 68 | 62 | 60 | 62 | 62 | 63 | 64 | 67 | 14 |
| 80 | 79 | 79 | 72 | 69 | 72 | 72 | 80 | 74 | 76 | 14 |
| 90 | 89 | 90 | 82 | 79 | 83 | 83 | 83 | 84 | 86 | 12 |
| 100 | 100 | 101 | 93 | 89 | 93 | 100 | 93 | 94 | 100 | 11 |
| 110 | 111 | 112 | 104 | 100 | 110 | 104 | 110 | 105 | 110 | 9 |
| 120 | 122 | 123 | 120 | 110 | 114 | 115 | 114 | 120 | 116 | 8 |
| 130 | 133 | 134 | 125 | 120 | 125 | 126 | 130 | 125 | 126 | 8 |
| 140 | 144 | 146 | 136 | 130 | 140 | 136 | 134 | 140 | 136 | 7 |
| HD44007 | HD45282 | HD117876 | HD161797 | HD223-65 | HD142198 | HD48433 | HD6497 | HD78479 | |||
|---|---|---|---|---|---|---|---|---|---|---|---|
| (km s-1) | (G5IV) | (G0V) | (G8III) | (G5IV) | (G2IV) | (K0III) | (K1III) | (K2III) | (K3III) | ||
| 10 | 24.7 | 25.6 | 5.9 | 3.8 | 10.9 | 3.4 | 4.0 | 17.4 | 19.4 | - | - |
| 20 | 32.3 | 33.2 | 23.5 | 20.0 | 24.2 | 22.8 | 22.2 | 23.4 | 24.8 | 66 | 24 |
| 30 | 40.9 | 42.2 | 33.4 | 30.0 | 33.8 | 32.4 | 32.2 | 33.7 | 35.3 | 41 | 18 |
| 40 | 51.1 | 52.3 | 43.7 | 40.0 | 44.0 | 43.0 | 42.6 | 44.2 | 46.8 | 31 | 17 |
| 50 | 62.4 | 63.7 | 54.3 | 50.0 | 54.7 | 53.7 | 52.9 | 54.7 | 57.5 | 27 | 15 |
| 60 | 73.8 | 75.1 | 64.9 | 60.0 | 65.7 | 64.0 | 63.6 | 65.1 | 67.4 | 25 | 12 |
| 70 | 84.8 | 86.1 | 74.5 | 70.0 | 76.5 | 74.4 | 73.8 | 75.2 | 77.0 | 23 | 10 |
| 80 | 95.4 | 96.8 | 84.7 | 80.0 | 87.0 | 84.4 | 84.0 | 85.5 | 86.8 | 21 | 9 |
| 90 | 105.9 | 107.5 | 94.8 | 90.0 | 97.3 | 94.3 | 93.9 | 95.4 | 96.9 | 19 | 8 |
| 100 | 116.4 | 118.3 | 105.4 | 100.0 | 107.5 | 104.8 | 103.9 | 105.7 | 106.7 | 18 | 8 |
| 110 | 127.0 | 129.1 | 115.8 | 110.0 | 117.7 | 115.2 | 114.1 | 115.8 | 116.7 | 17 | 7 |
| 120 | 137.6 | 140.0 | 125.7 | 120.0 | 128.0 | 125.1 | 124.1 | 126.3 | 126.4 | 17 | 7 |
| 130 | 148.4 | 150.9 | 136.5 | 130.0 | 138.2 | 135.6 | 134.2 | 136.2 | 136.2 | 16 | 6 |
| 140 | 159.2 | 161.9 | 147.1 | 140.0 | 148.5 | 146.2 | 144.0 | 146.6 | 146.1 | 16 | 6 |
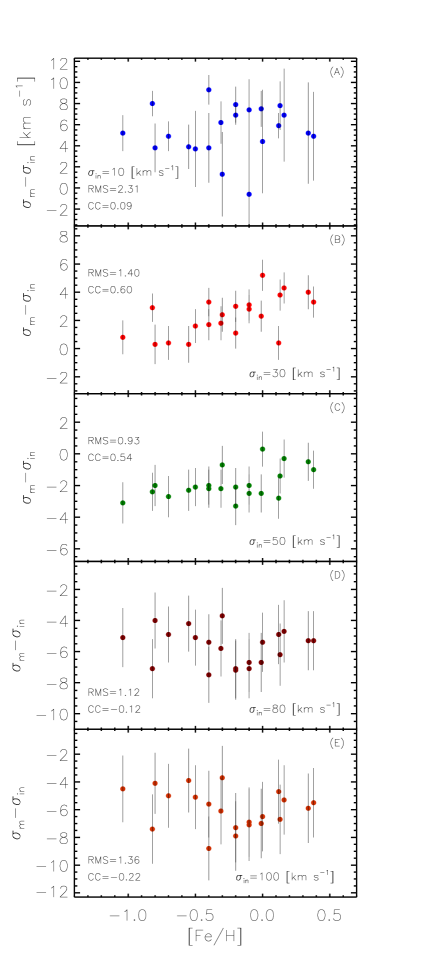
In order to examine the effect of the galaxy and stellar template metallicity on measured velocity dispersions, we used 21 stellar templates with the same spectral type (i.e. G8III) from Indo-US library and different metallicity. As seen in Figure 7, we used the stellar spectra HD45282, observed by DEIMOS, to simulate galaxies with desired velocity dispersions, i.e. . In each case, 300 simulated spectra with S/N=30 were created. Then, the velocity dispersion of the simulated galaxies were measured using the stellar templates with the same spectral type but different metallicity. Figure, 7 shows that differences between the measured and input velocity dispersion are independent of the template metallicity within uncertainty in measured velocity dispersions. Due to the template mismatch effect, in each panel of the Figure 7, there is an offset between the given velocity dispersion and the mean value of the measured velocity dispersions using the templates with different metallicity. This offset is due to the template mismatch effect and for a given spectral type, it seems to be independent of the template metallicity.
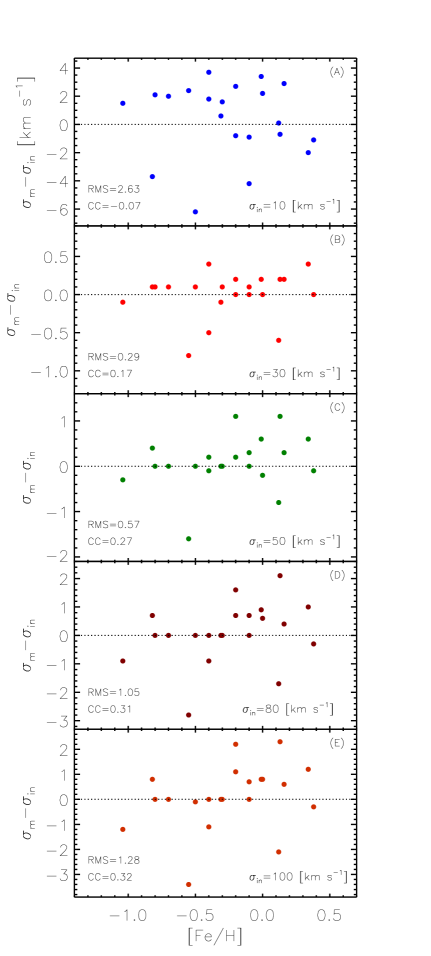
In Figure 8, we used the mixed stellar templates, i.e. Set80, for measuring the velocity dispersion of simulated galaxies with different metallicities. To perform the simulations, we broadened the stellar templates with different metallicities (i.e. the G8III-type stars used in Figure 7) according to desired input velocity dispersions. At very low velocity dispersion (i.e. ) the mean value of the measured velocity dispersion for all simulated spectra with different metallicities is . For , the measurements result in the same value as the input values and are independent of metallicity. As a conclusion, based on the simulations, using the mixed stellar templates results in more reliable measurements and reduces the effect of template mismatch. To confirm these results, we measured the velocity dispersion of the simulated spectra in all panels of Figure 7 using Set80. For panels of Figure 7, from top to bottom, the results are and , respectively. As expected, there is no significant offset from the input velocity dispersion when we use the mixed stellar templates.
| GMP | RA | Dec | S/N | # of | |||||||||
|---|---|---|---|---|---|---|---|---|---|---|---|---|---|
| ID | (J2000) | (J2000) | mag | 1/pix | Temp. | ||||||||
| (1) | (2) | (3) | (4) | (5) | (6) | (7) | (8) | (9) | (10) | (11) | (12) | (13) | (14) |
| 3534 | 12:59:21.40 | 27:58:24.80 | 16.13 | 6001 | 7 | 30 | 7 | 7 | 3 | 45 | 7 | ||
| 3474 | 12:59:26.40 | 27:59:18.30 | 18.69 | 7666 | 6 | 22 | 4 | 3 | 2 | 37 | 5 | ||
| 3471 | 12:59:26.60 | 27:59:54.50 | 15.35 | 6624 | 13 | 79 | 5 | 5 | 2 | 80 | 7 | ||
| 3438 | 12:59:28.50 | 28:01:09.40 | 18.05 | 5952 | 31 | 26 | 8 | 7 | 3 | 16 | 3 | ||
| 3424 | 12:59:29.30 | 27:56:32.00 | 18.27 | 5596 | 7 | 27 | 9 | 7 | 5 | 29 | 6 | ||
| 3406 | 12:59:30.30 | 28:01:15.10 | 17.41 | 7116 | 7 | 36 | 3 | 2 | 2 | 29 | 3 | ||
| 3376 | 12:59:32.10 | 27:55:15.80 | 17.25 | 7004 | 22 | 37 | 3 | 3 | 2 | 19 | 5 | ||
| 3340 | 12:59:35.20 | 27:56:05.00 | 17.73 | 4476 | 12 | 43 | 8 | 6 | 5 | 17 | 2 | ||
| 3336 | 12:59:35.50 | 27:54:21.60 | 17.61 | 6954 | 6 | 42 | 4 | 4 | 2 | 47 | 5 | ||
| 3325 | 12:59:36.00 | 27:54:22.00 | 17.58 | 8953 | 13 | 38 | 7 | 6 | 2 | 18 | 2 | ||
| 3312 | 12:59:37.00 | 28:01:07.00 | 17.42 | 7156 | 27 | 31 | 4 | 3 | 2 | 44 | 5 | ||
| 3308 | 12:59:37.20 | 27:58:19.90 | 18.09 | 7522 | 8 | 50 | 4 | 3 | 2 | 57 | 4 | ||
| 3296 | 12:59:37.90 | 27:54:26.40 | 14.3 | 7948 | 21 | 178 | 7 | 5 | 4 | 87 | 1 | ||
| 3292 | 12:59:38.00 | 28:00:03.70 | 16.25 | 4951 | 8 | 40 | 5 | 3 | 3 | 48 | 5 | ||
| 3223 | 12:59:42.40 | 28:01:58.60 | 18.41 | 7797 | 16 | 22 | 9 | 8 | 5 | 11 | 3 | ||
| 3209 | 12:59:44.20 | 28:00:47.00 | 18.58 | 7111 | 17 | 30 | 5 | 4 | 2 | 30 | 5 | ||
| 3166 | 12:59:46.90 | 27:59:30.90 | 17.39 | 8292 | 7 | 38 | 6 | 6 | 3 | 26 | 4 | ||
| 3146 | 12:59:48.60 | 27:58:58.00 | 17.74 | 5358 | 10 | 38 | 11 | 9 | 6 | 11 | 3 | ||
| 3141 | 12:59:49.10 | 27:58:33.90 | 19.86 | 4957 | 26 | 59 | 15 | 11 | 10 | 5 | 2 | ||
| 3131 | 12:59:50.20 | 27:54:45.50 | 17.29 | 7183 | 14 | 19 | 7 | 6 | 4 | 22 | 4 | ||
| 3119 | 12:59:51.50 | 27:59:35.50 | 19.74 | 7060 | 14 | 37 | 10 | 9 | 5 | 8 | 3 | ||
| 3098 | 12:59:53.90 | 27:58:13.70 | 17.73 | 6740 | 8 | 33 | 7 | 5 | 5 | 28 | 5 | ||
| 3080 | 12:59:55.70 | 27:55:03.80 | 18.11 | 6599 | 10 | 9 | 8 | 6 | 5 | 19 | 5 | ||
| 3018 | 13:00:01.00 | 27:59:29.60 | 18.17 | 7464 | 10 | 38 | 5 | 5 | 3 | 15 | 3 | ||
| 2983 | 13:00:04.00 | 28:00:30.70 | 19.03 | 6349 | 10 | 27 | 6 | 5 | 3 | 18 | 3 | ||
| 2960 | 13:00:05.40 | 28:01:28.00 | 15.18 | 5866 | 7 | 60 | 5 | 5 | 3 | 62 | 5 | ||
| 2931 | 13:00:07.10 | 27:55:51.50 | 17.59 | 7704 | 17 | 35 | 6 | 4 | 4 | 47 | 5 | ||
| 2877 | 13:00:11.40 | 27:54:36.40 | 18.71 | 7225 | 12 | 29 | 9 | 8 | 5 | 14 | 5 | ||
| 2839 | 13:00:14.70 | 28:02:26.90 | 14.43 | 5706 | 15 | 168 | 6 | 5 | 3 | 57 | 4 | ||
| 2808 | 13:00:17.00 | 27:54:16.10 | 19.64 | 8944 | 16 | 69 | 12 | 9 | 8 | 13 | 2 | ||
| 2780 | 13:00:18.70 | 27:55:12.70 | 19.06 | 6554 | 18 | 63 | 12 | 9 | 8 | 13 | 2 | ||
| 2755 | 13:00:20.20 | 27:59:37.60 | 18.87 | 6812 | 13 | 27 | 9 | 8 | 4 | 14 | 2 | ||
| 2736 | 13:00:21.70 | 27:53:54.80 | 16.41 | 4857 | 5 | 35 | 4 | 3 | 2 | 42 | 4 | ||
| 2718 | 13:00:22.70 | 27:57:55.00 | 18.76 | 6360 | 12 | 30 | 8 | 7 | 4 | 13 | 4 | ||
| 2676 | 13:00:26.20 | 28:00:32.00 | 17.86 | 5516 | 30 | 37 | 8 | 7 | 4 | 19 | 4 | ||
| 2655 | 13:00:27.90 | 27:59:16.50 | 19.46 | 9412 | 14 | 45 | 5 | 5 | 2 | 12 | 3 | ||
| 2654 | 13:00:28.00 | 27:57:21.60 | 14.87 | 7009 | 21 | 144 | 7 | 6 | 3 | 66 | 3 | ||
| 2605 | 13:00:33.30 | 27:58:49.40 | 18.28 | 5126 | 12 | 36 | 10 | 8 | 6 | 13 | 3 | ||
| 2591 | 13:00:34.40 | 27:56:05.00 | 17.17 | 8653 | 14 | 53 | 9 | 8 | 4 | 20 | 2 | ||
| 2571 | 13:00:36.60 | 27:55:52.20 | 18.68 | 5944 | 18 | 17 | 6 | 5 | 3 | 20 | 3 | ||
| 2563 | 13:00:37.30 | 27:54:41.10 | 19.5 | 5895 | 11 | 25 | 10 | 9 | 5 | 9 | 2 |
4.3 Best-Fit Error Analysis
In addition to the above, we repeated the same analysis for each galaxy to construct an ensemble of simulated spectra by adding the corresponding random noise to the best fits provided by pPXF (e.g red curve in Fig. 2). This technique effectively gives the statistical errors of both measured radial velocity and velocity dispersion. In the case of having few templates (e.g. when using Set50 or Set80), this method is applied with the use of the equivalent synthetic template based on the best output weights. Applying the multiple stellar templates reduces the effect of the template mismatch particularly when dealing with low S/N spectra of faint galaxies which are expected to have smaller mass and internal velocity dispersion.
4.4 The Catalogue Uncertainties
All the stellar templates in Table 2 were used to measure velocity dispersions for each galaxy in our sample. We used the RMS scatter around the mean values as the likely template mismatch uncertainty (see column 9 of the Table 6). Since the exact combination of the stellar templates is unknown for each galaxy, the exact value of the template mismatch uncertainty depends on the selected templates for measurements. Even though Table 2 covers various metallicities and spectral types, choosing another set of templates may slightly alter this estimate, due to the multistellarity of galaxies. For 66% of the galaxies in Table 6, the mismatch error is estimated to be less than 20% and only exceeds 25% for 22% of the galaxies. The average template mismatch errors are 4%, 12% and 18% for galaxies with the measured velocity dispersions greater than 100 , between 50 & 100 and between 20 & 50 , respectively. These results which are purely obtained from observation are consistent with those estimated using simulations described in §4.2. Figure 5 shows that the mismatch effect decreases as the velocity dispersion increases. Simulations indicate that the average uncertainty due to the template mismatch is about 15% for and 5% for , which is consistent with the reported values in column 9 of the Table 6.
In §3, it is mentioned that using Set50 improves the by 10% on average, while adding 30 more templates reduces the by only 1% on average. Hence, a larger number of templates was not considered due to its very limited effect. Since the reported is based on the Set80 and the corresponding statistical uncertainty (see §4.3) is not very different from that of the individual template analysis (see §4.1), we obtained the statistical uncertainties for each sample galaxy by applying the method described in §4.1 and §4.3 for Set80 (see column 10 of the Table 6). Assuming that the use of the Set80 eliminates the mismatch effect (see §4.2), one can take these values as the final uncertainty of the measured velocity dispersions. Being more conservative, in column 8 of Table 6, we derived the final error of the measured as the quadratic combination of both uncertainties (columns 10 & 11). These values are used for further analysis in this paper and paper II (Kourkchi et al. 2011b).
We performed the same analysis to obtain the uncertainty of the measured radial velocities. The effect of the template mismatch on measured radial velocities is less than 1%, because this measurement is only sensitive to the exact location of the absorption lines of the applied stellar templates which are slightly altered from one template to another. The final radial velocities and their corresponding uncertainties are obtained based on the Set80 run (columns 5 & 6 of the Table 6).

5 Results and Discussion
We present the radial velocities, , and velocity dispersions, , of 41 dwarf elliptical galaxies in the Coma cluster in Table 6. Of these galaxies, 12 have per pixel in their spectra. The reported values are measured based on Set80, as explained in §3.
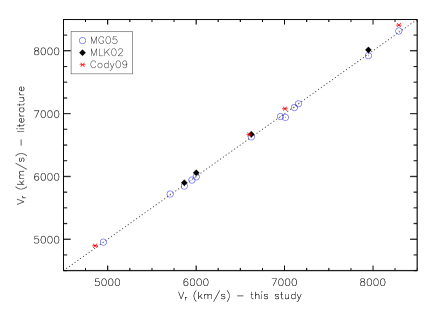
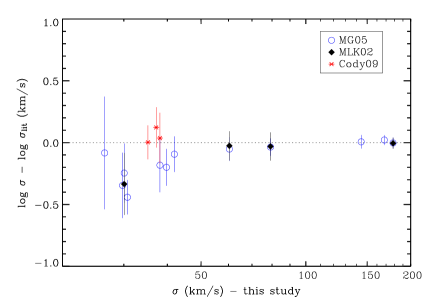
We compare our measured and values with MG05, MLKC02 and Co09 in Figures 9 and 10. The mean difference between our values and those of MG05 is 8 . However when we include the measurements from Co09, the mean difference is 20 . Comparison of the velocity dispersion with MG05 (see Fig. 10) shows that for smaller values of velocity dispersion (i.e. ), our values are relatively smaller. Such discrepancy is likely due to the different methods of measurement, and/or to different templates used for measurement and/or to different wavelength regimes used for analysis. Since CaT lines are more prominent in dE galaxies than the absorption lines in the wavelength range 4200-5700 Å, as used in studies of MG05 and Co09, our measurements of and are more robust. Our analysis also includes measurements with 80 mixed stellar templates and detailed analysis of the uncertainties.
In addition, of 41 studied galaxies in this paper, 12 galaxies were observed twice using two different masks. In Table 7, for each of these galaxies we compare the measured velocity dispersions using both observed spectra. We also added both spectra of these galaxies to get better signal-to-noise ratios and then repeated the measurements. As seen, considering the statistical uncertainties, the measurements are consistent.
| GMP | Coma1-1 | Coma1-2 | Coma2-1 | Coma2-2 | Add |
|---|---|---|---|---|---|
| 3424 | 277 | 267 | 275 | ||
| 3223 | 169 | 298 | 225 | ||
| 3209 | 323 | 295 | 302 | ||
| 3119 | 407 | 327 | 375 | ||
| 3080 | 89 | 139 | 95 | ||
| 2983 | 236 | 285 | 273 | ||
| 2877 | 328 | 307 | 295 | ||
| 2808 | 7511 | 719 | 698 | ||
| 2755 | 226 | 317 | 274 | ||
| 2718 | 335 | 296 | 304 | ||
| 2605 | 419 | 328 | 366 | ||
| 2571 | 174 | 144 | 173 |
5.1 Faber Jackson Relation
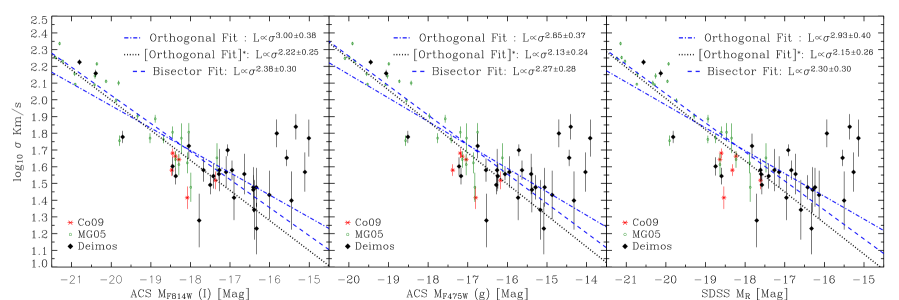
The relation between luminosity and velocity dispersion of bright elliptical galaxies was originally discovered by Faber & Jackson (1976) and is expressed as . For brighter ellipticals is 4 while fainter galaxies exhibit a shallower slope. Davies et al. (1983) were the first to note that changes from 4 to 2.4, for elliptical galaxies fainter than mag. This result was also confirmed by Held et al. (1992) who found for dE galaxies. These results were finally extended to lower luminosities by MG05 and Co09 who found . In this paper, we present data for 26 dE galaxies in the Coma cluster down to mag. Using the orthogonal distance regression, we derive the F-J relation to be for entire sample, and for galaxies brighter than mag.
We show the relation for the galaxies in our sample in Figures 11 and 12, where we also include the sample of Co09 and MG05. We excluded the spiral galaxies from Co09 when deriving the F-J relation. correlation coefficient is -83%, at a significance of 99.99% (i.e., only a 0.01% chance that the correlation is due to the random scatter). We perform linear fits via two methods, the least square bisector fit and the orthogonal distance regression. Both methods incorporate the errors in our measurements and those reported in the literature.
In orthogonal distance regression, the orthogonal distance of data points from the line is minimized. The magnitude of all galaxies in Figure 11 and the left panel of Figure 12 are derived from SDSS DR7. To transform SDSS magnitudes into Johnson-Cousins R magnitude, we used the mean value of the following relations presented by Lupton 2005222For various transformations between SDSS magnitudes to Johnson-Cousins system see Jordi et al. (2006), Ivezić et al. (2007) and
http://www.sdss.org/dr6/algorithms/sdssUBVRITransform.html:
| Sample Galaxies | Filter | Regression | Slope (A) | Intercept (B) | |
|---|---|---|---|---|---|
| (1) | (2) | (3) | (4) | (5) | (6) |
| DEIMOS+MG05 | SDSS-R | ||||
| DEIMOS+MG05 | SDSS-R | ||||
| DEIMOS+MG05 | SDSS-R | ||||
| DEIMOS+MG05 | SDSS-R | ||||
| DEIMOS∗+MG05 | SDSS-R | ||||
| DEIMOS+MG05+Co09 | SDSS-R | ||||
| DEIMOS+MG05+Co09 | SDSS-R | ||||
| DEIMOS∗+MG05+Co09 | SDSS-R | ||||
| DEIMOS+MG05+Co09 | CFHTLS-i | ||||
| DEIMOS+MG05+Co09 | CFHTLS-i | ||||
| DEIMOS∗+MG05+Co09 | CFHTLS-i | ||||
| DEIMOS∗+MG05+Co09 | HST/ACS-F814W (I) | ||||
| DEIMOS∗+MG05+Co09 | HST/ACS-F475W (g) | ||||
| DEIMOS∗+MG05+Co09 | SDSS-R |
All galaxies in DEIMOS+MG05+Co09 sample have HST/ACS data. DEIMOS∗ represents the DEIMOS sample excluding galaxies fainter than mag.
| (3) |
| (4) |
The results of the least square fits are available in Table 8. We run the same analysis for the same sample using the CFHT Megacam i-band data. We find that our FJ relation slope is consistent with those of Co09 and MG05 within the errors, for both linear fitting methods. The least square bisector method yields , while we derive via the orthogonal regression method. Using the CFHT i-band data, the best fits of FJ relation are consistent with those derived from SDSS data (see Table 8). The behaviour at the faint end of the FJ relation is uncertain as many of our galaxies in this magnitude range () have per pixel. However our results imply that the slope of the FJ relation may change towards higher velocity dispersions at this faint end. Excluding galaxies fainter than , FJ is .
Next, we use photometry from the HST/ACS Coma Treasury survey (Carter et al. 2008) to derive the FJ relation. Out of 41 galaxies in our sample, 28 have available HST/ACS magnitudes, together with 43 galaxies from MG05 and Co09 samples. In Figure 12 and Table 8, we show the best linear fits of the FJ relation using HST/ACS F814W (I-band) and F475W (g-band). We find that the FJ relation shows no discrepancy on colour.
Following all above analysis, we noted that for one of our sample galaxies (GMP 3308), the SDSS magnitudes are almost one magnitude fainter than what is derived from CFHT and HST images. Therefore, we modified the SDSS R magnitude of this galaxy by constructing a linear trend between the CFHT i-band and SDSS R magnitudes of all sample galaxies.
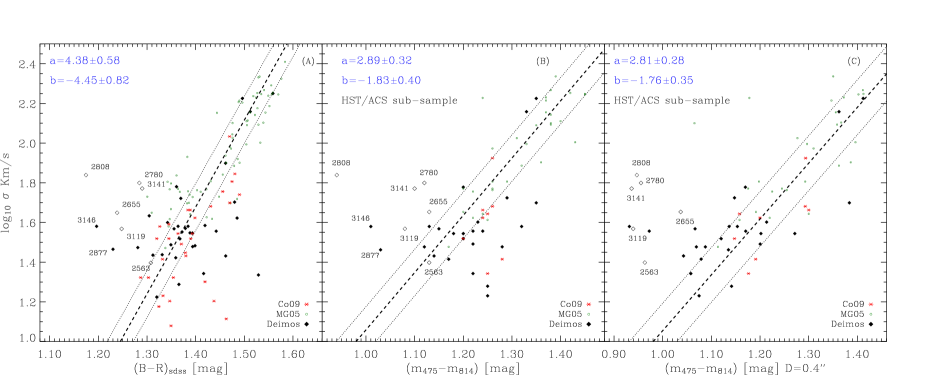
5.2 Colour- relation
The relation between dynamical mass of galaxies and their stellar population can be studied using the colour- diagram. MG05 showed a well-defined colour- relation for faint early type galaxies brighter than mag. In panel (A) of Figure 13, we extend the relation to fainter dEs ( mag) which are located at the blue end of the diagram and are more scattered around the the fitted line for brighter galaxies (i.e. for mag the relation is ). The scatter of dEs around the colour- relation could be due to their different formation history, age and metallicity. To calculate the colour of the galaxies, B-R, we used the SDSS data and Lupton (2005) transformation functions to derive the Johnson B and R magnitudes. Panel (B) of Figure 13 shows the same relation using colour of the galaxies in the HST/ACS field.
The dependence of the internal velocity dispersion of dEs and their central activity is investigated in panel (C) of Figure 13. Central colour of the galaxies, for which we have the HST/ACS images, are calculated within the aperture with diameter of (i.e. 185 pc at the location of the Coma cluster). We found a linear trend between the velocity dispersion of dEs and their central colours, except for very faint galaxies which have bluer core, .
| GMP | () | ||
|---|---|---|---|
| ID | Set80 | FGK-lib | F-lib |
| 3146 | 38 | 37 | 35 |
| 3141 | 59 | 60 | 61 |
| 3119 | 37 | 35 | 26 |
| 2877 | 29 | 27 | 26 |
| 2808 | 69 | 39 | 38 |
| 2780 | 63 | 63 | 31 |
| 2655 | 45 | 45 | 42 |
| 2563 | 25 | 25 | 28 |
5.3 Remarks on faint galaxies
Of six faintest galaxies from Deimos sample, GMP2808, GMP2655, GMP3119, GMP2780 and GMP3141 are bluer than all other sample galaxies (see Figure 13) and have larger velocity dispersion with respect to the L- relation of brighter galaxies (see Figure 8).
In order to test the effect of stellar population on measured velocity dispersions, we have repeated the measurement using two sets of stellar templates. First set consists of 10 F-stars with different spectral types and metallicities (hereafter F-lib). Second set includes both F-lib and the G/K-stars of Table LABEL:tab:ftemplates (hereafter FGK-lib). The results of measurements based on Set80, FGK-lib and F-lib are compared in Table 9. The analysis based on FGK-lib shows no changes in results except for GMP2808 which is the bluest galaxy in our sample. The measured of GMP3119 and GMP2808 in F-lib run is smaller than those of Set80 and FGK-lib runs, however the resulting is higher for F-lib run. The maximum change in measured for all other galaxies in our sample in FGK-lib run is less than 2 . As a results, the measured values in Table 6 are independent of the stellar population except for the bluest galaxy, for which blue stellar templates should be used for measurement.
Recent gas-rich mergers in blue dEs may be responsible for their deviation from the FJ relation. Supernova driven winds can expel the luminous matter of these galaxies and shift them to the faint end of the FJ diagram. Moreover, the resulting starburst due to the inward gas transportation during the merger, produces the central excess light compared to the extrapolated Sérsic function of the galaxy outer region (Kormendy et al. 2009). The correlation between the central extra light and deviation of faint dEs from the scaling relations of brighter ellipticals is studied in paper II.
6 Summary
We have observed a sample of 50 dwarf elliptical galaxies in the core of Coma cluster of which for 41 dwarfs we measured their internal velocity dispersion. For 26 galaxies, we presented the velocity dispersion for the first time. Our current study extends the relation one magnitude fainter than previous studies in Coma. We performed a comprehensive analysis to find the source of the uncertainties when measuring the velocity dispersion. We found that the main uncertainty may arise due to the mismatch of the stellar templates. This kind of uncertainty is less than 20% of the measured velocity dispersion for . The template mismatch uncertainty decreases for higher velocity dispersions and is reduced to for . We find greater velocity dispersions when using templates with lower stellar metallicities. The effect of template mismatch is reduced with the use of multiple stellar templates and the optimization of the template weights to reproduce each sample galaxy spectrum. In addition, using the multiple stellar templates removes the dependency of the measurements on galaxy and/or templates metallicity. Casting our data points and those from the literature, we get L- relation as . We noticed that fainter dwarfs show a departure from the FJ relation of the brighter ellipticals which indicates that they have higher velocity dispersion than what is predicted by L- linear trend. In paper II, we will present the combined study of the photometric and spectroscopic properties of this sample, focusing on the fundamental and the photometric plane of the galaxies.
Acknowledgments
The authors wish to recognize and acknowledge the very significant cultural role and reverence that the summit of Mauna Kea has always had within the indigenous Hawaiian community. We are most fortunate to have the opportunity to conduct observations from this mountain. DC and AMK acknowledge support from the Science and Technology Facilities Council, under grant PP/E/001149/1. EMQ acknowledges support from the SMES for a FPI PhD fellowship through the research project AYA2007-67752-C03-01. EK would like to thank Paul Westoby and Michele Cappelari for their helpful comments to run pPXF. EK also acknowledges financial supports from Sharif University of Technology. This research also used the facilities of the Canadian Astronomy Data Centre operated by the National Research Council of Canada with the support of the Canadian Space Agency.
References
- Aaronson (1983) Aaronson, M. 1983, ApJL, 266, L11
- Adami et al. (2006) Adami, C., et al. 2006, A&A, 451, 1159
- Bender et al. (1992) Bender, R., Burstein, D. & Faber, S.M. 1992, ApJ, 399, 462
- Cappellari & Emsellem (2004) Cappellari, M. & Emsellem, E. 2004, PASP, 116, 138
- Carrera et al. (2007) Carrera, R., Gallart, C., Pancino, E. & Zinn, R. 2007, AJ, 134, 298
- Carter et al. (2008) Carter, D., et al. 2008, ApJS, 176, 424
- Cenarro et al. (2003) Cenarro, A. J., et al. 2003, MNRAS, 339, 12
- Cody et al. (2009) Cody. A.M., Carter, D., Bridges, T. J., Mobasher, B. & Poggianti, B. M. 2009, MNRAS, 396, 1647 (Co09)
- Davis et al. (2003) Davis, M., Faber, S.M., Newman, J.A., et al. 2003, Proc SPIE, 4834, 161
- De Rijcke et al. (2006) De Rijcke, S., Prugniel, P., Simien F., & Dejonghe, H., 2006. MNRAS, 369, 1321
- Dekel & Silk (1986) Dekel. A., & Silk, J. 1986, ApJ, 303, 39
- Díaz et al. (1989) Díaz, A I., Terlevich, E., Terlevich, R. 1989, MNRAS, 239, 325
- Djorgovski & Davis (1987) Djorgovski, S. & Davis, M. 1987, ApJ, 313, 59
- Dressler et al. (1987) Dressler, A., Lynden-Bell, D., Burstein, D., Davies, R.L., Faber, S.M., Terlevich, R. & Wegner, G. 1987, ApJ, 313, 42
- Faber et al. (2003) Faber, S.M. et al. 2003, Proc SPIE, 4841, 1657
- Faber & Jackson (1976) Faber, S. M., & Jackson, R. E., 1976, ApJ, 204, 668
- Foster et al. (2010) Foster, C., Forbes, D. A., Proctor, R. N., Strader, J., Brodie, J. P. & Spitler, L. R. 2010, AJ, 139, 1566
- Geha et al. (2002) Geha, M., Guhathakurta, P. & van der Marel, R. P. 2002., AJ, 124, 3073
- Godwin & Metcalfe & Peach (1983) Godwin J., G., Metcalfe, N., & Peach, J., V. 1983, MNRAS, 202, 113
- Graham & Guzman (2003) Graham, A.W. & Guzmán, R. 2003, AJ, 125, 2936 (GG05)
- Held et al. (1992) Held, E. V., de Zeeuw, T., Mould, J., & Picard, A., 1992, AJ, 103,851
- Ivezic et al. (2007) Ivezić, Ž., et al. 2007, ASPC, 364, 165
- Jordi et al. (2006) Jordi, K., Grebel, E. K. & Ammon, K. 2006, A&A, 460, 339
- Jorgensen et al. (1996) Jørgensen, I., Franx, M. & Kjaergaard, P. 1996, MNRAS, 280, 167
- Jorgensen et al. (1992) Jørgensen, U. G., Carlsson, M. & Johnson, H. R. 1992, A&A, 254, 258
- Kormendy et al. (2009) Kormendy, J., Fisher, D.B., Cornell, M.E. & Bender, R. 2009, ApJS, 182, 216
- Kourkchi et al. (2011b) Kourkchi, E., Khosroshahi, H. G., Carter, D. & Mobasher, B. 2011b (submitted to MNRAS; Paper II)
- Lejeune et al. (1997) Lejeune, Th., Cuisinier, F., Buser, R. 1997, A&AS, 125, 229
- Mateo (1998) Mateo, M. 1998, ARA&A, 36, 435
- Mallik (1994) Mallik, S. V. 1994, A&AS, 103, 279
- Marzke et al. (2011) Marzke et al. 2011 (in preparation)
- Matković & Guzmán (2005) Matković, A. & Guzmán, R. 2005, MNRAS, 362, 289
- Michielsen et al. (2007) Michielsen, D. et al. 2007, ApJ, 670, 101
- Moore et al. (2002) Moore, S.A.W., Lucey, J.R., Kuntschner, H. & Colless, M. 2002, MNRAS, 336, 382 (MLKC02)
- Pritchet (1978) Pritchet, C. 1978 ApJ, 221, 507
- Schulz et al. (2002) Schulz, J., Fritze-v. Alvensleben, U., Möller, C. S. & Fricke, K. J. 2002, A&A, 392, 1-11
- Smith & Drake (1990) Smith, G., Drake, J. J. 1990, A&A, 231, 125
- Starkenburg et al. (2010) Starkenburg, E., et al. 2010, A&A, 513A, 34
- Toloba et al. (2011) Toloba, E., Boselli, A., Cenarro, A. J., Peletier, R. F., Gorgas, J., Gil de Paz, A. & Muñoz-Mateos, J. C., 2011, A&A, 526, 114
- Tonry & Davis (1979) Tonry, J. & Davis, M. 1979, AJ, 84, 1511
- Valdes et al. (2004) Valdes, F., Gupta, R., Rose, J.A., Singh, H.P. & Bell, D.J. 2004, ApJS, 152, 251
- Wilkinson et al. (2002) Wilkinson, M. I., Kleyna, J., Evans, N. W. & Gilmore, G. 2002, MNRAS, 330, 778
- Yoshii & Arimoto (1987) Yoshii, Y. & Arimoto, N. 1987, A&A, 188, 13
- Zhou, Xu (1991) Zhou, Xu 1991, A&A, 248, 367