First measurement of the partial widths of 209Bi decay to the ground and to the first excited states.
Abstract
209Bi alpha decay to the ground and to the first excited state have been contemporary observed for the first time with a large BGO scintillating bolometer. The half-life of 209Bi is determined to be =(2.010.08)1019 years while the branching ratio for the ground-state to ground-state transition is (98.80.3)%.
pacs:
23.60.+e, 29.40.Mc, 29.40.Vj
I INTRODUCTION
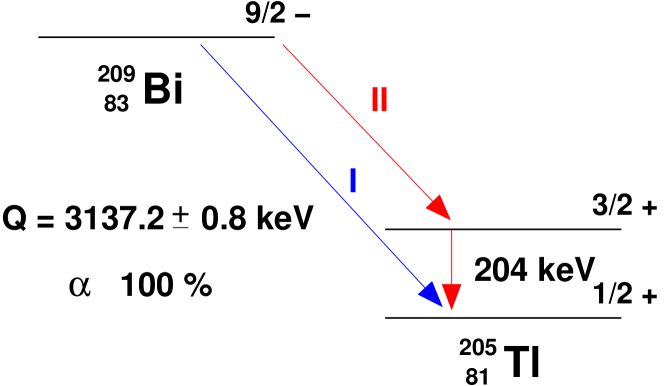
209Bi is the only naturally abundant isotope of bismuth. Its -decay to 205Tl was predicted on the basis of the 209Bi mass excess, but escaped direct observation until 2003 when it was observed with a small BGO scintillating bolometer, Ref. nature . In that work – due to the small mass of the detector – only the partial width for the ground state decay was measured, resulting in a half-life of (1.90.2)1019 yr. The decay was in that case ascribed to 209Bi on the basis of the energy measured for the emitted line, interferences from other -decaying isotopes – like 190Pt and 186Os – were excluded making reasonable assumptions on the purity of the crystal. However, the decay can proceed either as a direct transition to the 205Tl ground state (GS-GS transition) or as a transition to the first excited level of 205Tl (GS-ES transition), see Fig. 1. The contemporary observation of both the lines would provide – as observed also in Ref. nature – the real conclusive test on the identification of 209Bi decay.
In this paper we report the first experimental evidence for 209Bi decay to the 204 keV excited level of 205Tl, the measurement of the branching ratio for the two transitions and finally the evaluation of 209Bi half-life.
II EXPERIMENTAL TECHNIQUE
The detector used for this study is a BGO scintillating bolometer. This is realized instrumenting a Bi4Ge3O12 crystal with a temperature sensor and coupling it to a Light Detector (LD). Both the BGO crystal and the LD operate as bolometers, at a temperature of few tens of mK. The working principle is quite simple: the energy released by an ionizing particle that traverses the BGO crystal is converted both into scintillation light and into heat. The former gives rise to a light pulse that is recorded by the LD, the latter produces a temporary temperature increase of the BGO crystal that is recorded by its temperature sensor. The fraction of the total deposited energy spent in scintillation depends on the nature of the particle and is called Light Yield. ’s and ’s have the same LY, which is typically different from that of ’s or neutrons; in this way heat and light signals can be used to disentangle particle identity. At room temperature BGO crystals produce about (8-10)103 scintillation photons for a 1 MeV electron, corresponding to a LYγ of the order of 20-26 keV/MeV. The scintillation yield increases when cooling the crystal 111see for example Saint Gobain data-sheets.
II.1 Detectors and experimental set-up
The design of the single BGO bolometer and of the LD follows that of the other macro-bolometers operated in the past by our groups (Ref. cadmio ; seleniuro ). The main bolometer is a 5x5x5 cm2 BGO crystal (with a mass of 889.09 g) purchased from SICCAS (China) with optically grade surfaces. The crystal is secured inside a copper holder and is surrounded on 5 faces by a light reflector (3M VM2002). Attached to the crystal is an NTD Ge thermistor (Ref. NTD ) that acts as thermometer: the temporary temperature increase of the crystal – following particle interaction – produces a voltage pulse with an amplitude proportional to the deposited energy. The LD is a bolometer built with the same technique and optimized in order to be able to detect the small energy carried by the scintillation photons. The LD consists in a high purity Ge wafer, 36 mm diameter and 0.3 mm in thickness. On the side facing the scintillating crystal the surface of the wafer is ‘darkened’ with a deposition of a 600 Å layer of SiO2 to improve light absorption. An NTD Ge thermistor for the temperature signal read-out is glued on the other side of the LD, to which a 55Fe source for energy calibration is faced.
The BGO and the LD bolometers (namely the heat and light channels) are provided with two completely independent read-out chains. The voltage signal produced on the NTD thermistors are amplified and filtered by the front-end electronics and fed into the ADC. When the trigger fires, the entire signal waveform is sampled, digitized and saved to disk. Pulse height and pulse-shape parameters are computed by the off-line analysis for each acquired event. Signals deformed by excess noise or by pile-up are rejected by the analysis since they can produce a broadening or a deformation of the peaks, spoiling the energy resolution. The true rate is then reconstructed measuring the trigger efficiency and the probability that a pulse-shape cut rejects a true particle event. The former is measured on pulser generated events, the latter is obtained by comparing the event rate in a background peak before and after pulse-shape cuts (the ratio between the two rates is the pulse-shape cut efficiency).
II.2 Energy calibration
The energy content of the heat and light signals are evaluated using calibration data.
The light signal is calibrated using 55Fe X-rays, assuming a linear dependence of the pulse height on energy. This is an approximation since in general the relationship between energy and pulse height is not linear (the exponential dependence of the thermistor resistance on temperature being the main source of non-linearity). The calibration returns the energy content of the recorded scintillation signal. It should be noted that the energy is not corrected for the light collection efficiency, therefore it does not provide an absolute determination of the amount of scintillation light produced by the BGO crystal.
The heat signal is calibrated using the more intense lines visible in the BGO heat spectrum. They cover a range from 0.5 to 2.6 MeV and are produced by radioactive contamination of the crystal or of the cryogenic set-up. Above and below the calibration is obtained by extrapolation. It is important to remark that in calibrating the heat signal the nominal line energy is assumed for each full energy peak observed in the heat spectrum. This means that the calibration – for / events – returns the total amount of energy released by the interacting particle in the crystal (although this energy is only partially converted into heat). On the contrary for events it overestimates the true total energy, since the LY of particles (LYα) is different (lower) than for / (LYγ) (for a detailed discussion of this issue see cadmio ). To emphasize this fact, the heat axis units are indicated as keVβ/γ.
III RESULTS
The detector was operated in the cryogenic facility installed in Hall C of Laboratori Nazionali del Gran Sasso (L’Aquila, Italy). The BGO crystal cooled very slowly (while the cryostat – as usual – reached the base temperature in few days), a behavior that can be ascribed to some excess heat capacity that decouples at low temperatures.
We collected 374.6 hours of background measurement in semi-stable conditions: the crystal was at 30 mK, still cooling during the measurement period improving its signal height by 30%. Off-line corrections – using the technique described in Ref. impulsatore – were applied to account for the thermal drift observed during the measurement.
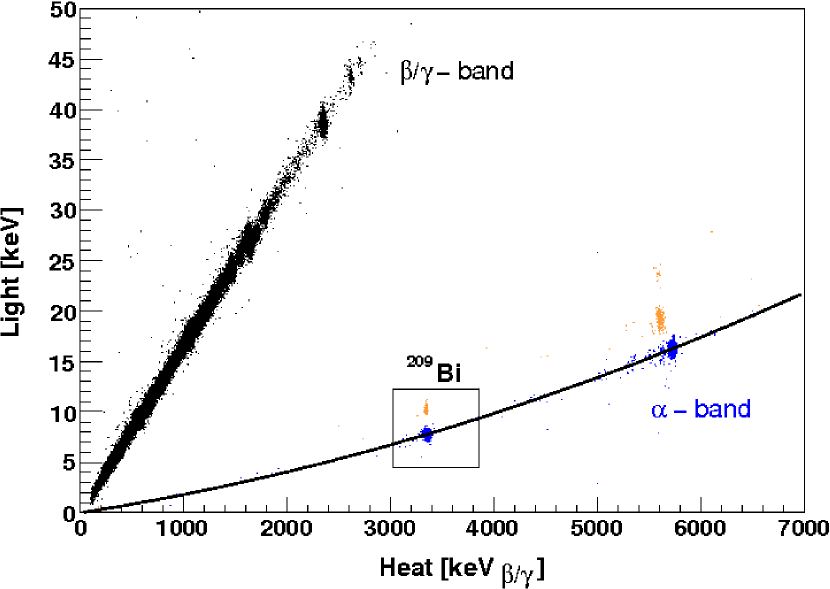
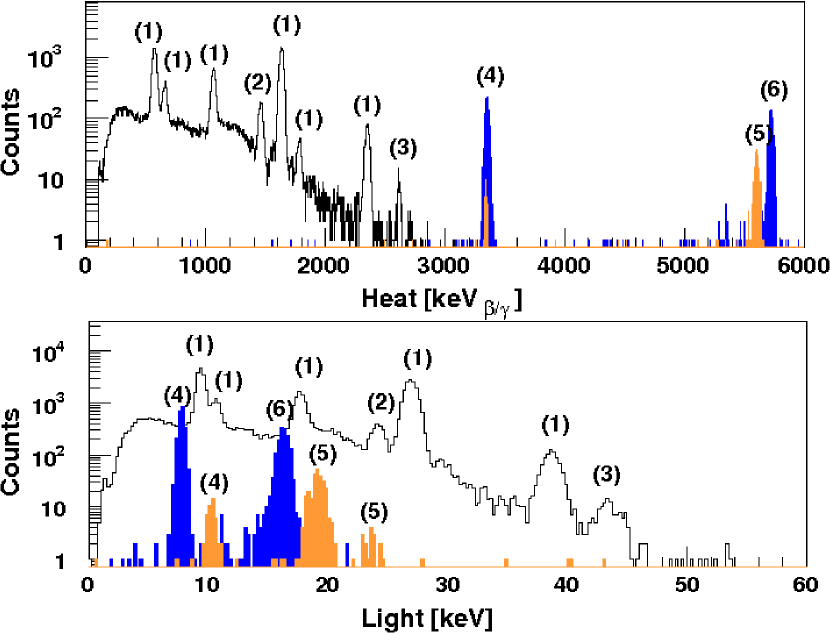
The light vs. heat scatter plot corresponding to this statistics is shown in Fig. 2. The and regions appear to be clearly separated, their light and heat spectra are reported in Fig. 3.
III.1 Gamma region
Several very intense lines are visible in the spectra (and were used – as discussed above – for the heat spectra energy calibration). They are due to the internal contamination of the crystal in 207Bi and the background 40K and 232Th lines (usually observed in all measurements and ascribed to detector+cryostat contamination). 207Bi is a common contaminant already observed in BGO crystals which is produced by cosmic ray protons interaction on 206Pb, Ref. 207Bi ; 207BiB . The average FWHM energy resolution on the heat channel – as measured on the more prominent lines – is (37.50.5) keV, with no evident dependence on energy.
The energy resolution of the LD, measured on the 55Fe line, is 0.5 keV. The FWHM of the scintillation peaks produced by the 207Bi, 40K and 232Th photons interacting in the BGO ranges from 0.8 keV to 1.5 keV. The LYγ has no evident dependence on energy, its average value is =(16.610.02) keV/MeV. The overbar here indicates that LYγ is not corrected for the light collection efficiency.
III.2 Alpha region
The structure of the region appears slightly more complicated than the / one. Here we can identify two different kind of events.
Pure -decays (no emission) are aligned along the same curve in the scatter plot (see Fig. 2). These events are produced by particles impinging on the crystal from an external source, or by -decays in crystal bulk. The former have generally a continuous energy distribution (see for example Ref. ArtRadio ) the latter are monochromatic with an energy corresponding to the Q-value of the decay (since both the energies of the emitted alpha and of the recoiling nucleus are detected). Two such lines are clearly evident in our scatter plot and are identified as due to 209BiTl decay (Q=3137.20.8 keV, Ref. nucldata ), and to 210PoPb decay (Q=5407 keV) which is present in the crystal, probably as a result of 209Bi activation (see Ref. 210Pb ). Since particles have a LY that is lower with respect to the / one, the two lines appear in the heat spectrum with energies higher than the nominal ones. We recall that this effect is simply due to the procedure adopted for the heat axis calibration. The LYα and the corresponding quenching factors (QF=LYα/LYγ) are:
The increase with energy of the is responsible of the curvature of the band, an effect already observed by Ref. nature ; coron . In Fig. 2 we show the result obtained fitting the band with a degree 2 polynomial.
We note that 209Bi and 210Po are internal contaminations of the crystal. In principle their LY could differ from that of a pure particle because a fraction of the total energy (about 2% ) is carried by the nuclear recoil (R). However, the difference in the LY of and +R events is far below our sensitivity. For this reason, here and in the following, we will assume and +R events as having the same LY.
-decays on the excited state of the daughter nucleus give rise to mixed + events. In this case, the light signal is higher than what expected for a pure emission, producing therefore events that lie in between the and the band. An example is the 210mBi decay, a contaminant responsible of the events appearing in the mixed + band, just at the left of the 210Po (pure-) line. 210mBi is produced in bismuth by thermal neutron interaction and it accumulates in the material due to its long half-life (see Ref. 210Pb ). The isotope -decays (Q=5036.4 keV) to different excited levels of the daughter isotope (206Tl) with the contemporary emission of one or more ray. The two spots (visible in Fig. 2) are ascribed to the decays to the two lowest levels (with a sum BR of 94.5% and energies of 265.6 or 304.9 keV) and to two higher ones (with a BR of 1.4% and 3.9% and energies of 634.5 keV and 649.6 keV). The probability of full containment of the emitted gammas is high, ranging from (84.20.4)% for the lowest energy to (54.50.3)% for the highest one (the efficiencies were evaluated with a GEANT-4 simulation in which the disexcitation cascades for the four considered levels were reproduced). The measured intensities agree with the tabulated branching ratios within one standard deviation.
III.3 209Bi decay
Similar to 210mBi is the case of our interest: 209Bi decay. It follows two different paths to the 205Tl ground state labeled I and II in Fig. 1. Process I produces an particle plus a recoil (Q=3137 keV); being a monochromatic pure -decay it should produce a line in the -band (the probability of fully contain both the particle and the recoiling nucleus inside the crystal, , is obviously 1). Process II produces an particle plus recoil (Q=2933 keV) and a prompt ray (Eγ=204 keV). In =(92.10.5)% of cases the photon is fully absorbed in the BGO crystal (toghether with the particle and the recoiling nucleus). In such cases we have a monochromatic + event that should produce a line in the mixed + band.
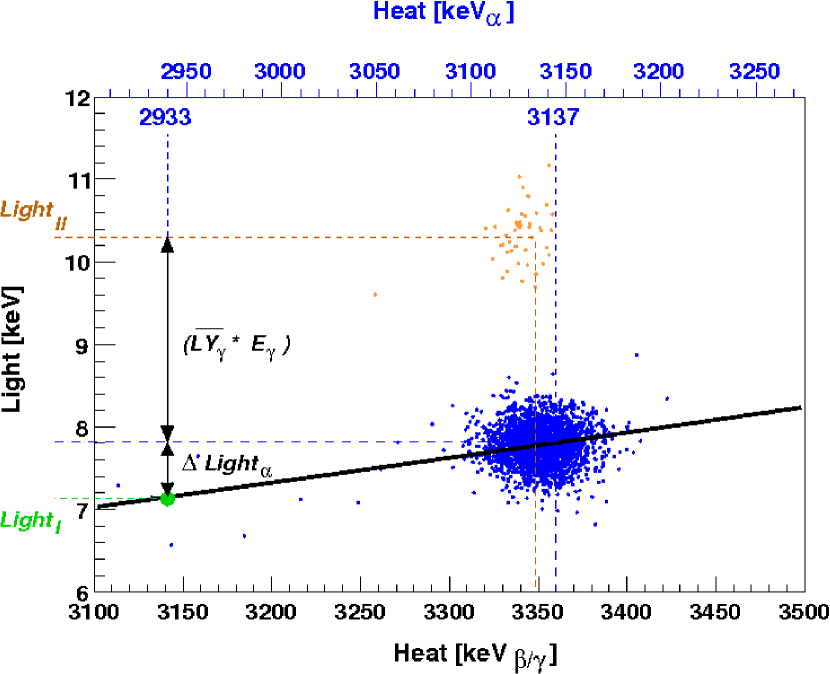
This is exactly what we observe in our data: two spots corresponding to roughly the same heat position (3350 keV on the / calibration scale), but a different light emission, are clearly visible (see Fig. 2). Zooming the scatter plot in the 209Bi region (Fig. 4) we can observe that not only the light position of the two spots is different, but also the heat one. Indeed, although the emitted particles carry the same total energy, in process II a larger fraction of it is spent in the production of scintillation light. The difference in the light position is:
where is the difference between the light signal of the 3137 keV +R of process I and that of the 2933 keV +R of process II. This relationship can be used to estimate the energy of the emitted photon, further proving that we are observing 209Bi decay.
Indeed, since the non-linearity of the heat axis is very small, we can linearly calibrate it in the proximity of the 209Bi peak (in Fig. 4 the heat axis calibrated in this way is drawn on the top). Using this calibration, we can obtain the heat position expected for an +R event of 2933 keV. This results (3133.80.3) keV (the position is indicated with a circle in Fig. 4). Then, using the fit of the pure band, we compute the value of . Finally, we obtain for Eγ a value of (1928) keV, validating our hypothesis.
The branching ratio for the two 209Bi decays are obtained fitting the light spectrum with the sum of two gaussians having the same width and intensities: [(1-BR)] for the intensity of the GS-ES transition and [BR] for the intensity of the GS-GS transition. The result is a BR of (98.80.3)% for the GS-GS transition. The total number of events corresponding to the decay is 219966, with a detection efficiency of (872)% (which accounts for both the trigger efficiency and the pulse-shape cuts efficiency) this yields a half-life for 209Bi nucleus of =(2.010.08)1019 years.
Finally the GS-GS transition partial width is =(2.040.08)1019 years in good agreement with the previously reported one, Ref. nature .
IV CONCLUSION
This work provides a compelling evidence of the observation of 209Bi decay through the contemporary observation of the ground state and excited state transitions. While confirming the half-life of the isotope already measured by Ref. nature , we were also able to add a new experimental information on 209Bi, namely the Branching Ratio between the ground state and the excited state transition. This study covers a seldom explored field, namely that of hindered -decays providing experimental inputs for a better development of the theoretical framework of nuclear models, Ref. teorico . In the mean time, these results proves once more the potentialities of the bolometric technique in the study of rare nuclear processes.
References
- (1) P. de Marcillac et al., Nature 422, 876 (2003)
- (2) See for example Saint Gobain data-sheets
- (3) C. Arnaboldi et al., Astro. Ph. 34, 143 (2010)
- (4) C. Arnaboldi et al., Astro. Ph. 34, 344 (2011)
- (5) E. E. Haller et al., “Neutron transmutation doping of semiconductor materials,” (Plenum Press, New York, 1984) p. 21
- (6) F. G. Kondev, Nuclear Data Sheets 101, 521 (2004)
- (7) A. Alessandrello et al., Nucl. Instr. Meth. A 412, 451 (1998)
- (8) T. A. Lewis, Nucl. Instr. and Meth. A 264, 534 (1988)
- (9) A. Y. Balysh et al., Instr. Exp. Tech. 1, 118 (1993)
- (10) C. Bucci et al., Eur. Phys. J. A 41, 155 (2009)
- (11) A. Letourneau et al., Ann. Nucl. En. 33, 377 (2006)
- (12) N. Coron et al., Opt. Mat. 31, 1393 (2009)
- (13) C. Xu and Z. Ren, Phys. Rev. C 68, 034319 (2003)