Multijet Measurements with the DØ Detector
Abstract
In this note we present several recent results for the production of multijet final states in collisions at a center of mass energy of 1.96 TeV. These measurements, which include the cross-section for dijet and three-jet production and the ratio of three-jet to two-jet cross sections, were taken with the DØ experiment at the Fermilab Tevatron collider.
I Introduction
In hadron-hadron collisions, production rates of collimated sprays of hadrons, called jets, are sensitive to both the dynamics of the fundamental interaction and to the partonic structure of the initial-state hadrons. The latter is usually parameterized in parton distribution functions (PDFs) of the hadrons. Thus measurements of jet production properties can be used to test the predictions of quantum chromodynamics (QCD) as well as to constrain the PDFs. Because jet production has the largest cross-section of any high process at a hadron collider, the study of jet production provides the highest energy reach for the experiment and a unique sensitivity to new physics.
Several jet measurements are now well established at the Tevatron, including the measurement of the inclusive jet cross section and of the angular and invariant mass dependencies of dijet events 2008hua ; 2009mh ; 2010dijm . These measurements provide important tests of perturbative QCD (pQCD) and are input to PDF calculations. Measurements of multi-jet production take advantage of the fact that these processes have the same PDF sensitivity as dijet production, but are sensitive to processes to third order in the strong coupling constant . Fundamental to the understanding of order processes is the three-jet cross-section, which we present as a function of the invariant mass of the three-jet system. Studies dedicated to the dynamics of the interaction are preferably based on observables which are insensitive to the PDFs. Such observables can be constructed as ratios of cross sections for which the PDF sensitivity cancels. In this note we report a measurement of , the ratio of the inclusive three-jet to the inclusive 2-jet cross-sections.
In this note we present several recent results for the production of multijet final states in collisions at a center of mass energy of 1.96 TeV. These measurements, which include the cross-section for dijet and three-jet production and the ratio of three-jet to two-jet cross sections, where taken with the DØ experiment d0det at the Fermilab Tevatron collider. The data analyzed were recorded using a single jet triggers at a variety of thresholds, corresponding to an integrated luminosity of 0.7 fb. The event selection, jet reconstruction, jet energy and momentum correction in this measurement follow closely those used in our recent measurements of inclusive jet and dijet distributions 2008hua ; 2009mh ; 2010dijm . The primary tool for jet detection is the finely segmented uranium-liquid argon calorimeter that has almost complete solid angle coverage d0det . Jets are defined by the Run II midpoint cone jet algorithm run2cone with a cone radius (for most jet studies) of in rapidity and azimuthal angle . Rapidity is related to the polar scattering angle with respect to the beam axis by with . The jets in an event are ordered in descending transverse momentum with respect to the beam axis.
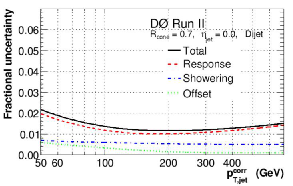
For all jet studies, a jet energy scale (JES) correction is applied to jet four momentum as the measured four momentum of a jet is not the same as that of a jet entering the calorimeter due to the response of the calorimeter; energy showering in and out of the cone; and additional energy from detector noise, event pile-up and multiple interactions. The JES correction is determined using the imbalance in jet and dijet events. The additional energy from pile-up and multiple interaction is determined from a minimum bias sample. The JES corrections are of the order of 50% for a jet energy of 50 GeV and 20% for a jet energy of 400 GeV. However, for the 0.7 pb data sample used for the measurements presented in this talk, collected with the DØ detector during 2004–2005 in Run II of the Fermilab Tevatron Collider, the uncertainty on the JES is very small, less than 2% over jet ’s from 60 to 300 GeV.
II Dijet Cross-sections
Of the variables that fully specify the kinematics of dijet production in hadron collisions, the dijet invariant mass and rapidity difference (or equivalently ) probe the features of LO processes, while measurements of the azimuthal opening angle and ratio of transverse momenta can be used to determine the effect of higher-order processes. The dijet invariant mass cross section is particularly sensitive to the gluon contribution to PDFs at high . In addition, the dijet mass spectrum can be used to search for evidence of quark compositeness or new strongly produced resonances.
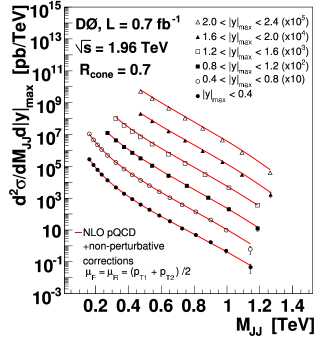
DØ has measured the dijet cross section as a function of the dijet invariant mass 2010dijm . This cross section is measured in six regions of , the rapidity of the leading jet in the event.
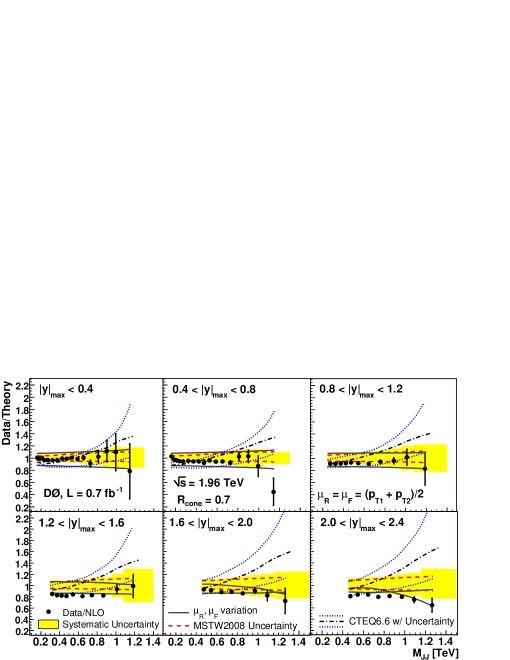
Figure 2 shows the resulting measurements, while figure 2 shows the measured cross section divided by the NLO prediction from the NLOJET++ nlojet program and using the MSTW2008NLO PDFs MSTW2008 . This measurement in an important extension of pQCD to the forward region, and includes measurements of dijet invariant masses up to 1.2 TeV.
III Three Jet Cross-section
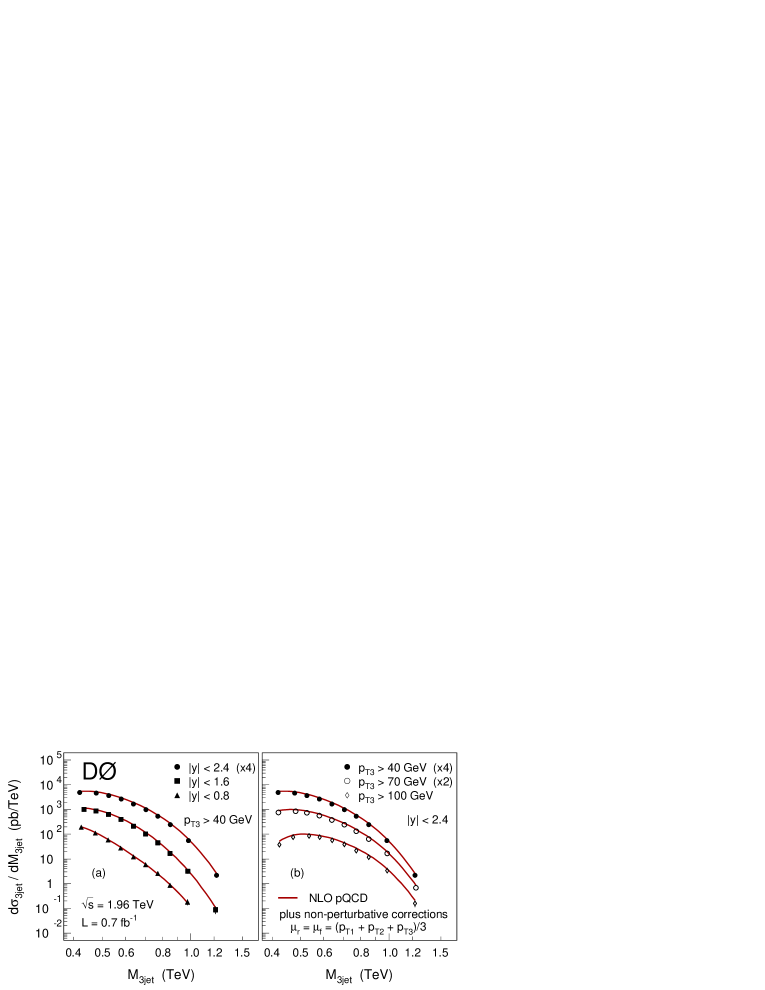
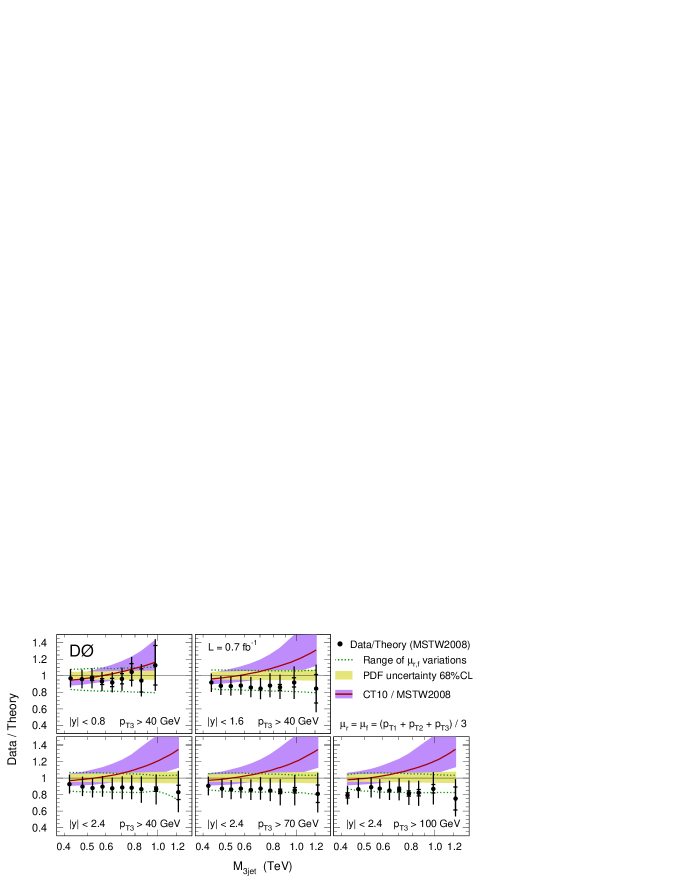
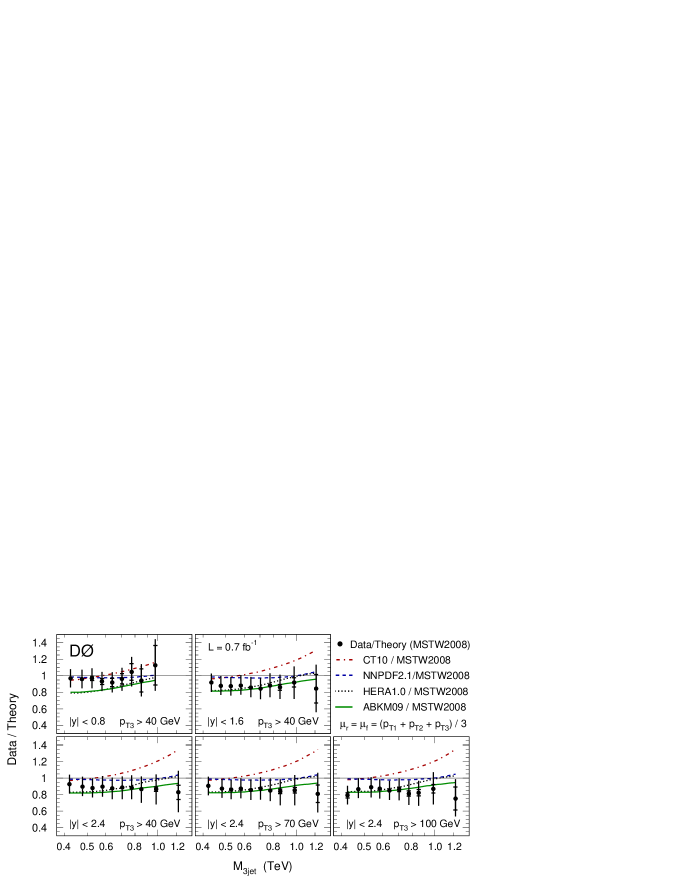
DØ has measured 2011trijm the differential inclusive three-jet cross section as a function of the invariant three-jet mass for three hard, well separated jets in three regions of jet rapidities (, , for all three jets) and in three regions of the third jet transverse momentum ( GeV, GeV and GeV) with leading jet GeV. The three-jet mass spectra are shown in Fig. LABEL:fig:M3jvsY. This represents the first fully corrected 3-jet mass distribution to be published, and the first comparison of such a cross-section to NLO pQCD calcuations.
The data are compared to the perturbative QCD NLO predictions calculated in NLOJET++nlojet program with MSTW2008NLOMSTW2008 PDFs. The NLO prediction is corrected for hadronization and underlying event effects, with correction varied in the range from -3% to 6%, obtained from PYTHIApythia simulations using tune QWtuneQW . The comparison of data to theory is shown in Fig. 5 and 6.
IV Ratio of Three-jet to Dijet Cross-section,
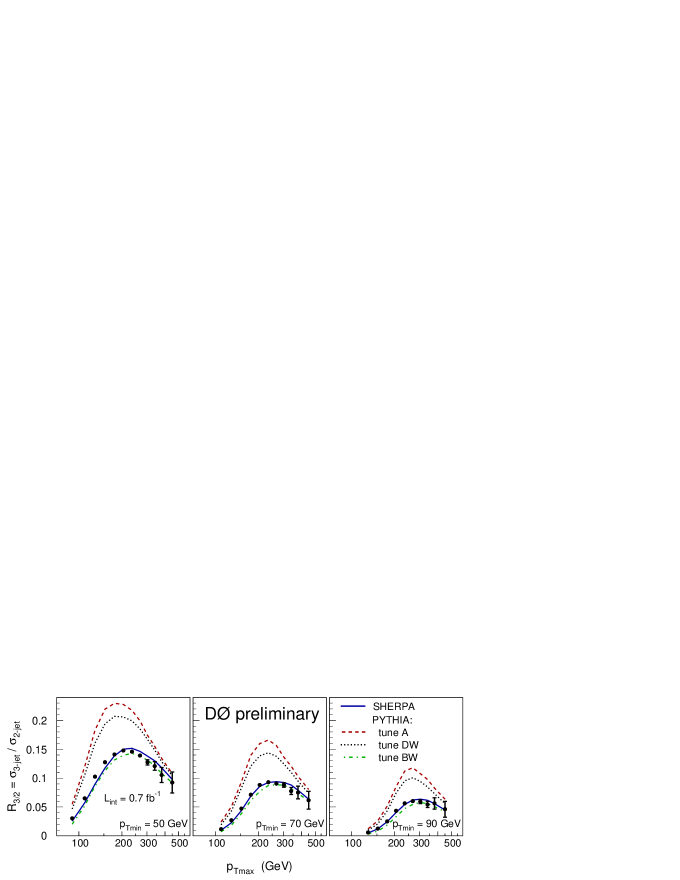
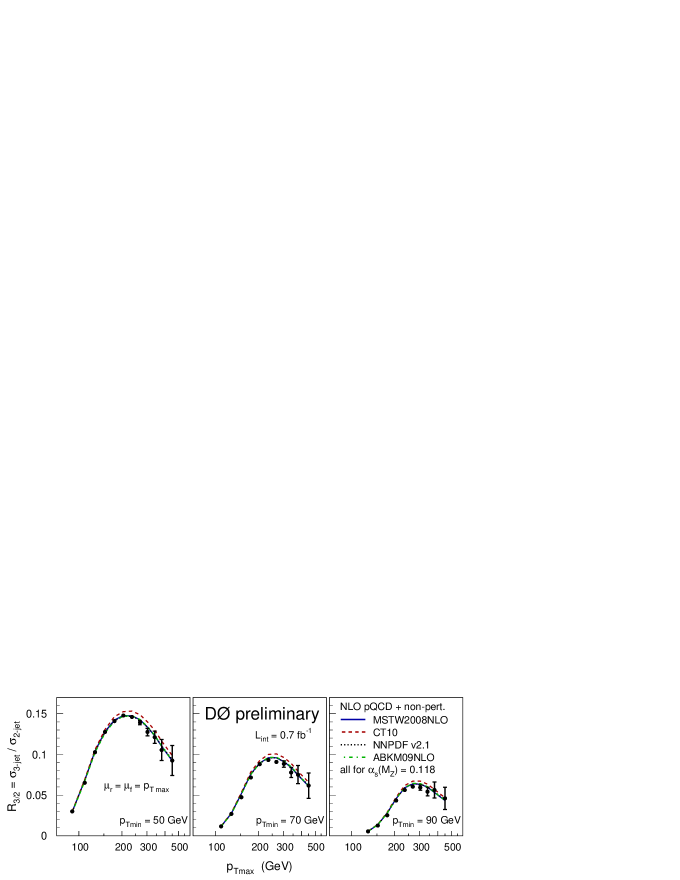
The ratio of inclusive jet cross sections, , is less sensitive to experimental and theoretical uncertainties than the individual cross sections, due to cancelations of correlated uncertainties. Here is measured as a function of the leading jet in an event, , in the interval , for requirements of 50, 70, and 90 GeV.
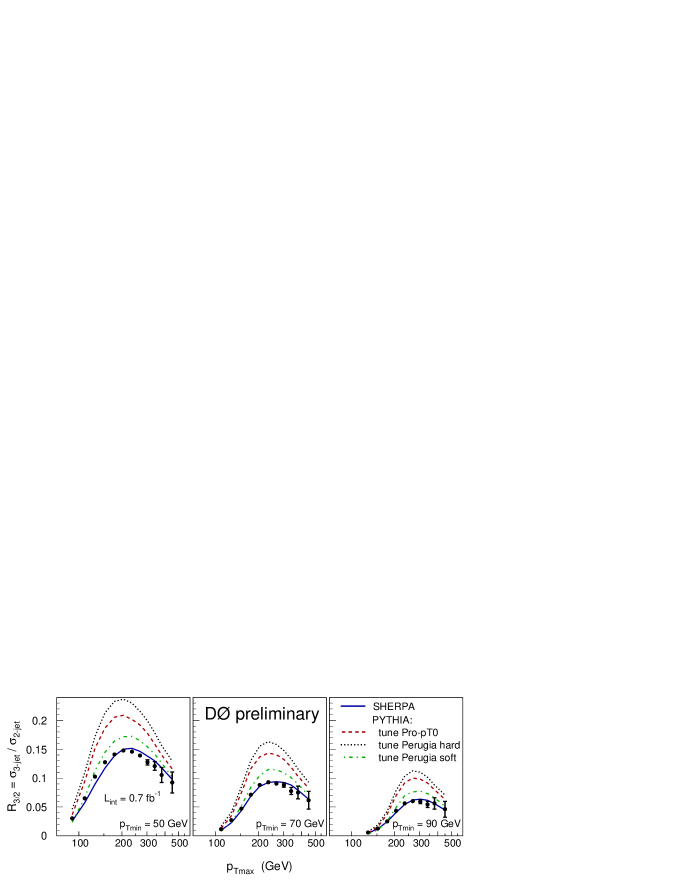
The results are displayed in Fig. 7, where the inner error bars represent the statistical uncertainties while the total error bars represent the quadratic sums of statistical and systematic uncertainties. The data are compared to the predictions from different Monte Carlo event generators. The sherpa v1.1.3 predictions Gleisberg:2008ta , which include the tree-level matrix elements for 2-, 3-, and 4-jet production, are shown as solid lines in Figs. 7. These were obtained using default settings and MSTW2008LO PDFs and by matching the leading order matrix elements for 2-, 3-, and 4-jet production with a parton shower.
In addition, the data are compared to predictions from the PYTHIA event generator (version 6.422). The matrix elements implemented in PYTHIA are only those for 2-jet production. All additional jet emissions are produced by a parton shower. There are two different implementations, a virtuality-ordered parton shower and a -ordered one. Both are highly tunable and more than 50 tunes are provided in PYTHIA v6.422. All tunes studies here use the CTEQ5L PDFs Lai:1999wy .
In Fig. 7 the data are compared to PYTHIA tunes which use the -ordered parton shower Sjostrand:2004ef ; Buttar:2006zd . These are tune “Professor pT0” Buckley:2009vk and two extreme tunes from the “Perugia” series of tunes Skands:2009zm , the tunes “Perugia hard” and “Perugia soft”. All of these tunes give very different results for but all predict significantly higher ratios than what is seen in the data, even for the softest tune from the Perugia series.
The data are compared to the perturbative QCD NLO predictions calculated in NLOJET++nlojet program with MSTW2008NLOMSTW2008 PDFs. The NLO prediction is corrected for hadronization and underlying event effects, with correction varied in the range from -3% to 6%, obtained from PYTHIApythia simulations using tune QWtuneQW . The comparison of data to theory is shown in Fig. 8.
V Summary
The DØ experiment at the Fermilab Tevatron collider has been enormously successful, and continues to produce important physics measurements, including tests of the Standard Model and searches for new phenomena. Only a small portion of the QCD-related analyzes we have pursued could be shown in this talk. The reader is urged to check http://www-d0.fnal.gov/results/index.html for the latest results.
Acknowledgements.
My thanks to my collaborators on the DØ experiment, particularly the current and past QCD physics group coordinators Mike Strauss, Sabine Lammers, Dmitry Bandurin and Markus Wobisch. All credit for these results goes to this remarkable collaboration, while any errors in the reporting of these results are the author’s own.References
- (1) V. M. Abazov et al. (D0 Collaboration), Nucl. Instrum. Methods Phys. Res. A 565, 463 (2006).
- (2) G. C. Blazey et al., in Proceedings of the Workshop: QCD and Weak Boson Physics in Run II, edited by U. Baur, R.K. Ellis, and D. Zeppenfeld, (Batavia, Illinois, 2000) p. 47, see Section 3.5.
- (3) V. M. Abazov et al. (D0 Collaboration), Phys. Rev. Lett. 101, 062001 (2008).
- (4) V. M. Abazov et al. (D0 Collaboration), Phys. Rev. D 80, 111107 (2009).
- (5) V. M. Abazov et al. (D0 Collaboration), Phys. Rev. Lett. 103, 191803 (2009).
- (6) V. M. Abazov et al. (D0 Collaboration), Phys. Rev. Lett. 94, 221801 (2005).
- (7) V. M. Abazov et al. (D0 Collaboration), Phys. Lett. B 693 209 (2010). arXiv:1002.4594[hep-ex].
- (8) Z. Nagy, Phys. Rev. D 68, 094002 (2003); Z. Nagy, Phys. Rev. Lett. 88, 122003 (2002).
- (9) A. D. Martin, W. J. Stirling, R. S. Thorne and G. Watt, Eur. Phys. J. C 63, 189 (2009).
- (10) V. M. Abazov et al. (D0 Collaboration), arXiv:1104.1986, submitted to Phys. Lett. B (2011).
- (11) T. Sjöstrand et al., Comput. Phys. Commun. 135, 238 (2001).
- (12) M. G. Albrow et al. (TeV4LHC QCD Working Group), arXiv:hep-ph/0610012.
- (13) T. Gleisberg, S. Hoche, F. Krauss, M. Schonherr, S. Schumann, F. Siegert and J. Winter, JHEP 0902, 007 (2009).
- (14) H. L. Lai et al. (CTEQ Collaboration), Eur. Phys. J. C 12, 375 (2000).
- (15) T. Sjostrand and P. Z. Skands, Eur. Phys. J. C 39, 129 (2005).
- (16) C. Buttar et al., arXiv:hep-ph/0604120.
- (17) A. Buckley, H. Hoeth, H. Lacker, H. Schulz and E. von Seggern, arXiv:0906.0075[hep-ph].
- (18) P. Z. Skands, arXiv:0905.3418[hep-ph].