The CosmoALEPH Collaboration
Spectrum and Charge Ratio of Vertical Cosmic Ray Muons
up to Momenta of 2.5 TeV/
Abstract
Dedicated to the memory of Horst Wachsmuth
The ALEPH detector at LEP has been used to measure the momentum spectrum and charge ratio of vertical cosmic ray muons underground. The sea-level cosmic ray muon spectrum for momenta up to TeV/ has been obtained by correcting for the overburden of 320 meter water equivalent (mwe). The results are compared with Monte Carlo models for air shower development in the atmosphere. From the analysis of the spectrum the total flux and the spectral index of the cosmic ray primaries is inferred. The charge ratio suggests a dominantly light composition of cosmic ray primaries with energies up to eV.
The sea level cosmic ray muon spectrum resulting from the interaction of primary cosmic rays with the atmosphere probes multi-particle production in hadronic interactions up to and beyond LHC energies. In addition, the muon charge ratio is sensitive to the fraction of heavy nuclei in the primary cosmic ray beam.
In the past many measurements were based on simple detection devices at the earth’s surface, see e.g. Hebbeker and references therein. Additional information can be obtained from the highly sophisticated detectors used in particle physics L3 ; CMS ; Opera ; Minos . The fact that those detectors are placed under ground offers the additional advantage of a natural muon filter and a momentum cutoff which emphasizes the high energy part of the spectrum. Here we present a measurement of the vertical muon spectrum and charge ratio performed with the ALEPH detector at LEP, which was located at a depth of 320 mwe.
The ALEPH detector is described in detail in Aleph . The study presented here uses mainly the large time projection chamber (TPC), the main tracking device of the ALEPH detector. The data were taken in 1999 during one week of dedicated running with a cosmic trigger using information from the hadron calorimeter (HCAL). Background from interactions in the iron of the HCAL and electromagnetic calorimeter (ECAL) can be reliably identified, have been shown to be well described by the detector simulation Maciuc and are taken into account in the Monte Carlo corrections.
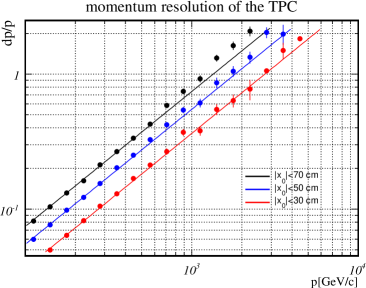
The coordinate system used in the analysis is the standard ALEPH coordinate system. It is a right-handed system with the -direction pointing towards the center of LEP, the -direction being vertically upwards and along the beam-direction. The center of the detector is at . Muon tracks are selected by the requirement of having at least TPC hits out of a maximum of , a reconstructed momentum GeV/ and a polar angle with respect to the vertical . The cut on the number of TPC hits guarantees precise momentum reconstruction, the minimum momentum cut ensures that the muon has enough energy to pass through the entire barrel of the calorimeter and thus full trigger efficiency. Both cuts reject low energy background from secondary interactions. The quality of the reconstruction is demonstrated by the fact that such details of the geometrical structure as the access shaft of the ALEPH pit and the flux shadowing by the Jura mountains are visible in the arrival directions of the incident muons. For the final analysis additional fiducial cuts were applied. Azimuthal angles (measured around the vertical) of with respect to the direction of the underground access shaft were cut out to mask the enhanced muon flux from this direction. In addition, the muon tracks were required to pass through the central plane in the range cm, cm and cm. These cuts make sure that the selected tracks are fully contained in one half of the TPC and pass through the full diameter of the chamber, optimizing momentum resolution and minimizing systematic effects due to boundary effects and the inversion of the drift field at the HV-membrane at . The momentum resolution of the TPC is shown in Fig. 1 as a function of for three values of the fiducial cut on . One clearly sees how the performance improves towards the central region. The nominal cut value cm is chosen as a compromise between good resolution and still high statistics. Here the maximum measurable momentum is around TeV/. Extrapolated to the surface, the accessible momentum range is up to 2.5 TeV/.
The raw distributions for spectrum and charge ratio were corrected using momentum dependent correction factors obtained from a full simulation of single muons passing through the ALEPH detector from above. For this simulation, at a depth of 320 mwe, an energy spectrum proportional to was assumed, with . The correction factors, parameterized by 4th order polynomials as a function of , include effects due to electromagnetic interactions of muons in the detector material, multiple scattering in the calorimeters and finite momentum resolution of the TPC. For momenta from to GeV/ the correction factors for the spectrum vary from values around to . Towards higher momenta they decrease slowly, falling below unity around TeV/. For the charge ratio no trend is observed. With average corrections below %, the analysis of the charge ratio was performed without explicit detector corrections. In the end a global % systematic error, correlated between all bins, was assigned. The nominal results for the muon momentum spectrum and charge ratio at the surface were then determined by propagating the measured momenta to the surface, using a parameterization of the form with energy dependent coefficients and Nadir . The continuous energy loss is approximated by performing the propagation in five discrete steps, which has been checked to be within of the continuous treatment. An overburden of mwe for deg (towards lake Geneva) and mwe for deg (towards Jura mountains) was assumed, which takes into account the surface topography close to the ALEPH experiment. After propagation to the surface the spectrum measured up to zenith angles of 20 degrees was corrected to the purely vertical spectrum by a momentum dependent factor using the parameterization of the muon flux in reference Bogdanova . The correction is in the range –. The absolute flux finally is obtained from
| (1) |
Here is the number of muons measured after all corrections in the momentum interval , is the fiducial area in the TPC and the solid angle accepted for the measurement. The uptime is estimated from an independent measurement ANA01 of the CosmoALEPH HCAL trigger rate and the number of muons per unit area observed during the data taking as s where the error is dominated by systematics estimated from spatial inhomogeneities of the observed muon flux through the central plane of the TPC. Details of the analysis are described in references Nadir ; ANA02 . The total normalization uncertainty is 9.1%.
For the determination of the systematic uncertainties of the results the analysis was repeated times, randomly varying global settings of the analysis and fluctuating the individual measurements within their uncertainties. With the result from the nominal analysis, a covariance matrix describing the systematic uncertainties and correlations between all bins was constructed from those pseudo-experiments by
| (2) |
Individual tracks were subjected to smearing of according to the estimated error from the track fit, plus direction and position smearing due to multiple scattering in the overburden and the finite resolution of the TPC as parameterized from Monte Carlo simulations. Global variations between different pseudo-experiments which have been considered are the spectral index in the calculation of the detector corrections, , the use of an additional quality cut in the track selection, omitting the zenith angle correction, or, in order to probe the sensitivity to the simple energy loss model, doing the propagation through the overburden in a single step. Continuous global parameters entering the analysis have been randomly varied between pseudo-experiments by assuming a uniform distribution within their assumed uncertainties. The overburden was varied by mwe on the lake side and mwe on the Jura side, where the difference accounts for uncertainties in the exact effects of the surface topology. Momentum dependent biases on position, direction and momentum measurements in the TPC are assumed to be taken into account by the Monte Carlo simulation. Nevertheless, in order to probe the sensitivity to biases seen in the simulation, these were parameterized and added with a scale factor randomly chosen from a uniform distribution in the range , i.e. covering the range between zero and twice the estimated bias. In the same way also the impact of the uncertainty of the global momentum scale GeV/ Wiedenmann was studied.
| [GeV/] | spectrum [(GeV/ s cm2 sr) | charge ratio |
|---|---|---|
| 112 | ||
| 141 | ||
| 178 | ||
| 224 | ||
| 282 | ||
| 355 | ||
| 447 | ||
| 562 | ||
| 708 | ||
| 891 | ||
| 1122 | ||
| 1413 | ||
| 1778 | ||
| 2239 |
The CosmoALEPH results for the vertical muon spectrum and the charge ratio are listed in table 1 and displayed together with predictions from different interactions models in Fig. 2. The spectrum agrees with the global parameterization given in reference Hebbeker . Taking the full covariance matrix of the result into account, one finds a -confidence level . At large momenta the CosmoALEPH measurements are also in good agreement with the results by the MARS collaboration MARS , which was historically the first to measure momenta beyond TeV/.
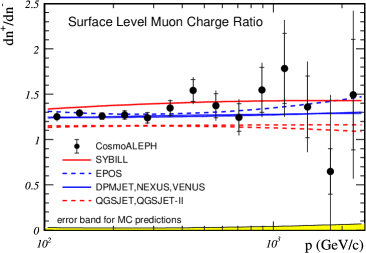
Within errors the measurements of the charge ratio are consistent with being independent of the momentum, but also with an increase at large energies as observed e.g. in CMS ; Opera ; Minos . Fitting a constant value gives a -confidence level and the charge ratio , which is in good agreement with the result from Hebbeker based on momenta up to GeV/. The CosmoALEPH measurement reaches up to TeV/, albeit with large uncertainties for momenta above TeV/.
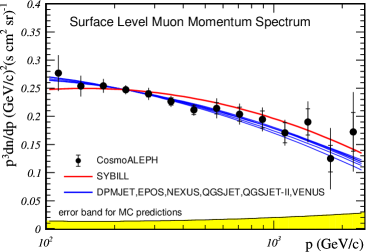
The CosmoALEPH measurements were compared with Monte Carlo simulations using the models DPMJETDPMJET , VENUSVENUS , NEXUSNEXUS , EPOSEPOS , QGSJETQGSJET , QGSJETIIQGSJETII and SYBILLSYBILL from the CORSIKA program suite, version 6.375 CORSIKA . Studies of different parameterizations of the primary spectrum Forti showed that the data are reasonably well described by the Constant Mass Composition model (CMC), both in shape and absolute normalization. The momentum range covered by the CosmoALEPH data is found to be insensitive to the existence of the knee in the primary spectrum. The observed charge ratio depends mainly on the average charge per nucleon of the primary particle initiating a shower, i.e. it is sensitive to the fraction of heavy particles in the primary spectrum, but does not provide information about the chemical composition of those nuclei. The momentum spectrum of cosmic ray muons is sensitive to the total flux and the spectral index of the primary spectrum.
To determine the fraction of heavy nuclei , total flux and spectral index , Monte Carlo predictions using simple power laws
| (3) |
for the heavy particles and protons were fitted to the data. For heavy nuclei the cocktail of the CMC-model with about He-, N-, Mg- and Fe-nuclei was assumed. Technically, in the fit the existing simulations were reweighted to conform to eq. 3. The parameters and were scanned in the range and . At each point the normalization of the spectrum was adjusted such that the model reproduces the best measured point of the momentum spectrum. Then the total for the remaining 27 degrees of freedom from spectrum and charge ratio was calculated. The two distributions were assumed to be independent, but the full correlation matrix within each was properly taken into account. The best fit results are shown in Fig. 2.
One finds that all models except SYBILL achieve a good description of the shape of the muon spectrum. Good global fits are obtained with the DPMJET, EPOS, NEXUS and VENUS models. The others fail to reproduce the observed charge ratio. The four models with a good global fit favor a predominantly light composition of cosmic primaries. For a quantitative conclusion the results from those models were combined such that for every point in the plane the smallest of the four -confidence levels was taken as the combined one. This procedure yields regions in the parameter plane, where all models under consideration are consistent with the data with at least the specified confidence level. The result is shown in Fig. 3. Taking the region with common confidence level finally yields and .
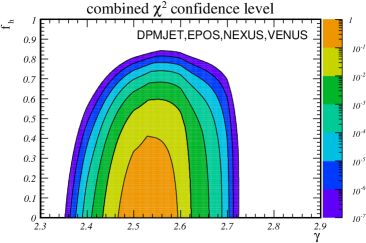
The flux normalization obtained from the fit is strongly correlated to and . Expressed through the total flux of cosmic ray primaries with energies above GeV and considering only the region with common confidence level , one finds m-2s-1sr-1. The central value is the average of the results from the models with a good fit to the data, the first error the RMS spread of those results and the second one the normalization uncertainty of the CosmoALEPH measurement. The statistical errors of the result are negligible.
In summary, we have presented a precision measurement of the spectrum and charge ratio of vertical cosmic ray muons at the surface in the momentum range from 100 GeV/ to 2.5 TeV/. The charge ratio is sensitive to the fraction of heavy primaries. Based on simulations with different interaction models, the fraction of heavy nuclei is inferred to be . The preferred spectral index for the primary spectrum up to energies of eV is found to be in the range from , and the flux of cosmic ray primaries with energy above GeV is determined as m-2s-1sr-1.
The authors gratefully acknowledge the help of the ALEPH collaboration, in particular Markus Frank and Beat Jost, as well as Alois Putzer, Bertram Rensch, and Thomas Ziegler in doing the measurements. The analysis of the CosmoALEPH experiment has been supported by the Deutsche Forschungsgemeinschaft under grant DFG/Gr/1796/1-3.
References
- (1) T. Hebbeker and C. Timmermans, Astropart. Phys. 18, 107 (2002).
- (2) L3-Collaboration, P. Achard et al., Phys. Lett. B 598, 15 (2004).
- (3) CMS-Collaboration, Phys. Lett. B 692, 82 (2010).
- (4) OPERA-Collaboration, N. Agafonova et al., Eur. Phys. J. C 67, 25 (2010).
- (5) MINOS-Collaboration, P. Adamson et al., Phys. Rev. D 83, 032011 (2011).
- (6) ALEPH-Collaboration, D. Decamp et al., Nucl. Instr. Meth. A 294, 121 (1990); D. Busculic et al., Nucl. Instr. Meth. A 360, 481 (1995).
- (7) F. Maciuc et al., Phys. Rev. Lett. 96, 021801 (2006).
- (8) N.O. Hashim, PhD-Thesis, Universität Siegen, 2007.
- (9) L.N. Bogdanova et al., Physics of Atomic Nuclei 69, 1293 (2006).
-
(10)
http://www.mpi-hd.mpg.de/personalhomes/michaelt/
public/CosmoALEPH/ANA-01.pdf -
(11)
http://www.mpi-hd.mpg.de/personalhomes/michaelt/
public/CosmoALEPH/ANA-02.pdf -
(12)
http://www-wisconsin.cern.ch/~wiedenma/TPC/
Distortions/Cern_LC.pdf - (13) MARS Collaboration, J.M. Baxendale et al., ICRC (Munich, 1975) 6, 2011 (1975).
- (14) J. Ranft, Phys. Rev. D 51, 64 (1995); hep-ph/9911213; hep-ph/9911232.
- (15) K. Werner, Phys. Rep. 232, 87 (1993).
- (16) H.J. Drescher et al., Phys. Rep. 350, 93 (2001).
- (17) K. Werner et al., Phys. Rev. C 74, 044902 (2006).
- (18) N.N. Kalmykov et al., Nucl. Phys. B (Proc. Suppl.) 52B 17 (1997), and references therein.
- (19) S.S. Ostapchenko, Nucl. Phys. B (Proc. Suppl.) 151, 143 (2006); Phys. Rev. D 74 014026 (2006).
- (20) R.S. Fletcher et al., Phys. Rev. D 50, 5710 (1994); R. Engel et al., Phys. Rev. D 46, 5013 (1992).
-
(21)
D. Heck et al., Report FZKA 6019 (1998), For-
schungszentrum Karlsruhe; http://www-ik.fzk.de/
corsika/physics_description/corsika_phys.html. - (22) C. Forti et al., Phys. Rev. D 42, 3668 (1990).