11email: nadia@astro.physik.uni-potsdam.de
High-resolution observations of two O vi absorbers at towards PKS 1448232
To explore the ionization conditions in highly-ionized absorbers at high redshift we have studied in detail two intervening O vi absorbers at towards the quasar PKS 1448232, based on high () and intermediate () resolution optical VLT/UVES spectra. We find that both absorption systems are composed of several narrow subcomponents with C iv/O vi Doppler-parameters km s-1, typically. This implies that the gas temperatures are K and that the absorbers are photoionized by the UV background. The system at represents a simple, isolated O vi absorber that has only two absorption components and that is relatively metal-rich ( solar). Ioinization modeling implies that the system is photoionized with O vi, C iv, and H i coexisting in the same gas phase. The second system at represents a complicated, multi-component absorption system with eight O vi components spanning almost km s-1 in radial velocity. The photoionization modeling implies that the metallicity is non-uniform and relatively low ( solar) and that the O vi absorption must arise in a gas phase different from that traced by C iv, C iii, and H i. Our detailed study of the two O vi systems towards PKS 1448232 shows that multi-phase, multi-component high-ion absorbers like the one at require a detailed ionization modeling of the various subcomponents to obtain reliable results on the physical conditions and metal-abundances in the gas.
Key Words.:
galaxies: intergalactic medium – galaxies: quasars: absorption lines – cosmology: observations1 Introduction
Highly ionized species like O vi and C iv, observed in the spectra of distant quasars, are excellent tracers of metal-enriched ionized gas in the filamentary intergalactic medium (IGM) and in the circumgalactic environment of galaxies. Therefore, the analysis of intervening O vi and C iv absorbers towards low- and high-redshift QSOs is crucial for a better understanding of the physical nature, distribution, evolution, and baryon and metal content of the IGM in the context of galaxy evolution. Because of the high cosmic abundance of oxygen, the large oscillator strength of the O vi doublet (located in far-ultraviolet at Å), and the high ionization energies of the ionization states O+4 (113.9 eV) and O+5 (138.1 eV), the O vi ion is a particularly powerful tracer of the metal-enriched IGM and the gaseous environment of galaxies. Using QSO absorption spectroscopy, O vi absorption now is commonly detected in various different galactic and intergalactic environments in the redshift range .
In the local Universe, O vi absorption in interstellar and intergalactic gas can be observed in the FUV spectra of stars and extragalactic background sources. For instance, O vi absorption is known to arise in the thick disk of the Milky Way (e.g. Savage et al. 2003), in the extended, multi-phase gas halos of the Milky Way and other galaxies (e.g. Sembach et al. 2003; Wakker & Savage 2009; Prochaska et al. 2011), and in intervening O vi absorption-line systems that trace metal-enriched gas in the IGM (e.g., Tripp et al. 2000; Savage et al. 2002; Richter et al. 2004; Sembach et al. 2004; Tripp et al. 2008; Thom & Chen 2008a, b; Danforth & Shull 2008), for a review see Richter et al. (2008). Over the last decade, intervening O vi absorbers at low redshift were considered as major baryon reservoir in the IGM, possibly tracing shock-heated and collisionally ionized intergalactic gas that results from large-scale structure formation (Cen & Ostriker 1999; Davé et al. 2001). This so-called warm-hot intergalactic medium (WHIM) has gas temperatures in the range K and is believed to host of the baryons at (Cen & Ostriker 1999). Recent observational and theoretical studies indicate, however, that part of the O vi absorbers at low may trace low-density, photoionized gas or conductive, turbulent, or shocked boundary layers between cold/warm ( K) gas clouds and an ambient hot ( K) plasma rather than the shock-heated WHIM (Fox 2011, see discussion in). Thus, a simple estimate of the ionization state of the gas in the absorbers from the observed O vi/H i ratios may lead to erroneous results because of the complex multi-phase character of the gas (Tepper-García et al. 2011).
For redshifts O vi absorption is detectable from the ground, where it can be observed in optical QSO absorption spectra at relatively high signal-to-noise (S/N). One very problematic aspect for the analysis of O vi absorbers at high redshift is the often severe blending of the O vi absorption with the Ly forest. As for low redshifts, the origin and nature of O vi absorbers at high is expected to be manifold. It has been shown by simulations (e.g. Theuns et al. 2002; Oppenheimer & Davé 2008) that shock-heating by collapsing large-scale structures is not efficient at high redshift to provide a widespread warm-hot intergalactic phase in the early Universe. Instead, galactic winds probably contribute substantially to the population of photoionized and collisionally ionized O vi absorbers at high redshifts, enriching the surrounding circumgalactic and intergalactic gas with heavy elements at relatively high gas temperatures (Fangano et al. 2007; Kawata & Rauch 2007). In fact, many of the strong O vi absorbers at high exhibit complex absorption patterns that would be expected for a circumgalactic multi-phase gas environment (e.g. Bergeron & Herbert-Fort 2005). Similar as for circumgalactic absorbers in the local Universe, a considerable fraction of the O vi absorbers at high thus may arise in conductive, turbulent, or shocked boundary layers.
Next to those O vi absorbers that trace highly-ionized gas in the immediate environment of galaxies, intergalactic O vi absorbers (i.e., absorbers that are not gravitationally bound to individual galaxies) may arise in regions that are sufficiently enriched with heavy elements. Previous surveys of high-redshift O vi absorbers (Bergeron et al. 2002; Simcoe et al. 2002, 2004, 2006; Carswell et al. 2002; Bergeron & Herbert-Fort 2005) have shown that there are many narrow O vi absorbers with Doppler-parameters km s-1. Such narrow lines cannot arise from collisionally ionized gas but must be related to photoionized (possibly intergalactic) gas with temperatures K. Many of these narrow O vi absorbers at low and high redshift display velocity-centroid offsets between O vi, C iv, and H i, suggesting that these ions do not arise in the same gas phase. Unfortunately, this crucial aspect is only partially considered in previous O vi surveys.
To explore the multi-phase character of high-ion absorbers and to improve our understanding of the ionization conditions in O vi systems it is important to investigate in detail the absorption characteristics and ionization conditions in selected absorption-line systems. For this purpose, absorbers that can be observed at high S/N and for which the O vi absorption is not blended by Ly forest lines are particularly important. Because of the complexity of many high-ion absorbers that often are composed of several velocity subcomponents a spectral resolution of and higher is desired. Note that while the analysis of individual high-ion absorbers is a common strategy to explore the nature of O vi absorbers at low redshift (e.g. Tumlinson et al. 2011; Savage et al. 2011), detailed studies of individual O vi absorption systems at high redshift are rare (e.g., Fox et al. 2011).
In this paper we present VLT/UVES observations at intermediate () and high () spectral resolution of two particularly interesting O vi systems at along the line of sight towards the quasar PKS 1448232. This sightline was selected by us for a detailed study, as it contains two unsaturated O vi systems at and , both displaying a well-defined subcomponent structure with narrow O vi/C iv absorption components and without major blending with Ly forest lines (Bergeron et al. 2002; Fox et al. 2008). These two absorption systems therefore represent ideal targets to study in detail the physical conditions in photoionized, multi-phase high-ion absorbers at high redshift.
2 Observations and absorption-line analysis
2.1 VLT/UVES observations
Our data set consists of intermediate- and high-resolution spectra of the quasar PKS 1448232 (; ), observed at the VLT with the UVES spectrograph. The intermediate-resolution data have a spectral resolution of , corresponding to a velocity resolution of km s-1 FWHM. These data were obtained and reduced as part of the ESO Large Programme “The Cosmic Evolution of the IGM” (Bergeron et al. 2002). The wavelength coverage of the intermediate resolution data is . The S/N in the data varies between and per spectral resolution element.
The high-resolution data have , corresponding to km s-1 FWHM velocity resolution and were obtained with VLT/UVES in 2007 in an independent observing run (program ID 079.A0303(A)). The wavelength coverage of the high resolution data is . The raw data were reduced using the UVES pipeline implemented in the ESO-MIDAS software package. The pipeline reduction includes flat-fielding, bias- and sky-subtraction and a relative wavelength calibration. The individual spectra then have been corrected to vacuum wavelengths and coadded. The S/N in the high-resolution data is per resolution element.
| O vi | C iv | H i | |||||||
| O vi | C iv | H i | log[(cm-2)] | [km s-1] | log[(cm-2)] | [km s-1] | log[(cm-2)] | [km s-1] | |
| high resolution data | |||||||||
| 1 | 2.10982 | 2.10982 | 2.10981 | 14.27(0.01) | 10.7(0.2) | 13.12(0.01) | 7.5(0.1) | 13.38(0.04) | 19.6(0.7) |
| 2 | 2.11011 | 2.11008 | 2.11018 | 13.50(0.02) | 8.4(0.4) | 12.23(0.03) | 6.1(0.6) | 13.37(0.04) | 28.6(1.7) |
| intermediate resolution data | |||||||||
| 1 | 2.10984 | 2.10983 | 2.10981 | 14.32(0.02) | 10.1(0.2) | 13.12(0.01) | 7.1(0.1) | 13.39(0.01) | 20.6(0.3) |
| 2 | 2.11014 | 2.11008 | 2.11019 | 13.49(0.20) | 5.4(0.5) | 12.23(0.03) | 5.3(0.6) | 13.35(0.01) | 26.4(0.8) |
2.2 Line-fitting method
The detected absorption features that are associated with the two absorbers at and were fitted independently in both spectra (at intermediate resolution and high resolution) with Gaussian profiles using the CANDALF fitting routine 111written by Robert Baade, Hamburger Sternwarte, which uses a standard Levenberg-Marquard minimization algorithm. The program simultaneously fits the continuum and the absorption lines, delivering ion column densities, , and Doppler parameters, , of for each absorption component. The continuum is modeled as a Legendre polynomial with an order of up to 4. The one-sigma fitting errors for and (as listed in Tables ) are estimated using the diagonals of the Hesse matrix.
2.3 The O vi system at
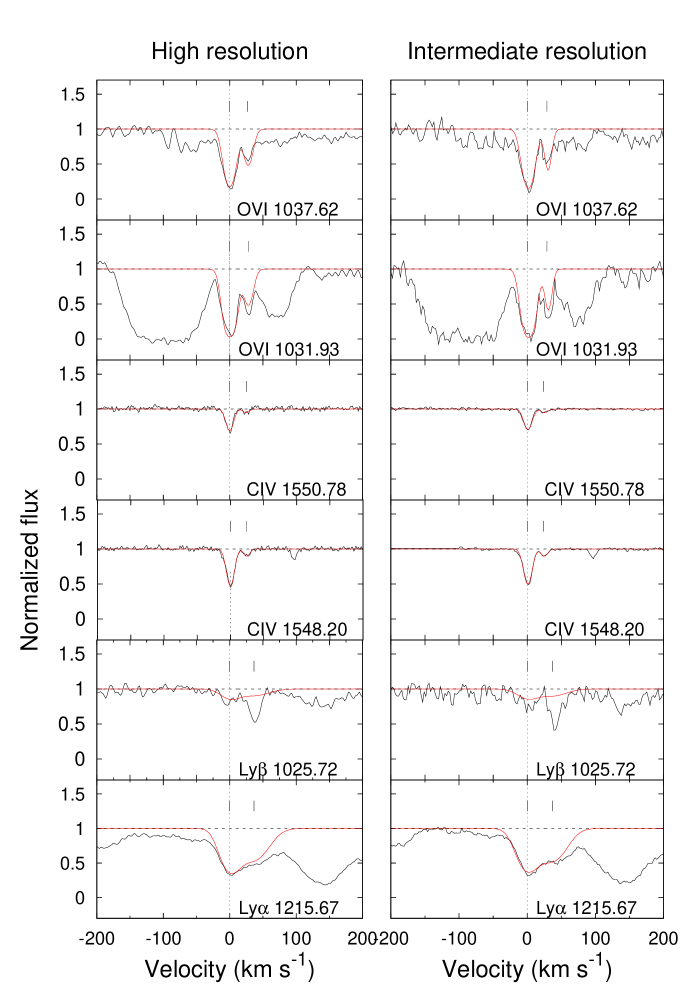
Fig. 1 shows the velocity profiles of O vi (), C iv (), and H i Ly and Ly () for the absorber in the high-resolution data (left panel) and the intermediate-resolution data (right panel). From the visual inspection of both panels we find no significant differences between the two data sets. The S/N ratios are better for the high resolution data, except for the C iv region where this ratio is slightly better at intermediate resolution. Therefore, the differences in the values for , , and derived for the individual absorption components in the intermediate and high-resolution spectra are a result of the different S/N values in the two data sets.
Two absorption components are detected in each of these ions. The O vi absorption is relatively strong compared to C iv. H i absorption is weak compared to other O vi absorbers at similar redshift (e.g., Bergeron et al. 2002) with a central absorption depth in the H i Ly line of less than 70 percent. Note that the second, weaker, component of H i Ly and Ly absorption associated with the high-ion absorption is blended, so that the true component structure of the H i and the relative H i column densities and H i -values remain somewhat uncertain. The blending aspect is not taken into account in the formal error estimate for and given in Table 1, which is based on the profile fitting. While for the stronger of these components the absorption of O vi, C iv, and H i is well aligned, there appears to be a small ( km s-1) velocity shift between H i and the high ions in the weaker component (see Table 1). If real, this shift may indicate that the H i and the metal ions may not trace the same gas phase in the weaker absorption component. Because of the blending of the H i absorption, however, the reality of this shift remains unclear.
We derive for the column densities, listed in Table 1, log (O vi, log (C iv, and log (H i in the stronger of the two components. The resulting ion-to-hydrogen ratios of (O vi(H i and (C iv)/(H i already indicate that the metallicity of this absorber must be fairly high (Bergeron & Herbert-Fort 2005). Note that because of the blending problem in the Ly and Ly lines the H i column density may be regarded as upper limit, so that the ratios given above could be even higher.
| log [(H i) (cm-2)] | [km s-1] | ||
| high resolution data | |||
| 1 | 2.16466 | 13.27 (0.01) | 40.0 (1.2) |
| 2 | 2.16552 | 14.49 (0.07) | 29.9 (1.2) |
| 3 | 2.16605 | 15.18 (0.03) | 34.9 (0.5) |
| 4 | 2.16746 | 13.16 (0.03) | 19.2 (0.6) |
| 5 | 2.16765 | 13.77 (0.01) | 45.6 (0.3) |
| intermediate resolution data | |||
| 1 | 2.16467 | 13.21 (0.02) | 37.4 (1.3) |
| 2 | 2.16559 | 14.57 (0.12) | 31.9 (1.7) |
| 3 | 2.16607 | 15.13 (0.05) | 35.5 (0.8) |
| 4 | 2.16749 | 13.19 (0.02) | 18.8 (0.5) |
| 5 | 2.16768 | 13.76 (0.01) | 46.8 (0.3) |
| O vi | C iv | C iii | |||||||
| O vi | C iv | C iii | log[(cm-2)] | [km s-1] | log[(cm-2)] | [km s-1] | log[(cm-2)] | [km s-1] | |
| high resolution data | |||||||||
| 1 | 2.16518 | — | — | 13.35(0.03) | 15.4(1.3) | — | — | — | — |
| 2 | 2.16542 | — | — | 13.02(0.08) | 8.0(1.2) | — | — | — | — |
| 3 | 2.16569 | 2.16569 | 2.16566 | 13.63(0.02) | 13.5(0.7) | 12.18(0.05) | 11.1(1.7) | 12.68(0.07) | 11.1a |
| 4 | 2.16600 | 2.16600 | 2.16602 | 13.41(0.03) | 9.9(0.6) | 13.17(0.05) | 9.3(0.5) | 13.49(0.05) | 15.1(1.5) |
| 5 | — | 2.16616 | 2.16618 | — | — | 12.96(0.10) | 10.0(1.6) | 12.78(0.23) | 8.0(3.7) |
| 6 | 2.16638 | 2.16638 | 2.16633 | 13.21(0.04) | 13.7(0.8) | 12.53(0.09) | 12.6(2.2) | 12.22(0.47) | 12.6a |
| 7 | 2.16744 | 2.16741 | 2.16740 | 12.75(0.15) | 6.8(0.8) | 11.90(0.05) | 4.8b | 12.17(0.14) | 4.8a |
| 8 | 2.16766 | 2.16770 | 2.16780 | 13.01(0.16) | 10.6(0.4) | 11.84(0.08) | 9.2c | 12.32(0.15) | 9.2a |
| 9 | 2.16796 | 2.16792 | 2.16789 | 13.30(0.08) | 10.9(1.3) | 11.50(0.12) | 4.8b | 11.85(0.36) | 4.8a |
| intermediate resolution data | |||||||||
| 1 | 2.16521 | — | — | 13.12(0.03) | 8.3(1.0) | — | — | — | — |
| 2 | 2.16544 | — | — | 13.13(0.04) | 6.4(0.9) | — | — | — | — |
| 3 | 2.16600 | 2.16567 | 2.16557 | 13.53(0.05) | 10.6(0.9) | 12.16(0.05) | 11.1(1.5) | 12.87(0.11) | 14.4(3.7) |
| 4 | 2.16606 | 2.16602 | 2.16603 | 13.73(0.04) | 24.8(3.1) | 13.23(0.02) | 10.4(0.4) | 13.39(0.08) | 10.4a |
| 5 | — | 2.16619 | 2.16626 | — | — | 12.73(0.09) | 7.5(0.9) | 13.12(0.15) | 7.5a |
| 6 | 2.16646 | 2.16637 | 2.16635 | 12.97(0.11) | 10.4(2.0) | 12.67(0.08) | 15.3(2.6) | — | — |
| 7 | 2.16748 | 2.16742 | — | 12.98(0.03) | 7.3(0.9) | 11.67(0.17) | 4.8(2.3) | — | — |
| 8 | 2.16767 | 2.16758 | — | 12.93(0.05) | 2.8(0.9) | 12.24(0.07) | 22.2(3.1) | — | — |
| 9 | 2.16796 | 2.16797 | — | 13.50(0.01) | 12.7(0.6) | 11.85(0.06) | 4.8(1.2) | — | — |
a Fixed to
b Fixed to -value derived from the intermediate resolution data
c Lower limit, fixed to the minimal value
2.4 The O vi system at
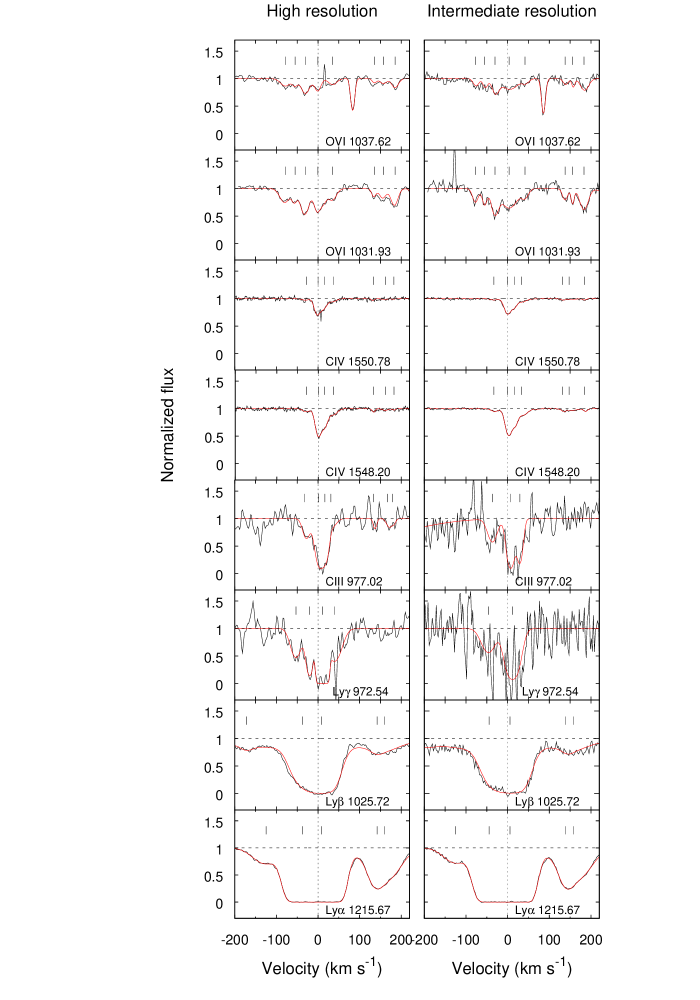
The O vi system at exhibits a significantly more complex absorption pattern than the absorber at , as can be seen in the velocity profiles presented in Fig 2. O vi absorption is observed in eight individual absorption components, spanning a velocity range as large as km s-1. From the visual inspection it is further evident that the absorption pattern of O vi is different than those of the other detected intermediate and high ions (C iii, C iv) and H i, although some of the components appear to be aligned in velocity space. As for the system at , there are no significant differences in the absorption characteristics between the high-resolution data and the intermediate-resolution data. However, the S/N ratio is somewhat lower in the latter for the lines that are located in the blue part of the spectrum, so that the resulting fitting values for , , and for the individual absorption components differ slightly (Tables 2 and 3).
We have modeled the H i absorption by simultaneously fitting Ly and Ly in four absorption components (components ; see Table 2), obtaining column densities between log (H i). One additional component (component 1) is present in the Ly absorption, but is blended in Ly (see Fig. 2), so that (H i) was derived solely from Ly . Note that for the H i fit we have not tried to tie the H i component structure to the structure seen in the the metal ions, as this requires knowledge about the physical conditions in the absorber. This aspect will be discussed in detail in Sect. 4.2, where we try to reconstruct the H i absorption pattern based on a photoionization model. Instead, we have fitted the H i absorption with the minimum number of absorption components required to match the observations (Fig. 2, lowest panel) and to obtain an estimate on the total H i column in the absorber.
By summing over the column densities in the individual absorption components we derive total column densities of log (O vi, log (C iii, log (C iv, and log (H i. The resulting ion-to-hydrogen ratios of (O vi(H i and (C iv(H i (representing the average over all components) are substantially smaller than in the system, pointing toward a lower (mean) metallicity of the absorber.
The complexity in the absorption pattern of the various species in this system and the large velocity spread suggests that this absorber arises in an extended multi-phase gas structure.
| log [ (cm-2)] | |||||||||
|---|---|---|---|---|---|---|---|---|---|
| [km s-1] | C iv | O vi | H i | log [(cm-3)] | log | log [(K)] | [kpc] | ||
| 1 | 0 | 13.12 | 14.27 | 13.38 | 4.20 | 0.24 | 4.54 | 19.9 | 5.21 |
| 2 | 25 | 12.23 | 13.50 | 13.37 | 4.25 | 1.02 | 4.64 | 30.5 | 5.35 |
| 2 | 25 | 12.23 | 13.50 | 12.57a | 4.28 | 0.24 | 4.57 | 4.7 | 5.32 |
a Our best H i guess in the model for the second
component with fixed metallicity
3 Ionization modeling and physical conditions in the gas
To infer information on the physical properties of the two O vi absorbers towards PKS 1448232 we have modeled in detail the ionization conditions in these systems. Since the two absorbers at and have redshifts close to the quasar redshift (), it is necessary to check whether the two systems lie in the proximity zone of the background quasar and are influenced by its ionizing radiation.
With the above given redshifts, the two absorbers have velocity separations from the QSO of km s-1 and km s-1 and thus the absorber at can be regarded (depending on the definition) as an associated system. With a (monochromatic) luminosity at the Lyman Limit of erg s-1 Hz-1, the size of the sphere-of-influence of the ionizing radiation from PKS 1448232 is known to be Mpc, corresponding to a velocity separation of km s-1 (Fox et al. 2008). Therefore, it is safe to assume that the ionizing radiation coming from PKS 1448232 itself has no measurable influence on the ionization conditions in the two O vi systems.
The small -values measured for O vi, C iv, and H i indicate that collisional ionization is not the origin for the presence of O vi in the gas. It is common to assume that the observed Doppler parameters () are composed of a thermal and a turbulent component ( and , respectively), so that . The thermal component can be expressed by , where is the gas temperature and is the mass of the considered ion. The Doppler parameters measured for the O vi components in the two absorbers are all km s-1 and many of them are km s-1 (see Tables 1 and 3), indicating that K. This value is below the peak temperature of O vi in a collisional ionization equilibrium ( K; Sutherland & Dopita 1993); it is also lower than the temperature range expected for O vi arising in turbulent mixing layers in the interface regions between cold and hot gas ( K; Kwak & Shelton 2010). Consequently, photoionization by the hard UV background remains as the only plausible origin for the presence of O vi in the two high-ion absorbers towards PKS 1448232.
Based on these considerations, we have modeled the ion column densities in the two O vi systems using the photoionization code CLOUDY (version C08; Ferland et al. 1998). For this, we have assumed a solar relative abundance pattern of O and C and an optically thin plane-parallel geometry in photoionization equilibrium, exposed to a Haardt & Madau (2001) UV background spectrum at , which is normalized to (Scott et al. 2000) at the Lyman limit.
We further assume that each of the observed velocity components is produced by a ”cloud”, which we model as an individual entity. As input parameters we consider the measured column densities of C iii (only for the absorber), C iv, O vi, the metallicity (in solar units), and the hydrogen particle density . The metallicity of each cloud and the hydrogen density were varied in a range appropriate for intergalactic clouds (i.e., log and log).
We then applied the following iterative modeling procedure. In a first step, CLOUDY was run with a set of values of , and (H i), where (H i) is constrained by the observations. In a second step, the corresponding values of (C iii), (C iv), and (O vi) were calculated. The output was compared with the observed column densities and, in case of a mismatch, the input parameters and were adjusted for the next iteration step. This process was repeated until the differences between the output column densities and the observed values became negligible and we obtained a unique solution. Next to the ion column densities, our CLOUDY model provides information on the neutral hydrogen fraction, , the gas temperature, , and the absorption pathlength, (H i.
3.1 The system at
As mention earlier, absorption by O vi and C iv is well aligned in both components in this system, while the true component structure of the H i is uncertain because of blending effects in the Ly and Ly lines. Because of the alignment of O vi and C iv we assume a single-phase model, in which each of the two components (clouds) at and km s-1 in the rest frame hosts O vi, C iv, and H i at column densities similar to the ones derived from the profile fitting. Consequently, we have chosen log (H i and as input for the CLOUDY modeling and followed the procedure outlined above. The results from the CLOUDY modeling of the absorber are summarized in Table 4. Our model reproduces well the observed O vi and C iv column densities in both components, if the clouds have a density of log , a temperature of log , and a neutral hydrogen fraction of log . However, to match the observations, the second component (at km s-1) in our initial model (Table 4, first two rows) needs to have metallicity of log , which is dex lower than for the other component (log ). The absorption path lengths are kpc for the component at km s-1 and kpc for the component at km s-1.
Because of the blending problem in the H i Ly and Ly absorption, which affects particularly the estimate for (H i) in the cloud at km s-1 (Fig. 1), we have set up a second CLOUDY model in which we have tied the metallicity of the km s-1 component to the metallicity of the other component (log ), but leaving (H i) for this component as a free parameter. ¿From this we derive a value of log (H i for the cloud at km s-1 and the absorption path-length reduces to kpc. In view of the blending, we regard this model as more plausible compared to the model with two different metallicities and a larger absorption path-length.
Summarizing, our CLOUDY modeling suggests that the absorber towards PKS 1448232 represents at relatively simple, metal-rich O vi absorber in which the high ions O vi and C iv coexist in a single gas-phase.
| log [ (cm-2)] | ||||||||||
|---|---|---|---|---|---|---|---|---|---|---|
| [km s-1] | C iii | C iv | O vi | H ia | log [(cm-3)] | log | log [(K)] | [kpc] | ||
| 3 | 28 | 12.68 | 12.18 | 10.97 | 14.51 | 2.74 | 1.7 | 4.42 | 0.3 | 3.68 |
| 4 | 0 | 13.49 | 13.17 | 12.25 | 14.18 | 2.97 | 1.7 | 4.46 | 4.1 | 3.95 |
| 5 | 16 | 12.78 | 12.96 | — | 14.51 | 3.56 | 1.7 | 4.58 | 16.3 | 4.63 |
| 6 | 37 | 12.22 | 12.53 | 12.86 | 14.08 | 3.71 | 1.7 | 4.61 | 12.3 | 4.79 |
| 7 | 134 | 12.17 | 11.90 | 10.92 | 13.26 | 2.93 | 1.0 | 4.38 | 0.04 | 3.84 |
| 8 | 162 | 12.32 | 11.84 | 10.49 | 13.57 | 2.67 | 1.0 | 4.34 | 0.02 | 3.55 |
| 9 | 182 | 11.85 | 11.50 | 10.38 | 12.99 | 2.84 | 1.0 | 4.37 | 0.01 | 3.73 |
a Our best H i guess in the models.
3.2 The system at
We started to model this system with CLOUDY, again under the assumption of a single gas-phase hosting the observed intermediate and high ions C iii, C iv, and O vi in the various subcomponents. However, during the modeling process it quickly turned out that it is impossible to match the observed column densities of C iii and O vi in a single gas-phase in the components, where these two ions are aligned in velocity space. Our modeling instead indicates that the C iii absorption must arise in an environment that has a relatively high gas density and that is spatially distinct from the O vi phase. In a second step, we have tried to tie together the high ions C iv and O vi in a single gas phase (as for the system) in the relevant absorption components, ignoring the C iii phase. Again, this approach does not deliver satisfying results, as we obtain for some of the components, for which C iv/O vi is constrained by observations, very low gas densities and very large absorption pathlengths on Mpc scales, which are highly unrealistic. Given the fact, that the overall component structure of O vi and C iv are substantially different in this system (Fig. 2), this result is not really surprising.
The only modeling approach, for which we obtain realistic results on gas densities, temperatures and absorption path-lengths in this system and its subcomponents is a two-phase model, in which C iii coexists with C iv and part of the H i in one (spatially relatively confined) phase, and O vi and part of the H i in a second (spatially relatively extended) phase. The coexistence of C iii and C iv in one phase is further suggested by the fact that C iii and C iv absorption is well aligned in velocity space (see Fig. 2). The results from this two-phase model are presented in Tables 5 and 6. A critical issue for the modeling of this complex multi-phase absorber with its many absorption components is an assumption for the neutral gas column density in each subcomponent (and phase). Since in the H i Ly and Ly absorption most subcomponents are smeared together to one large absorption trough, the observational data provide little information on the distribution of the H i column densities among the individual components. Yet, the data give a solid estimate for the total H i column density in the absorber (log ; see Sect. 2.4), which must match the sum of (H i) over all subcomponents considered in our model. Consequently, we included in our iteration procedure the constraints on (H i and the shape of the (total) H i absorption profile. The latter aspect also concerns the choice of the gas temperature in the model, as regulates the thermal Doppler-broadening and thus the width of the modeled H i lines. We have modeled the H i width following the aproach of Ding et al. (2003).
With these various constraints we first modeled the C iii/C iv phase in the absorber. However, because of the extremely complex parameter space, we did not find a unique solution for among the individual components, but had to make further constraints. Since the individual components observed in C iii/C iv are very close together in velocity space, we assumed they all have the same metallicity and, based on the range allowed in the model, we set log for all subcomponents. This model was able to match the observed column densities of these two ions in the individual subcomponents, but did not match well the gross shape of the overall H i absorption, suggesting that the metallicity in this absorber is non-uniform among the individual absorption components. Therefore, we refined our model, now using two different metallicities: log for the saturated H i components and log for the weaker H i components (see Tables 5 and 6 for details). Although not perfect, this model delivers a satisfying match between the modeled spectrum and the UVES data.
Adopting this model, we find that the C iii/C iv absorbing components have temperatures between log and , densities between log and , and neutral gas fractions between log and (see Table 5). The absorption path lengths vary between and kpc for the components with log , and between and kpc for the components with log . These numbers suggest that the C iii/C iv absorbing phase resides in relatively small and confined gas clumps. This scenario is supported by the small turbulent -values of km s-1 for the subcomponents that we derive in our model. Note that in Table 5 we also list the predicted column densities for O vi, which are typically orders of magnitude below the observed ones in this absorber. This, again, underlines that C iii/C iv and O vi must reside in different gas phases with different physical conditions to explain the observed column densities.
Finally, we have modeled the O vi absorbing phase in the absorber, based on the observed O vi column densities. Since there are no ions other than H i and O vi that could provide information about the physical conditions in this phase, we fixed the metallicity of the gas to log and log (equal to the C iii/C iv phase) and constrained the temperature range [] in the CLOUDY models based on the observed line widths of O vi (giving ) and the modeling results of the C iii/C iv phase (giving for all components except the first two). The results of this model are shown in Table 6. We derive gas densities in the range log to and neutral gas fractions in the range log to . The absorption path length varies between and kpc for the components with log , and between and kpc for the ones with log . The mismatch in (O vi) between the model and the data for components one and nine (see Table 6) points towards a metallicity distribution among the individual absorption components that is even more complex than the one assumed in our model. Despite this (minor) concern, our CLOUDY modeling for O vi provides clear evidence that the O vi absorbing phase has substantially lower gas densities than the C iii/C iv absorbing phase and is spatially more extended.
In summary, our CLOUDY modeling of the absorber suggests that this system represents a complex multi-phase gas structure, in which a number of cooler, C iii/C iv absorbing cloudlets are embedded in a spatially more extended, O vi absorbing gas phase spanning a total velocity range of km s-1. Although the metallicity is not well constrained in our model, it suggests that log in the absorber, which is dex below the value obtained for the system at .
| log [ (cm-2)] | ||||||||
|---|---|---|---|---|---|---|---|---|
| [km s-1] | O vi | H ia | log [(cm)] | log | log [(K)] | [kpc] | ||
| 1 | 78 | 12.96b | 13.17 | 3.76 | 1.7 | 5.36 | 19.8 | 5.86 |
| 2 | 55 | 13.02 | 14.10 | 3.77 | 1.7 | 4.79 | 25.8 | 5.03 |
| 3 | 30 | 13.63 | 14.51 | 3.91 … 3.31 | 1.7 | 4.42 … 5.24 | 58.4 … 67.7 | 5.50 … |
| 4 | 0 | 13.41 | 14.18 | 3.99 … 3.88 | 1.7 | 4.46 … 4.98 | 42.6 … 83.3 | 5.36 … 4.95 |
| 6 | 36 | 13.21 | 14.08 | 3.92 … 3.23 | 1.7 | 4.61 … 5.26 | 32.1 … 21.5 | 5.52 … 5.00 |
| 7 | 136 | 12.75 | 13.26 | 3.72 … 3.72 | 1.0 | 4.38 … 4.64 | 1.3 … 2.0 | 4.82 … 4.61 |
| 8 | 157 | 13.01 | 13.57 | 3.70 … 3.52 | 1.0 | 4.34 … 5.03 | 2.2 … 6.1 | 5.19 … 4.56 |
| 9 | 185 | 13.25c | 12.99 | 4.60 … 4.25 | 1.0 | 4.37 … 5.06 | 32.3 … 38.3 | 5.76 … 5.48 |
a Our best H i guess in the models
b Observed log (O vi)
c Observed log (O vi)
4 Discussion
Our detailed analysis of the two O vi absorbers at and towards the quasar PKS 1448232 displays the large diversity and complexity of high-ion absorbers at high redshift.
During the past years, a number of studies using both optical observations (e.g., Bergeron et al. 2002; Carswell et al. 2002; Simcoe et al. 2002, 2004, 2006; Bergeron & Herbert-Fort 2005; Aguirre et al. 2008) and numerical simulations (e.g., Fangano et al. 2007; Kawata & Rauch 2007) have been dedicated to investigate the properties of high-redshift O vi systems and their relation to galaxies.
Based on their survey of O vi absorbers in the redshift range , Bergeron & Herbert-Fort (2005) suggested that O vi systems may be classified into two different populations: metal-rich absorbers (“type 1”) that have large (O vi)/(H i) ratios and that appear to be linked to galaxies and galactic winds, and metal-poor absorbers (“type 0”) with small (O vi)/(H i) ratios that trace the intergalactic medium. The two absorbers towards PKS 1448232 discussed in this paper do not match the classification scheme of Bergeron & Herbert-Fort (2005). The absorber at has a very large (O vi)/(H i) ratio of (i.e., it is of type 1); it is a simple, single-phase, metal-rich system with a metallicity slightly below the solar value. Yet, this system is completely isolated with no strong H i Ly absorption within km s-1. In contrast, the absorber at has a (O vi)/(H i) ratio of only and a metallicity of solar or lower (i.e., it is of type 0 according to Bergeron & Herbert-Fort 2005). However, this absorber is a complex multi-phase system with a non-uniform metallicity, suggesting that originates in a circumgalactic environment. While this mismatch with the Bergeron & Herbert-Fort (2005) classification scheme certainly has no statistical relevance for the general interpretation of O vi absorbers at high redshift, the results suggest that for a thorough understanding of highly-ionized gas at high redshift the absorption characteristics of O vi systems may be too diverse for a simple classification scheme based solely on observed (and partly averaged) column density ratios of O vi, H i and other ions.
One critical drawback of many previous O vi surveys at high is that they often consider only simplified models for the ionization conditions in their sample of high-ion absorbers, so that the multi-phase character of the gas and possible ionization conditions far from a photoionization equilibrium are only insufficiently taken into account. As pointed out by Fox (2011), single-phase, single-component ionization models, if applied, will deliver physically irrelevant results for most of the O vi systems at high . This implies that previous estimates of the baryon- and metal-content of O vi absorbers at low and high possibly are afflicted with large systematic uncertainties.
One firm conclusion from many previous observational and theoretical studies of high-ions absorbers is that a considerable fraction of the O vi systems at low and high must arise in the metal-enriched circumgalactic environment of (star-forming) galaxies (e.g., Wakker & Savage 2009; Prochaska et al. 2011; Fox et al. 2011; Tepper-García et al. 2011; Fangano et al. 2007). Thus, the complex absorption pattern observed in the system towards PKS 1448232 and many other O vi absorbers at high may reflect the complex gas distribution of enriched gaseous material that was ejected from galaxies into the IGM during their wind-blowing phase (e.g., Kawata & Rauch 2007). In this context, Schaye et al. (2007) suggested that the intergalactic metals have been transported from galaxies through galactic winds and reside in the form of dense, small and high-metallicity patches within large hydrogen clouds. These authors point out that much of the scatter in the metallicities derived for high-redshift absorbers could be explained by the spatially varying number of the metal-rich patches and the different absorption path lengths through the surrounding metal-poor intergalactic filament instead of an overall (large-scale) metallicity scatter in the IGM. In this scenario, the substantial differences in the metallicities of the two O vi systems towards PKS 1448232, and even the intrinsic metallicity variations within the system, could be explained by the different geometries of the absorbing structures, suggesting that much of the H i that is associated with the metal absorption in velocity space, arises in a spatially distinct region. A similar conclusion was drawn by Tepper-García et al. (2011), who studied the nature of O vi absorbers at low using a set of cosmological simulations. Note that also absorbers with larger H i column densities, such as Lyman-limit systems (LLS) and damped-Lyman systems (DLAs), sometimes exhibit abundance variations among the different velocity subcomponents (e.g., Richter et al. 2005; Prochter et al. 2010). This indicates that the metals in the gas surrounding high galaxies are not well mixed.
The observed velocity differences between O vi and other ions and the multi-phase nature of the gas provide further evidence for an inhomogeneous metallicity and density distribution in intervening high-ion absorbers. It is an interesting fact that the velocity misalignment appears to concern only the O vi absorbing phase in high-ion absorbers at high redshift, while other high ions such as N v and C iv generally appear to be well aligned with H i, even in systems that exhibit a complex velocity-component structure (Fechner & Richter 2009). This puzzling aspect underlines that additional detailed studies of individual O vi absorption systems could be very important for our understanding of intergalactic and circumgalactic gas at high redshift, as this ion traces a metal-enriched gas phase that cannot be observed by other means.
5 Summary and outlook
In this paper, we have investigated two O vi absorbers at and towards the quasar PKS 1448232. For this, we have used high- () and intermediate-resolution () optical spectra obtained with the VLT/UVES instrument and CLOUDY photoionization models.
The O vi system at is characterized by strong O vi absorption and weak H i absorption in a relatively simple, two-component absorption pattern. The absorption by O vi, C iv, and H i are well aligned in velocity space, indicating that they trace the same gas phase. From a detailed photoionization modeling of this system we derive a metallicity of solar, a characteristic density of log , a temperature of log , and a total absorption path length of kpc. The absorber is isolated with no strong H i Ly absorption within km s-1.
The O vi absorber at represents a complicated, multi-component absorption system with eight relatively weak and narrow O vi absorption components spanning almost km s-1 in radial velocity. The O vi components are accompanied by strong H i absorption and C iii, C iv absorption. The O vi component structure differs from that of H i and C iv, indicating a multi-phase nature of the absorber. Our photoionization modeling with CLOUDY suggests the presence of (at least) two distinct gas phases in this system. C iii, C iv and most of the H i appear to coexist in several, relative compact cloudlets at gas densities of log to , temperatures of log and absorption path lengths of kpc. O vi appears to reside in a highly ionized, more extended gas phase at densities in the range log to , temperatures between log and , and absorption path lengths up to kpc. While the exact metallicity of the absorber is not well constrained, our modeling favours a non-uniform metal abundance among the individual absorption components with (at least) two different metallicities of log and log .
Our study displays the large diversity and complexity of O vi systems at high redshift. We speculate that some of the observed differences between the two high-ion absorbers towards PKS 1448232 could be a result of a inhomogeneous metallicity and density distribution in the photoionized IGM. Our study indicates that multi-phase, multi-component high-ion absorbers like the one at demand a detailed ionization modeling of the various subcomponents to obtain reliable information on physical conditions and metal-abundances in the gas. We conclude that a rather large effort is required to achieve a more complete view on the nature of O vi absorbers at high redshift.
For the future, we are planning to continue our investigation on these systems by using a larger sample of O vi absorbers in high-quality UVES archival data and compare their absorption characteristics with artificial spectra generated from numerical simulations of star-forming galaxies and their intergalactic environment.
Acknowledgements.
N.D. and P.R. acknowledge financial support by the German Deutsche Forschungsgemeinschaft, DFG, through grant Ri 1124/5-1.References
- Aguirre et al. (2008) Aguirre, A., Dow-Hygelund, C., Schaye, J., & Theuns, T. 2008, ApJ, 689, 851
- Bergeron et al. (2002) Bergeron, J., Aracil, B., Petitjean, P., & Pichon, C. 2002, A&A, 396, L11
- Bergeron & Herbert-Fort (2005) Bergeron, J. & Herbert-Fort, S. 2005, ArXiv Astrophysics e-prints
- Carswell et al. (2002) Carswell, B., Schaye, J., & Kim, T. 2002, ApJ, 578, 43
- Cen & Ostriker (1999) Cen, R. & Ostriker, J. P. 1999, ApJ, 519, L109
- Danforth & Shull (2008) Danforth, C. W. & Shull, J. M. 2008, ApJ, 679, 194
- Davé et al. (2001) Davé, R., Cen, R., Ostriker, J. P., et al. 2001, ApJ, 552, 473
- Ding et al. (2003) Ding, J., Charlton, J. C., Bond, N. A., Zonak, S. G., & Churchill, C. W. 2003, ApJ, 587, 551
- Fangano et al. (2007) Fangano, A. P. M., Ferrara, A., & Richter, P. 2007, MNRAS, 381, 469
- Fechner & Richter (2009) Fechner, C. & Richter, P. 2009, A&A, 496, 31
- Ferland et al. (1998) Ferland, G. J., Korista, K. T., Verner, D. A., et al. 1998, PASP, 110, 761
- Fox (2011) Fox, A. J. 2011, ApJ, 730, 58
- Fox et al. (2008) Fox, A. J., Bergeron, J., & Petitjean, P. 2008, MNRAS, 388, 1557
- Fox et al. (2011) Fox, A. J., Ledoux, C., Petitjean, P., Srianand, R., & Guimarães, R. 2011, ArXiv e-prints
- Haardt & Madau (2001) Haardt, F. & Madau, P. 2001, in Clusters of Galaxies and the High Redshift Universe Observed in X-rays, ed. D. M. Neumann & J. T. V. Tran
- Kawata & Rauch (2007) Kawata, D. & Rauch, M. 2007, ApJ, 663, 38
- Kwak & Shelton (2010) Kwak, K. & Shelton, R. L. 2010, ApJ, 719, 523
- Oppenheimer & Davé (2008) Oppenheimer, B. D. & Davé, R. 2008, MNRAS, 387, 577
- Prochaska et al. (2011) Prochaska, J. X., Weiner, B., Chen, H. ., Mulchaey, J. S., & Cooksey, K. L. 2011, ArXiv e-prints
- Prochter et al. (2010) Prochter, G. E., Prochaska, J. X., O’Meara, J. M., Burles, S., & Bernstein, R. A. 2010, ApJ, 708, 1221
- Richter et al. (2005) Richter, P., Ledoux, C., Petitjean, P., & Bergeron, J. 2005, A&A, 440, 819
- Richter et al. (2008) Richter, P., Paerels, F. B. S., & Kaastra, J. S. 2008, Space Sci. Rev., 134, 25
- Richter et al. (2004) Richter, P., Savage, B. D., Tripp, T. M., & Sembach, K. R. 2004, ApJS, 153, 165
- Savage et al. (2011) Savage, B. D., Narayanan, A., Lehner, N., & Wakker, B. P. 2011, ApJ, 731, 14
- Savage et al. (2002) Savage, B. D., Sembach, K. R., Tripp, T. M., & Richter, P. 2002, ApJ, 564, 631
- Savage et al. (2003) Savage, B. D., Sembach, K. R., Wakker, B. P., et al. 2003, ApJS, 146, 125
- Schaye et al. (2007) Schaye, J., Carswell, R. F., & Kim, T. 2007, MNRAS, 379, 1169
- Scott et al. (2000) Scott, J., Bechtold, J., Dobrzycki, A., & Kulkarni, V. P. 2000, ApJS, 130, 67
- Sembach et al. (2004) Sembach, K. R., Tripp, T. M., Savage, B. D., & Richter, P. 2004, ApJS, 155, 351
- Sembach et al. (2003) Sembach, K. R., Wakker, B. P., Savage, B. D., et al. 2003, ApJS, 146, 165
- Simcoe et al. (2002) Simcoe, R. A., Sargent, W. L. W., & Rauch, M. 2002, ApJ, 578, 737
- Simcoe et al. (2004) Simcoe, R. A., Sargent, W. L. W., & Rauch, M. 2004, Origin and Evolution of the Elements
- Simcoe et al. (2006) Simcoe, R. A., Sargent, W. L. W., Rauch, M., & Becker, G. 2006, ApJ, 637, 648
- Sutherland & Dopita (1993) Sutherland, R. S. & Dopita, M. A. 1993, ApJS, 88, 253
- Tepper-García et al. (2011) Tepper-García, T., Richter, P., Schaye, J., et al. 2011, MNRAS, 413, 190
- Theuns et al. (2002) Theuns, T., Viel, M., Kay, S., et al. 2002, ApJ, 578, L5
- Thom & Chen (2008a) Thom, C. & Chen, H.-W. 2008a, ApJS, 179, 37
- Thom & Chen (2008b) Thom, C. & Chen, H.-W. 2008b, ApJ, 683, 22
- Tripp et al. (2000) Tripp, T. M., Savage, B. D., & Jenkins, E. B. 2000, ApJ, 534, L1
- Tripp et al. (2008) Tripp, T. M., Sembach, K. R., Bowen, D. V., et al. 2008, ApJS, 177, 39
- Tumlinson et al. (2011) Tumlinson, J., Werk, J. K., Thom, C., et al. 2011, ApJ, 733, 111
- Wakker & Savage (2009) Wakker, B. P. & Savage, B. D. 2009, ApJS, 182, 378