Resolved Spectroscopy of a Brown Dwarf Binary at the T Dwarf/Y Dwarf Transition111Data presented herein were obtained at the W. M. Keck Observatory, which is operated as a scientific partnership among the California Institute of Technology, the University of California and the National Aeronautics and Space Administration, and made possible by the generous financial support of the W. M. Keck Foundation.
Abstract
We report resolved near-infrared imaging and spectroscopic observations of the T8.5 binary WISEP J045853.90+643452.6AB obtained with Keck/NIRC2, Keck/OSIRIS and the Keck Laser Guide Star Adaptive Optics system. These data confirm common proper and radial motion for the two components, and we see the first indications of orbital motion (mostly radial) for this system. -band spectroscopy identifies both components as very late-type brown dwarfs with strong H2O and CH4 absorption. The spectrum of WISE J0458+6434B also exhibits a compelling signature of NH3 absorption over 1.52–1.54 when compared to the T9 dwarf UGPS J072227.51054031.2. Comparison to T8-Y0 spectral standards and -band spectral indices indicate classifications of T8.5 and T9.5 for these two components, approaching the boundary between the T dwarf and Y dwarf spectral classes.
Subject headings:
binaries: visual — stars: individual (WISEP J045853.90+643452.6 (catalog )) — stars: low mass, brown dwarfs1. Introduction
The lowest-temperature brown dwarfs–the L, T and Y dwarfs–span an astrophysically-rich parameter space of mass, temperature and atmospheric chemistry that bridges the lowest-mass stars and the warmest exoplanets (Kirkpatrick 2005 and references therein). These sources also probe the efficiency of low-mass star formation and the chemical enrichment history of the Galaxy (Burgasser, 2004; Metchev et al., 2008; Bate, 2009). Very low-temperature brown dwarfs down to effective temperatures (Teffs) of 300–500 K are now being identified (e.g., Lucas et al. 2010; Luhman et al. 2011; Liu et al. 2011; Cushing et al. 2011; Kirkpatrick et al. 2011), primarily in deep, wide-field infrared surveys such as the United Kingdom Infrared Telescope Deep Sky Survey (UKIDSS; Lawrence et al. 2007); the Canada-France Brown Dwarf Survey (CFBDS; Delorme et al. 2008b) and, most recently, the Wide-field Infrared Survey Explorer (WISE; Wright et al. 2010). These discoveries probe previously unexplored realms of gas and condensate atmospheric chemistry (Burrows et al., 2003; Lodders & Fegley, 2006), and encompass the newly identified Y dwarf spectral class (Cushing et al., 2011).
While changes in spectral morphology are largely tied to changes in temperature, the transitions between late-type spectral classes also trace significant changes in atmospheric chemistry and dynamics. The M dwarf to L dwarf transition is accompanied by the formation of mineral condensates (Tsuji et al., 1996; Cooper et al., 2003; Helling et al., 2008), which deplete the photosphere of metal oxide gases (TiO, VO) and lead to more reddened optical and near-infrared spectral energy distributions. In addition, magnetic coronal and chromospheric emission drops precipitously across this M/L transition (Gizis et al., 2000; West et al., 2004), the result of both increasingly neutral atmospheres (Gelino et al., 2002; Mohanty et al., 2002) and reduced magnetic field energy with reduced mass (Christensen et al., 2009). The L dwarf to T dwarf transition, signaled by the emergence of CH4 absorption at near-infrared wavelengths, is coincident with the removal of mineral condensate clouds from the photosphere (Ackerman & Marley, 2001; Burgasser et al., 2002b; Knapp et al., 2004; Tsuji, 2005) and the increased influence of non-equilibrium chemistry on observed molecular abundances (Noll et al., 1997; Griffith & Yelle, 1999; Saumon et al., 2006; Yamamura et al., 2010). Given the very recent discovery of Y dwarfs, transitional behaviors have yet to be explored at these spectral types, although atmospheric models predict the formation of salt and water condensates that may significantly shift photospheric chemistry and spectral appearance (e.g., Lodders 1999; Burrows et al. 2003; Leggett et al. 2007).
Ideal probes of such spectral transitions are physical binaries whose components straddle the corresponding classes. These presumably coeval systems share a common age and bulk chemical composition, and reside at a common distance, making relative comparisons less dependent on these parameters. For example, evidence for a rapid dissipation of clouds at the L dwarf/T dwarf transition includes the apparent brightening of early T dwarfs at 1 as observed among L/T transition binaries (Burgasser et al., 2006b; Liu et al., 2006; Looper et al., 2008), and the higher apparent multiplicity rate of these systems (Burgasser, 2007). Physical parameters such as age, mass and radii have also been measured for low-mass binaries; these serve as critical empirical constraints for evolutionary models (e.g., Lane et al. 2001; Zapatero Osorio et al. 2004; Stassun et al. 2006; Dupuy et al. 2009; Konopacky et al. 2010). Finally, companions to low-luminosity sources are frequently low-temperature extrema. The prototypes for both the L dwarf (GD 165B; Becklin & Zuckerman 1988) and T dwarf (Gliese 229B; Nakajima et al. 1995) spectral classes were identified as companions to low-luminosity stars, as were two of the coldest brown dwarfs currently known, WD 0806-661B (Luhman et al., 2011) and CFBDSIR J1458+1013B (Liu et al., 2011).
One of the first very late-type T dwarfs to be uncovered by the WISE survey was WISEP J045853.90+643452.6 (hereafter WISE J0458+6434; Mainzer et al. 2011), a T8.5 dwarf at an estimated distance of 10 pc from the Sun. Subsequent adaptive optics (AO) imaging observations by Gelino et al. (2011) revealed this source to be a binary with a separation of 05 and a relative brightness of = 0.980.08. Given the late spectral type of the composite spectrum and the significant magnitude difference between the components, WISE J0458+6434B was estimated to have a T9 spectral type and Teff 500 K. However, uncertainties in the distance of this system, the unknown spectral energy distribution of the secondary, and the very recent empirical definition of the Y dwarf spectral class (Cushing et al., 2011) means that WISE J0458+6434AB could potentially straddle the T dwarf/Y dwarf transition.
In this article, we present resolved near-infrared imaging and spectroscopy of the WISE J0458+6434 system obtained with the Keck II NIRC2 camera, OH-Suppressing InfraRed Integral field Spectrograph (OSIRIS; Larkin et al. 2006) and Laser Guide Star Adaptive Optics system (LGSAO; Wizinowich et al. 2006; van Dam et al. 2006). These data confirm common proper motion for the system and the first evidence for orbital motion. We use the -band OSIRIS spectra to classify the components, and identify tentative evidence for near-infrared NH3 absorption in WISE J0458+6434B. In Section 2 we describe our observations and data reduction methods. In Section 3 we analyze our astrometric measurements, and provide an initial qualitative characterization of the binary orbit. In Section 4 we analyze the spectral data, deriving classifications using both spectral templates and -band indices, and examining evidence for NH3 absorption. In Section 5 we discuss our results, focusing on the absolute magnitudes of WISE J0458+6434AB in the context of the T dwarf/Y dwarf transition.
2. Observations
2.1. NIRC2 Imaging
New high-resolution LGSAO imaging observations of WISE J0458+6434 were obtained with NIRC2 on the 10 m Keck II Telescope on 2011 August 29 (UT). Conditions were clear with seeing of 05. Data were obtained with the narrow plate scale mode of NIRC2 (9.9630.011 mas pixel-1; Pravdo et al. 2006) at an orientation of 0 and airmass 1.5. We observed the target in the -, - and -band filters using a 3-point dither pattern that avoided the noisy, lower left quadrant of the focal plane array. Individual exposure times were 120 s in and and 300 s in , for total integrations of 360 s, 900 s and 360 s in , and , respectively. The sodium LGS provided the wave front reference source for AO correction, while tip-tilt aberrations and quasi-static changes were measured by monitoring the = 15.6 field star USNO-B1.0 1545-0122611 (Monet et al., 2003) located = 277 from WISE J0458+6434.
Images were reduced using custom IDL222Interactive Data Language. scripts. Sky background and dark current were removed from each image by pairwise subtracting it with the following image in the dither sequence, then dividing by a normalized dome flat to correct for pixel-to-pixel sensitivity variations. The calibrated image frames were registered to the peak of the primary’s point spread function (PSF), then median-combined to produce the final mosaics shown in Figure 1.
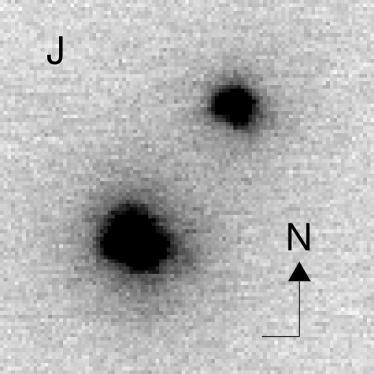
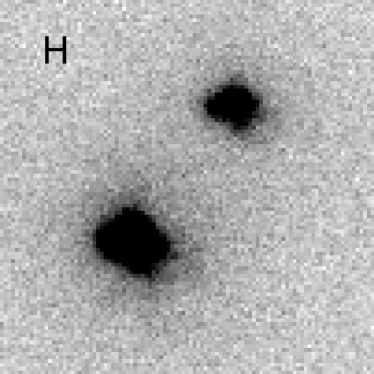
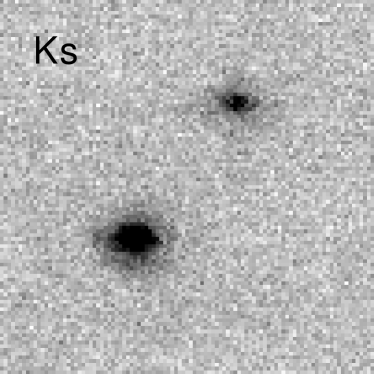
The quality of these data are significantly improved over the discovery observations from Gelino et al. (2011), with components that are well-separated in the field-of-view (FOV). Relative fluxes were computed using aperture photometry on the coadded images. Given the wide separation of the components, no PSF subtraction or other specialized procedures were required for the photometry. The radial separation and position angle of the fainter component with respect to the brighter component was measured on each of the nine individual exposures. The values listed in Table 1 report the average and standard deviation of those nine measurements. Relative - and -band flux measurements are in excellent agreement with those reported in Gelino et al. (2011), but are of far greater precision. In contrast, there is a significant shift in the relative separation of the two components, with = 5414 mas and = 2716 mas. Notably, this shift is largely in a radial direction. We discuss the astrometry in further detail in Section 3.
2.2. OSIRIS Spectroscopy
Resolved spectroscopy of WISE J0458+6434 was obtained with OSIRIS and LGSAO on 2011 February 3 (UT), in clear conditions with seeing of 08-10. The 50 mas-scale camera and Hbb filter were employed, providing 1.47–1.80 spectroscopy at an average resolution of 3800 and dispersion of 2.1 Å pixel-1 over a 0832 FOV. The source was first acquired in the imaging camera, then offset to the spectrograph array. The image rotator was set to 0. Eight exposures of 600 s each were obtained over an airmass range of 1.40–1.52 using a two-step dither pattern with steps of 10 along the long axis of the FOV. For LGSAO tip-tilt correction, we employed the same star as that used for the NIRC2 imaging. We also obtained four 30s observations of the A0 V star BD +64 489 ( = 9.43) in natural guide star AO mode at an airmass of 1.72 for telluric correction and flux calibration purposes.
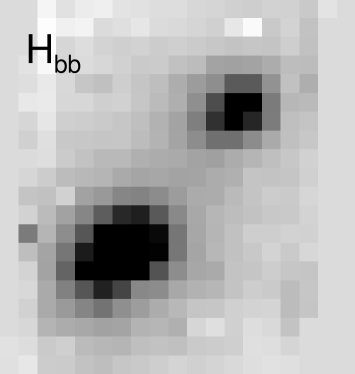
Data were reduced with the OSIRIS data reduction pipeline (Krabbe et al., 2004), version 2.3. We first subtracted from the source and calibrator images median-combined sets of dark frames with identical exposure times. We then used the pipeline to adjust bias levels, remove detector artifacts and cosmic rays, extract and wavelength-calibrate the position-dependent spectra (using the most current rectification files as of February 2011), assemble 3D data cubes and correct for dispersion. Figure 1 displays a 11 section of this cube coadded over the wavelength range 1.56–1.60 . The two components are cleanly resolved, separated by 10 spaxels (05) along a NW-SE axis. The full width at half maximum of the PSF was measured to be 150 mas (3 spaxels) over this wavelength range for both components, slightly elongated in the direction of the tip-tilt star. Relative astrometry from these data were determined from each of the reduced data cubes, using a median stack over the spectral dimension 1.56–1.60 . The IDL routine cntrd was used to measure the peak pixel positions of the primary and secondary in each image, and pixel separations along each axis were converted to angular separations in Right Ascension and declination. Mean measurements and standard deviations are listed in Table 1. The offsets are intermediate between those of the two NIRC2 observations, consistent with a continuous reduction in separation over nearly constant position angle.
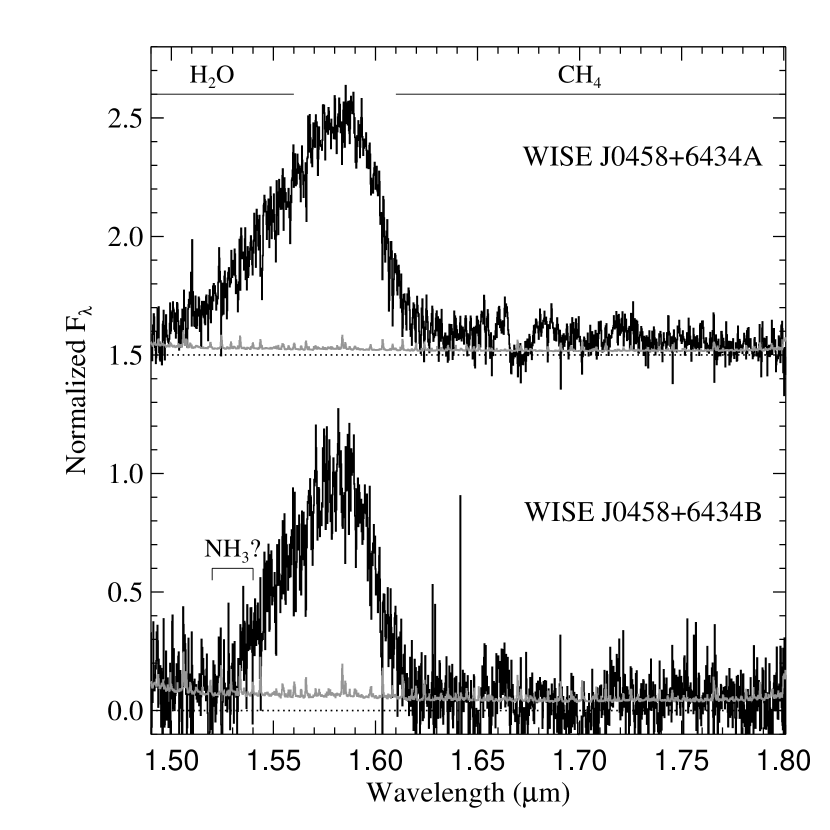
Spectra for both components of WISE J0458+6434 and the calibrator star were extracted directly from the data cube via aperture photometry in each image plane, using a 1.5-spaxel (75 mas) aperture for WISE J0458+6434 and a 3-spaxel (150 mas) aperture for BD +64 489, with 10–20 spaxel (05–10) sky annuli. The individual spectra for all three sources were scaled and combined using the xcombspec routine in SpeXtool (Cushing et al., 2004). Flux calibration and telluric correction of the WISE J0458+6434AB spectra were performed using the xtellcor_general routine in SpeXtool, assuming a 20 nm Gaussian kernel to model the widths of the A0V H I lines, and a Kurucz model spectrum of Vega (Vacca et al., 2003). Figure 2 displays the reduced spectra of the WISE J0458+6434 components. Both are unambiguously late-type T dwarfs based on the presence of strong H2O absorption up to 1.55 and strong CH4 absorption beyond 1.59 . These bands constrain the -band flux to a discrete 1.50–1.62 peak, which is narrower in the spectrum of WISE J0458+6434B. Unbinned peak signal-to-noise (S/N) is 40 in the spectrum of WISE J0458+6434A and 15 in the spectrum of WISE J0458+6434B.
3. Astrometric Analysis
As noted above, astrometry from NIRC2 and OSIRIS observations of WISE J0458+6434 indicate a monotonic decrease in the separation of this pair along a near constant position angle of 320, with the separations in Right Ascension from the two NIRC2 observations differing by nearby 4. To assess how this relative motion relates to systemic common motion, and hence physical association, we compared our measurements against predicted separations anchored to our 2011 August 29 (UT) astrometry, considering three limiting scenarios: (1) the secondary is a background source with negligible parallactic or proper motion, (2) the secondary is at the same distance as the primary, but with negligible proper motion, and (3) the primary and secondary maintain constant separation at all times. Figure 3 shows that none of these scenarios are fully consistent with the data, although the last provides the closest match. Allowing relative motions and distances to vary freely, we found that our measured astrometry (with 3 uncertainty allowance) constrains the relative proper motion to be less than 77 mas yr-1, or a mere 4 km s-1 at a distance of 10 pc. For comparison, the circular orbital speed of a 0.05 M☉ brown dwarf in an equal-mass binary separated by 5 AU is 3 km s-1. We also measured the relative radial velocity (RV) of the two components by cross-correlating our OSIRIS spectra over the 1.58–1.65 range, properly accounting for noise through Monte Carlo simulation. We find RV = 315 km s-1, consistent with zero to within 1/5 of a spectral resolution element.


| Parameter | Value |
|---|---|
| NIRC2 Epoch 2010 March 24 (UT)aaFrom Gelino et al. (2011). | |
| (mas) | 32814 |
| (mas) | 39016 |
| (mas) | 51020 |
| () | 3201 |
| 0.980.08 | |
| 1.000.09 | |
| OSIRIS Epoch 2011 February 3 (UT) | |
| (mas) | 30810 |
| (mas) | 38614 |
| (mas) | 49315 |
| () | 321.41.0 |
| NIRC2 Epoch 2011 August 29 (UT) | |
| (mas) | 274.53.4 |
| (mas) | 362.94.0 |
| (mas) | 455.14.2 |
| () | 322.90.4 |
| 0.980.01 | |
| 1.020.01 | |
| 1.060.03 | |
Note. — Angular separation () and position angle () are measured from the brighter primary to the fainter secondary.
These stringent limits on the relative motion of the WISE J0458+6434 components indicate that the two sources comprise a common proper motion, physically-bound binary. As such, the small but significant astrometric shifts observed must arise from orbital motion. Figure 4 provides a visualization of our three separation measurements projected onto the plane of the sky. The near radial motion and marginal indication of an inward acceleration ( km s-1 yr-1) suggests an eccentric and/or nearly edge-on orbit that is moving toward alignment. In the most optimistic case—if WISE J0458+6434 was observed at or near maximum elongation in the first NIRC2 epoch—these observations constrain the orbital semimajor axis to the range 5/(1+e) 5/(1e) AU, where is the orbital eccentricity and a distance of 10 pc is assumed. Unfortunately, more stringent constraints on this system’s orbit are not possible with these few measurements clumped in one region of separation space. Over the next decade it should be possible to disentangle the eccentricity and inclination of the orbit, and provide more robust constraints on the period and total system mass.
4. Spectral Analysis
4.1. Component Spectral Classifications
| Source | H2O-HaaIndex uncertainties computed directly from spectral flux errors via Monte Carlo sampling. | CH4-HaaIndex uncertainties computed directly from spectral flux errors via Monte Carlo sampling. | NH3-HaaIndex uncertainties computed directly from spectral flux errors via Monte Carlo sampling. | Adopted | Ref |
|---|---|---|---|---|---|
| SpTbbFor WISE J0458+6434AB, this includes comparison to spectral standards as shown in Figure 5. | |||||
| 2MASS J04150935ccSpectroscopic standards (Burgasser et al., 2006a; Cushing et al., 2011). | 0.1830.002 | 0.1040.002 | 0.6280.004 | T8 | 1,2 |
| WISE J0458+6434A | 0.1290.006 (T9) | 0.0790.003 (T9) | 0.5610.003 (T8.5) | T8.5 | 3 |
| UGPS J07220540ccSpectroscopic standards (Burgasser et al., 2006a; Cushing et al., 2011). | 0.1150.006 | 0.0750.005 | 0.5270.008 | T9 | 4,5 |
| WISE J0458+6434B | 0.0860.015 (T9.5) | 0.0400.007 (Y0+) | 0.4590.008 (T9.5) | T9.5 | 3 |
| WISE J1738+2732ccSpectroscopic standards (Burgasser et al., 2006a; Cushing et al., 2011). | 0.0450.008 | 0.0520.008 | 0.3500.011 | Y0 | 5 |
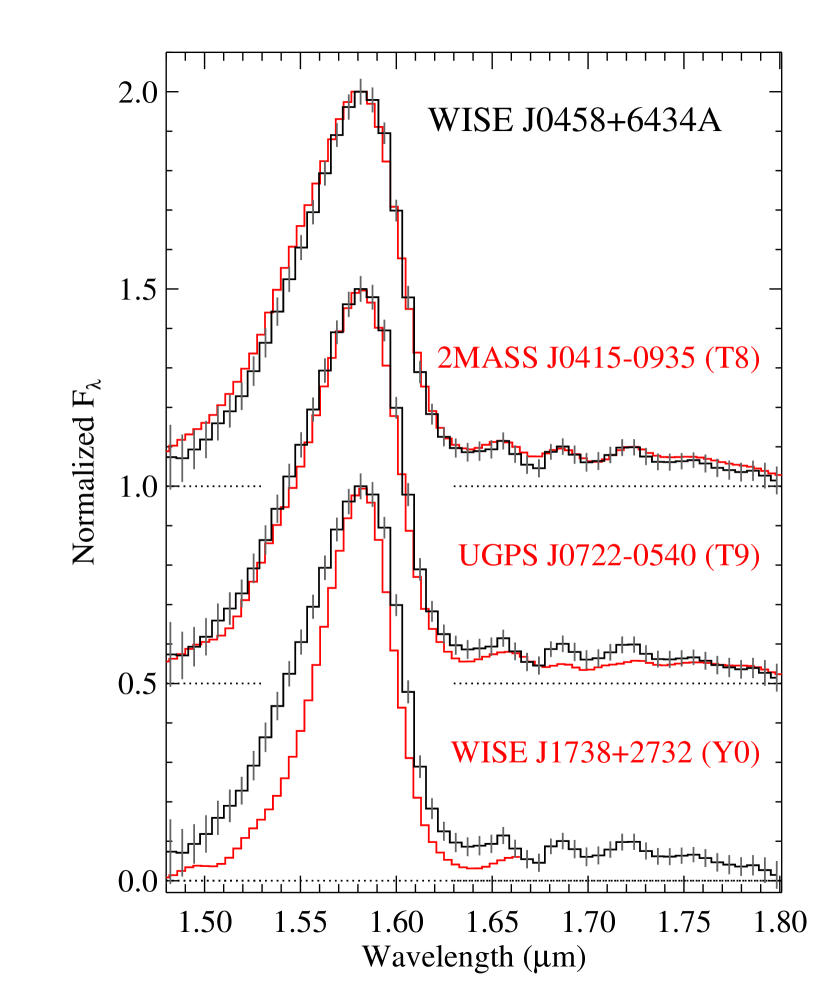
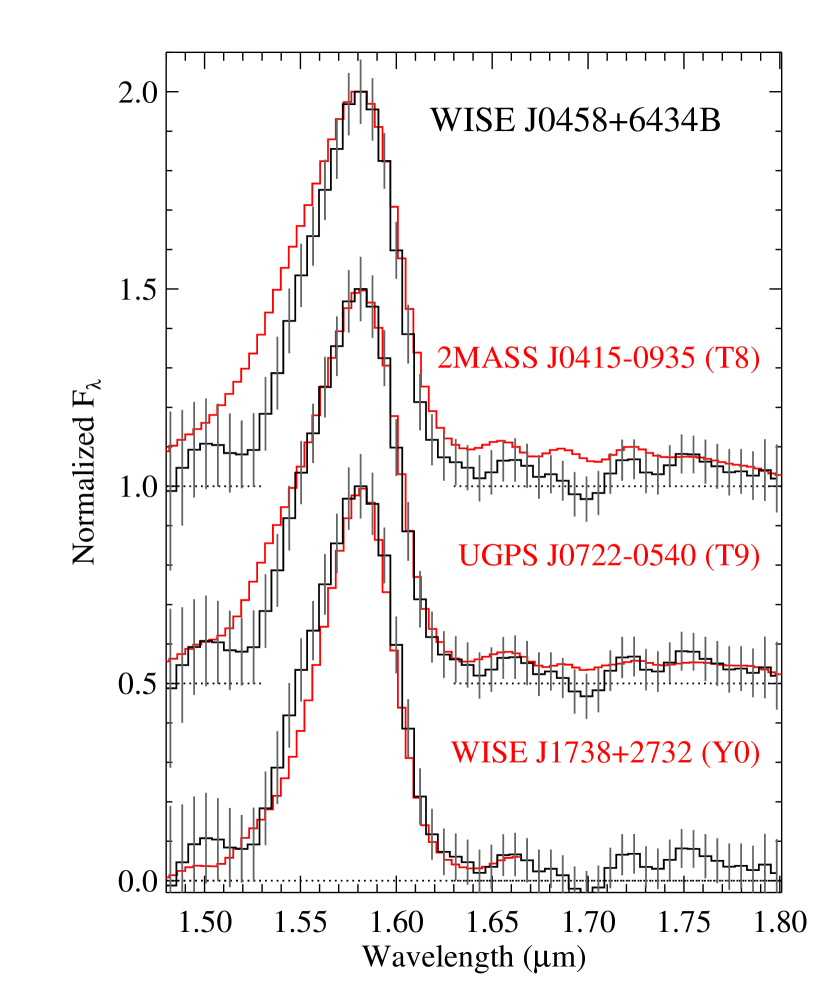
The strong H2O and CH4 absorption in the spectra of WISE J0458+6434AB are consistent with very late T and possibly Y spectral types. To robustly determine the classifications, we first compared the spectra to the standards 2MASS J041519540935066 (T8; hereafter 2MASS J04150935; Burgasser et al. 2002a, 2004), UGPS J072227.51054031.2 (T9; hereafter UGPS J07220540; Lucas et al. 2010; Cushing et al. 2011), and WISEP J173835.52+273258.9 (Y0; hereafter WISE J1738+2732; Cushing et al. 2011). The latter two sources were defined by Cushing et al. (2011) to extend the T dwarf near-infrared classification scheme of Burgasser et al. (2006a) across the T dwarf/Y dwarf transition. Figure 5 shows these comparisons, with all of the spectra smoothed to a common resolution of = 100 and normalized at 1.58 . WISE J0458+6434A is a reasonably fair match to 2MASS J04150935, albeit with slightly deeper absorption on the blue side of the 1.58 peak and a somewhat narrower peak. It has weaker 1.6 CH4 absorption than UGPS J07220540, indicating that it is not as late as T9. WISE J0458+6434B, on the other hand, has stronger H2O and CH4 absorption than 2MASS J04150935 and UGPS J07220540, but less absorption around 1.55 than WISE J1738+2732. These by-eye comparisons suggest types of T8-T8.5 for WISE J0458+6434A and T9-T9.5 for WISE J0458+6434B.
We also computed -band spectral classification indices H2O-H and CH4-H (Burgasser et al., 2006a) and NH3-H (Delorme et al., 2008a) for both components of WISE J0458+6434. The last index was shown by Cushing et al. (2011) to exhibit a distinct break at the T/Y transition. Values are listed in Table 4.1, along with estimated subtypes based on comparison to index values for the spectral standards. Indices for WISE J0458+6434A are well-matched to those for UGPS J07220540, albeit with an NH3-H index intermediate between T8 and T9. H2O-H and NH3-H indices for WISE J0458+6434B are intermediate between T9 and Y0; its CH4-H index is smaller than any late T dwarf/Y dwarf measured thus far with the exception of the T9.5 WISEPC J014807.25720258.8 (Cushing et al., 2011). Combining the index types and direct spectral comparisons, we infer subtypes of T8.5 and T9.5 for WISE J0458+6434A and B.
4.2. Ammonia in the Spectrum of WISE J0458+6434B
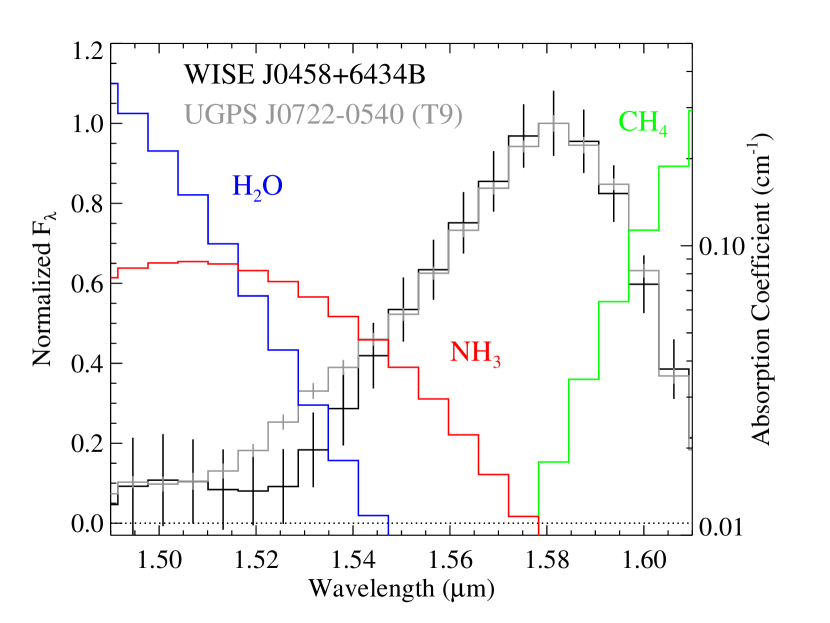
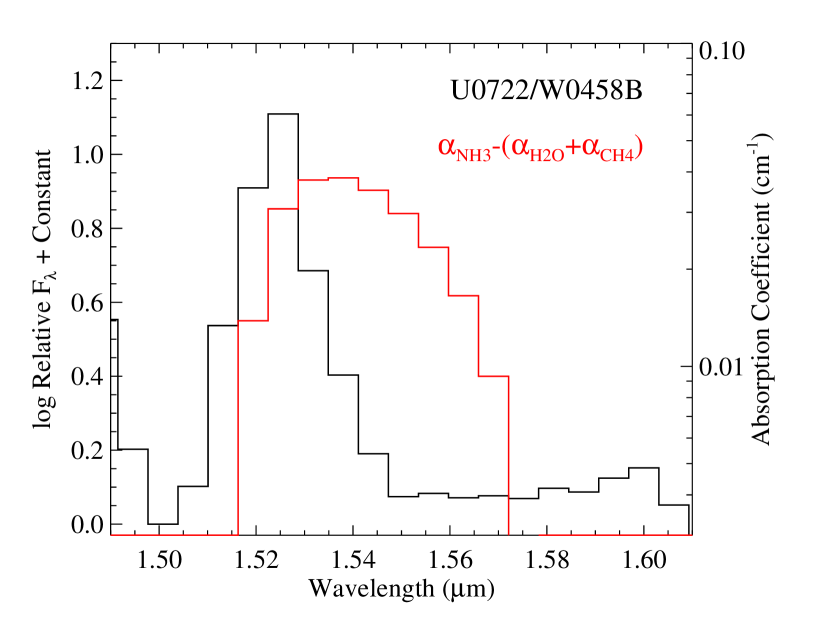
Close examination of the spectral comparisons in Figure 5 indicates additional absorption in the spectrum of WISE J0458+6434B over the 1.52–1.54 region compared to both 2MASS J04150935 and UGPS J07220540. This feature is similar to those noted by Cushing et al. (2011) in the spectra of the Y0 dwarfs WISEPC J140518.40+553421.5 and WISE J1738+2732, which were tentatively attributed to NH3 absorption. We examined whether the excess absorption in WISE J0458+6434B could also be due to NH3 by comparing its spectrum and that of UGPS J07220540 to absorption coefficients () for H2O, CH4 and NH3. Absorption coefficients were computed by multiplying scattering cross-sections per molecule (), as tabulated by Freedman et al. (2008) for T = 500 K and P = 1 bar, with molecular number densities () assuming fractional abundances () based on the non-equilibrium chemistry calculations of Saumon et al. (2006):
Here, cm-3 is the total number density of gas particles assuming an ideal gas. From Saumon et al. (2006), we adopt = 3.1, = 3.3 and = 4.9. Note that non-equilibrium chemistry reduces NH3 abundances by a factor of 10.
Figure 6 compares the smoothed absorption coefficients for these molecules to equivalently smoothed spectra of UGPS J07220540 and WISE J0458+6434B. We find that NH3 absorption exceeds that of H2O beyond 1.52 , around the region where we also see excess absorption in the spectrum of WISE J0458+6434B. The right panel of Figure 6 shows another view of this, comparing the relative absorption between UGPS J07220540 and WISE J0458+6434B to the differential absorption between NH3, H2O and CH4. There is relatively close spectral alignment between excess NH3 opacity and excess absorption in the spectrum of WISE J0458+6434B, suggesting NH3 as the primary absorber at these wavelengths. However, this conclusion carries a few caveats. First, the photospheres of brown dwarfs are not homogeneous, and absorption contributing to this spectral region is integrated over a pathlength that spans a range of temperatures and pressures that do not necessary coincide with the values used here to calculate molecular opacities. Second, the opacities of absorbers other than NH3 are also likely to differ between these two sources, which may add additional structure to the relative intensities. Finally, while the excess absorption in WISE J0458+6434B is statistically significant, the precise location of the relative intensity peak is not robust due to the large uncertainties in the spectrum of WISE J0458+6434B at these (low intensity) wavelengths. Hence, while evidence for NH3 absorption in the near-infrared spectrum of WISE J0458+6434B is compelling, confirmation of this will require higher signal-to-noise data and more detailed modeling of the spectrum.
5. Discussion
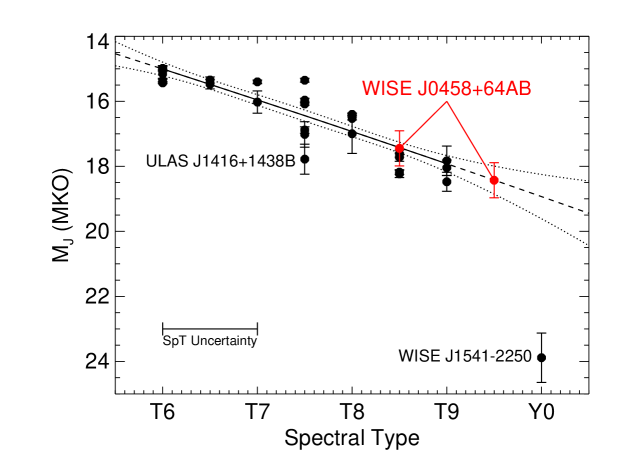
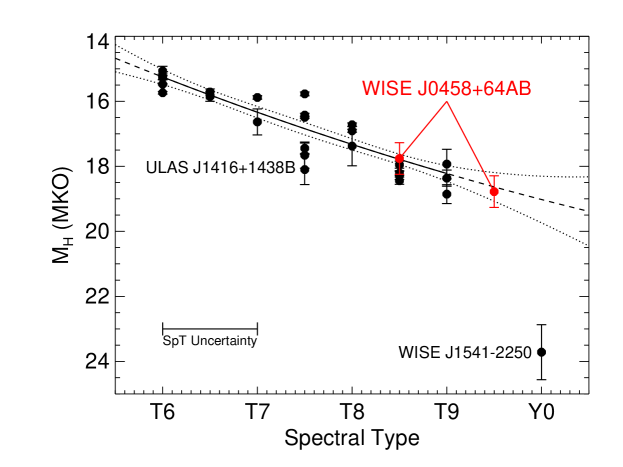
One of the benefits of studying a physical binary is that its components share a common distance. In the case of WISE J0458+6434AB, this allows us to bootstrap existing absolute magnitude/spectral type trends out to the end of the T dwarf sequence. Figure 7 shows absolute MKO and magnitudes for 27 unresolved T6-Y0 dwarfs with reported parallax distance measurements333These are based on data from Tinney et al. (2003); McCaughrean et al. (2004); Vrba et al. (2004); Henry et al. (2006); Burningham et al. (2009); Artigau et al. (2010); Goldman et al. (2010); Leggett et al. (2010); Scholz (2010); Lucas et al. (2010); Marocco et al. (2010); Kirkpatrick et al. (2011) and Liu et al. (2011). We excluded two sources from this sample: the T6.5 SDSSp J134646.45003150.4, for which existing photometry is blended with an unassociated background source (Burgasser et al., in prep.); and the T6.5p ULAS J115038.79+094942, which has a poorly constrained parallax ( = 0.45; Marocco et al. 2010).. For sources with types later than T8, we adopt the revised classifications listed in Cushing et al. (2011). To delineate trends in absolute magnitudes from T6 to T9, we generated a series of second-order polynomial fits to these data accounting for uncertainties through Monte Carlo sampling444We assumed classification uncertainties of 0.5 subtypes and absolute magnitude uncertainties as indicated. We then performed 1000 fits to simulated data, offsetting the original spectral types and absolute magnitudes of each source by random draws from a normal distribution with mean zero and standard deviation equal to the uncertainty.. Figure 7 shows the resulting mean trends and 1 deviations in and as a function of spectral type, which were used to estimate the absolute magnitudes for WISE J0458+6434A and B (Table 3). Combining absolute and apparent magnitudes for each component in both filter bands, we derive statistically consistent distance estimates of 10.51.8 pc and 11.22.2 pc for the A and B components, respectively. These are also formally consistent with the systemic spectrophotometric estimates of Mainzer et al. (2011, 9.01.9 pc) and Gelino et al. (2011, 10.51.4 pc). The agreement between these distances further supports the identification of this system as a physical binary; or, assuming that, justifies the extrapolation of existing absolute magnitude/spectral type trends to subtype T9.5.
| Parameter | WISE J0458+6434A | WISE J0458+6434B |
|---|---|---|
| MKO | 17.500.07 | 18.480.07 |
| MKO | 17.40.5 | 18.40.5 |
| MKO | 17.770.11 | 18.790.11 |
| MKO | 17.80.5 | 18.80.5 |
| Est. Distance (pc) | 10.51.8 | 11.22.2 |
Currently, the only Y dwarf with a parallax distance measurement is WISEP J154151.65225025.2 (hereafter WISE J15412250), classified Y0 by Cushing et al. (2011). Kirkpatrick et al. (2011) report a preliminary parallax of 351108 mas for this source, corresponding to a distance of 2.80.9 pc and absolute magnitudes = 23.90.8 and = 23.70.8. These values make WISE J15412250 roughly 100 times fainter than WISE J0458+6434B in the near-infrared, despite the seemingly minor change in spectral morphology (cf. comparison of WISE J0458+6434B to the Y0 standard WISE J1738+2732 in Figure 5). This jump in brightness, also discussed by Cushing et al. (2011), suggests a dramatic redistribution of radiation out of the near-infrared band, as the corresponding difference in Teff, roughly 500 K to 350 K, reduces the luminosity by only a factor of 4, assuming equivalent radii. A greater fraction of flux is certainly being emitted at mid-infrared wavelengths, due to the redward shift in the blackbody peak and increased near-infrared absorption from H2O, CH4 and collision-induced H2 with lower Teff. Additional absorption may also arise from water ice clouds that are expected to form at these temperatures, as scattering opacity from 10-100 -sized ice grains would efficiently suppress near-infrared emission just as mineral grains are observed to do so in the L dwarfs (Ackerman & Marley, 2001). While an improved parallax measurement for WISE J15412250 and other newly-discovered Y dwarfs are needed to confirm this dramatic drop in near-infrared flux, these early indications suggest that the T/Y transition, like other late spectral class transitions, may trace significant changes in atmospheric chemistry as well as declining temperatures.
References
- Ackerman & Marley (2001) Ackerman, A. S., & Marley, M. S. 2001, ApJ, 556, 872
- Artigau et al. (2010) Artigau, É., Radigan, J., Folkes, S., Jayawardhana, R., Kurtev, R., Lafrenière, D., Doyon, R., & Borissova, J. 2010, ApJ, 718, L38
- Bate (2009) Bate, M. R. 2009, MNRAS, 392, 590
- Becklin & Zuckerman (1988) Becklin, E. E., & Zuckerman, B. 1988, Nature, 336, 656
- Burgasser (2004) Burgasser, A. J. 2004, ApJS, 155, 191
- Burgasser (2007) —. 2007, ApJ, 659, 655
- Burgasser et al. (2006a) Burgasser, A. J., Geballe, T. R., Leggett, S. K., Kirkpatrick, J. D., & Golimowski, D. A. 2006a, ApJ, 637, 1067
- Burgasser et al. (2002a) Burgasser, A. J., Kirkpatrick, J. D., Brown, M. E., Reid, I. N., Burrows, A., Liebert, J., Matthews, K., Gizis, J. E., Dahn, C. C., Monet, D. G., Cutri, R. M., & Skrutskie, M. F. 2002a, ApJ, 564, 421
- Burgasser et al. (2006b) Burgasser, A. J., Kirkpatrick, J. D., Cruz, K. L., Reid, I. N., Leggett, S. K., Liebert, J., Burrows, A., & Brown, M. E. 2006b, ApJS, 166, 585
- Burgasser et al. (2002b) Burgasser, A. J., Marley, M. S., Ackerman, A. S., Saumon, D., Lodders, K., Dahn, C. C., Harris, H. C., & Kirkpatrick, J. D. 2002b, ApJ, 571, L151
- Burgasser et al. (2004) Burgasser, A. J., McElwain, M. W., Kirkpatrick, J. D., Cruz, K. L., Tinney, C. G., & Reid, I. N. 2004, AJ, 127, 2856
- Burningham et al. (2009) Burningham, B., et al. 2009, MNRAS, 395, 1237
- Burrows et al. (2003) Burrows, A., Sudarsky, D., & Lunine, J. I. 2003, ApJ, 596, 587
- Christensen et al. (2009) Christensen, U. R., Holzwarth, V., & Reiners, A. 2009, Nature, 457, 167
- Cooper et al. (2003) Cooper, C. S., Sudarsky, D., Milsom, J. A., Lunine, J. I., & Burrows, A. 2003, ApJ, 586, 1320
- Cushing et al. (2011) Cushing, M. C., Kirkpatrick, J. D., Gelino, C. R., Griffith, R. L., Skrutskie, M. F., Mainzer, A. K., Marsh, K. A., Beichman, C. A., Burgasser, A. J., Prato, L. A., Simcoe, R. A., Marley, M. S., Saumon, D., Freedman, R. S., Eisenhardt, P. R., & Wright, E. L. 2011, ArXiv e-prints, ApJ
- Cushing et al. (2004) Cushing, M. C., Vacca, W. D., & Rayner, J. T. 2004, PASP, 116, 362
- Delorme et al. (2008a) Delorme, P., Delfosse, X., Albert, L., Artigau, E., Forveille, T., Reylé, C., Allard, F., Homeier, D., Robin, A. C., Willott, C. J., Liu, M. C., & Dupuy, T. J. 2008a, A&A, 482, 961
- Delorme et al. (2008b) Delorme, P., Willott, C. J., Forveille, T., Delfosse, X., Reylé, C., Bertin, E., Albert, L., Artigau, E., Robin, A. C., Allard, F., Doyon, R., & Hill, G. J. 2008b, A&A, 484, 469
- Dupuy et al. (2009) Dupuy, T. J., Liu, M. C., & Ireland, M. J. 2009, ApJ, 692, 729
- Freedman et al. (2008) Freedman, R. S., Marley, M. S., & Lodders, K. 2008, ApJS, 174, 504
- Gelino et al. (2011) Gelino, C. R., Kirkpatrick, J. D., Cushing, M. C., Eisenhardt, P. R., Griffith, R. L., Mainzer, A. K., Marsh, K. A., Skrutskie, M. F., & Wright, E. L. 2011, AJ, 142, 57
- Gelino et al. (2002) Gelino, C. R., Marley, M. S., Holtzman, J. A., Ackerman, A. S., & Lodders, K. 2002, ApJ, 577, 433
- Gizis et al. (2000) Gizis, J. E., Monet, D. G., Reid, I. N., Kirkpatrick, J. D., Liebert, J., & Williams, R. J. 2000, AJ, 120, 1085
- Goldman et al. (2010) Goldman, B., Marsat, S., Henning, T., Clemens, C., & Greiner, J. 2010, MNRAS, 405, 1140
- Griffith & Yelle (1999) Griffith, C. A., & Yelle, R. V. 1999, ApJ, 519, L85
- Helling et al. (2008) Helling, C., Dehn, M., Woitke, P., & Hauschildt, P. H. 2008, ApJ, 675, L105
- Henry et al. (2006) Henry, T. J., Jao, W.-C., Subasavage, J. P., Beaulieu, T. D., Ianna, P. A., Costa, E., & Méndez, R. A. 2006, AJ, 132, 2360
- Kirkpatrick (2005) Kirkpatrick, J. D. 2005, ARA&A, 43, 195
- Kirkpatrick et al. (2011) Kirkpatrick, J. D., Cushing, M. C., Gelino, C. R., Griffith, R. L., Skrutskie, M. F., Marsh, K. A., Wright, E. L., Mainzer, A. K., Eisenhardt, P. R., McLean, I. S., Thompson, M. A., Bauer, J. M., Benford, D. J., Bridge, C. R., Lake, S. E., Petty, S. M., Stanford, S. A., Tsai, C.-W., Bailey, V., Beichman, C. A., Bochanski, J. J., Burgasser, A. J., Capak, P. L., Cruz, K. L., Hinz, P. M., Kartaltepe, J. S., Knox, R. P., Manohar, S., Masters, D., Morales-Calderon, M., Prato, L. A., Rodigas, T. J., Salvato, M., Schurr, S. D., Scoville, N. Z., Simcoe, R. A., Stapelfeldt, K. R., Stern, D., Stock, N. D., & Vacca, W. D. 2011, ApJS, in press
- Knapp et al. (2004) Knapp, G. R., Leggett, S. K., Fan, X., Marley, M. S., Geballe, T. R., Golimowski, D. A., Finkbeiner, D., Gunn, J. E., Hennawi, J., Ivezić, Z., Lupton, R. H., Schlegel, D. J., Strauss, M. A., Tsvetanov, Z. I., Chiu, K., Hoversten, E. A., Glazebrook, K., Zheng, W., Hendrickson, M., Williams, C. C., Uomoto, A., Vrba, F. J., Henden, A. A., Luginbuhl, C. B., Guetter, H. H., Munn, J. A., Canzian, B., Schneider, D. P., & Brinkmann, J. 2004, AJ, 127, 3553
- Konopacky et al. (2010) Konopacky, Q. M., Ghez, A. M., Barman, T. S., Rice, E. L., Bailey, J. I., White, R. J., McLean, I. S., & Duchêne, G. 2010, ApJ, 711, 1087
- Krabbe et al. (2004) Krabbe, A., Gasaway, T., Song, I., Iserlohe, C., Weiss, J., Larkin, J. E., Barczys, M., & Lafreniere, D. 2004, in Presented at the Society of Photo-Optical Instrumentation Engineers (SPIE) Conference, Vol. 5492, Society of Photo-Optical Instrumentation Engineers (SPIE) Conference Series, ed. A. F. M. Moorwood & M. Iye, 1403–1410
- Lane et al. (2001) Lane, B. F., Zapatero Osorio, M. R., Britton, M. C., Martín, E. L., & Kulkarni, S. R. 2001, ApJ, 560, 390
- Larkin et al. (2006) Larkin, J., Barczys, M., Krabbe, A., Adkins, S., Aliado, T., Amico, P., Brims, G., Campbell, R., Canfield, J., Gasaway, T., Honey, A., Iserlohe, C., Johnson, C., Kress, E., LaFreniere, D., Lyke, J., Magnone, K., Magnone, N., McElwain, M., Moon, J., Quirrenbach, A., Skulason, G., Song, I., Spencer, M., Weiss, J., & Wright, S. 2006, in Presented at the Society of Photo-Optical Instrumentation Engineers (SPIE) Conference, Vol. 6269, Society of Photo-Optical Instrumentation Engineers (SPIE) Conference Series
- Lawrence et al. (2007) Lawrence, A., et al. 2007, MNRAS, 379, 1599
- Leggett et al. (2010) Leggett, S. K., Burningham, B., Saumon, D., Marley, M. S., Warren, S. J., Smart, R. L., Jones, H. R. A., Lucas, P. W., Pinfield, D. J., & Tamura, M. 2010, ApJ, 710, 1627
- Leggett et al. (2007) Leggett, S. K., Marley, M. S., Freedman, R., Saumon, D., Liu, M. C., Geballe, T. R., Golimowski, D. A., & Stephens, D. C. 2007, ApJ, 667, 537
- Liu et al. (2011) Liu, M. C., Delorme, P., Dupuy, T. J., Bowler, B. P., Albert, L., Artigau, E., Reyle, C., Forveille, T., & Delfosse, X. 2011, ArXiv e-prints
- Liu et al. (2006) Liu, M. C., Leggett, S. K., Golimowski, D. A., Chiu, K., Fan, X., Geballe, T. R., Schneider, D. P., & Brinkmann, J. 2006, ApJ, 647, 1393
- Lodders (1999) Lodders, K. 1999, ApJ, 519, 793
- Lodders & Fegley (2006) Lodders, K., & Fegley, Jr., B. 2006, Chemistry of Low Mass Substellar Objects (Astrophysics Update 2), 1
- Looper et al. (2008) Looper, D. L., Gelino, C. R., Burgasser, A. J., & Kirkpatrick, J. D. 2008, ApJ, 685, 1183
- Lucas et al. (2010) Lucas, P. W., Tinney, C. G., Burningham, B., Leggett, S. K., Pinfield, D. J., Smart, R., Jones, H. R. A., Marocco, F., Barber, R. J., Yurchenko, S. N., Tennyson, J., Ishii, M., Tamura, M., Day-Jones, A. C., Adamson, A., Allard, F., & Homeier, D. 2010, MNRAS, 408, L56
- Luhman et al. (2011) Luhman, K. L., Burgasser, A. J., & Bochanski, J. J. 2011, ApJ, 730, L9
- Mainzer et al. (2011) Mainzer, A., Cushing, M. C., Skrutskie, M., Gelino, C. R., Kirkpatrick, J. D., Jarrett, T., Masci, F., Marley, M. S., Saumon, D., Wright, E., Beaton, R., Dietrich, M., Eisenhardt, P., Garnavich, P., Kuhn, O., Leisawitz, D., Marsh, K., McLean, I., Padgett, D., & Rueff, K. 2011, ApJ, 726, 30
- Marocco et al. (2010) Marocco, F., Smart, R. L., Jones, H. R. A., Burningham, B., Lattanzi, M. G., Leggett, S. K., Lucas, P. W., Tinney, C. G., Adamson, A., Evans, D. W., Lodieu, N., Murray, D. N., Pinfield, D. J., & Tamura, M. 2010, A&A, 524, A38
- McCaughrean et al. (2004) McCaughrean, M. J., Close, L. M., Scholz, R.-D., Lenzen, R., Biller, B., Brandner, W., Hartung, M., & Lodieu, N. 2004, A&A, 413, 1029
- Metchev et al. (2008) Metchev, S. A., Kirkpatrick, J. D., Berriman, G. B., & Looper, D. 2008, ApJ, 676, 1281
- Mohanty et al. (2002) Mohanty, S., Basri, G., Shu, F., Allard, F., & Chabrier, G. 2002, ApJ, 571, 469
- Monet et al. (2003) Monet, D. G., Levine, S. E., Canzian, B., Ables, H. D., Bird, A. R., Dahn, C. C., Guetter, H. H., Harris, H. C., Henden, A. A., Leggett, S. K., Levison, H. F., Luginbuhl, C. B., Martini, J., Monet, A. K. B., Munn, J. A., Pier, J. R., Rhodes, A. R., Riepe, B., Sell, S., Stone, R. C., Vrba, F. J., Walker, R. L., Westerhout, G., Brucato, R. J., Reid, I. N., Schoening, W., Hartley, M., Read, M. A., & Tritton, S. B. 2003, AJ, 125, 984
- Nakajima et al. (1995) Nakajima, T., Oppenheimer, B. R., Kulkarni, S. R., Golimowski, D. A., Matthews, K., & Durrance, S. T. 1995, Nature, 378, 463
- Noll et al. (1997) Noll, K. S., Geballe, T. R., & Marley, M. S. 1997, ApJ, 489, L87
- Pravdo et al. (2006) Pravdo, S. H., Shaklan, S. B., Wiktorowicz, S. J., Kulkarni, S., Lloyd, J. P., Martinache, F., Tuthill, P. G., & Ireland, M. J. 2006, ApJ, 649, 389
- Saumon et al. (2006) Saumon, D., Marley, M. S., Cushing, M. C., Leggett, S. K., Roellig, T. L., Lodders, K., & Freedman, R. S. 2006, ApJ, 647, 552
- Scholz (2010) Scholz, R. 2010, A&A, 510, L8
- Stassun et al. (2006) Stassun, K. G., Mathieu, R. D., & Valenti, J. A. 2006, Nature, 440, 311
- Tinney et al. (2003) Tinney, C. G., Burgasser, A. J., & Kirkpatrick, J. D. 2003, AJ, 126, 975
- Tsuji (2005) Tsuji, T. 2005, ApJ, 621, 1033
- Tsuji et al. (1996) Tsuji, T., Ohnaka, K., Aoki, W., & Nakajima, T. 1996, A&A, 308, L29
- Vacca et al. (2003) Vacca, W. D., Cushing, M. C., & Rayner, J. T. 2003, PASP, 115, 389
- van Dam et al. (2006) van Dam, M. A., et al. 2006, PASP, 118, 310
- Vrba et al. (2004) Vrba, F. J., Henden, A. A., Luginbuhl, C. B., Guetter, H. H., Munn, J. A., Canzian, B., Burgasser, A. J., Kirkpatrick, J. D., Fan, X., Geballe, T. R., Golimowski, D. A., Knapp, G. R., Leggett, S. K., Schneider, D. P., & Brinkmann, J. 2004, AJ, 127, 2948
- West et al. (2004) West, A. A., Hawley, S. L., Walkowicz, L. M., Covey, K. R., Silvestri, N. M., Raymond, S. N., Harris, H. C., Munn, J. A., McGehee, P. M., Ivezić, Ž., & Brinkmann, J. 2004, AJ, 128, 426
- Wizinowich et al. (2006) Wizinowich, P. L., et al. 2006, PASP, 118, 297
- Wright et al. (2010) Wright, E. L., Eisenhardt, P. R. M., Mainzer, A. K., Ressler, M. E., Cutri, R. M., Jarrett, T., Kirkpatrick, J. D., Padgett, D., McMillan, R. S., Skrutskie, M., Stanford, S. A., Cohen, M., Walker, R. G., Mather, J. C., Leisawitz, D., Gautier, T. N., McLean, I., Benford, D., Lonsdale, C. J., Blain, A., Mendez, B., Irace, W. R., Duval, V., Liu, F., Royer, D., Heinrichsen, I., Howard, J., Shannon, M., Kendall, M., Walsh, A. L., Larsen, M., Cardon, J. G., Schick, S., Schwalm, M., Abid, M., Fabinsky, B., Naes, L., & Tsai, C. 2010, AJ, 140, 1868
- Yamamura et al. (2010) Yamamura, I., Tsuji, T., & Tanabé, T. 2010, ApJ, 722, 682
- Zapatero Osorio et al. (2004) Zapatero Osorio, M. R., Lane, B. F., Pavlenko, Y., Martín, E. L., Britton, M., & Kulkarni, S. R. 2004, ApJ, 615, 958