Fe K line complex in the nuclear region of NGC 253 (catalog )
Abstract
A bright, nearby edge-on starburst galaxy NGC 253 (catalog ) was studied using the Suzaku, XMM and Chandra X-ray observatories. We detected with Suzaku and XMM complex line structure of Fe K, which is resolved into three lines (Fe I at 6.4 keV, Fe XXV at 6.7 keV and Fe XXVI at 7.0 keV) around the center of NGC 253 (catalog ). Especially, the Fe I and Fe XXVI lines are the first clear detections, with a significance of 99.99 % and 99.89 % estimated by a Monte Carlo procedure. Imaging spectroscopy with Chandra revealed that the emission is distributed in 60 arcsec2 region around the nucleus, which suggests that the source is not only the buried AGN. The flux of highly ionized Fe lines can be explained by the accumulation of 10–1000 supernova remnants that are the result of high starforming activity, while the Fe I line flux is consistent with the fluorescent line emission expected with the molecular clouds in the region.
Subject headings:
galaxies: individual (NGC 253 (catalog )) — galaxies: ISM — galaxies: starburst — galaxies: star formation — X-rays: galaxies1. Introduction
X-ray emission from the central region of a starburst galaxy is known to be complex because of blending of various kinds of point sources and diffuse emission. Although point source emission typically dominates the hard band, in some starburst galaxies including NGC 253 (catalog ), the emission line from He-like Fe XXV is observed, suggesting the existence of a high temperature plasma (e.g. Pietsch et al., 2001; Boller et al., 2003; Ranalli et al., 2008). Supernova remnants (SNRs), associated with starburst activity, are considered to be a candidate of the origin. Moreover, two of the galaxies (NGC6240 and M82) exhibit Fe I fluorescent line (Boller et al., 2003; Strickland & Heckman, 2007). The coexistence of highly ionized and neutral Fe lines suggests the coexistence of hot and cold gases. Thus, this complex Fe K line structure is informative on the origin of the emission and the gas structure of starburst galaxies. The origin of the neutral line is, however, still poorly known.
NGC 253 (catalog ) is a nearby bright edge-on starburst galaxy with the star formation rate of 1.4–9.5 M⊙ yr-1 (Grimm et al., 2003). Its large apparent diameter makes it a suitable target to study the spacial distribution of emission features. Chandra suggested that the X-ray emission in the nuclear region is composed of a low-temperature thermal plasma and a heavily absorbed hard component that is expressed by a power law plus emission from a photoionized plasma emitting Fe IV-Fe XV and Fe XXV (Weaver et al., 2002). The hard component is interpreted as a buried AGN (Müller-Sánchez et al., 2010). The spectrum around the nuclear region could be modeled with three-temperature thin thermal plasmas including a high (6 keV) temperature plasma responsible for the Fe XXV line (Pietsch et al., 2001).
In this Letter, we report on the study of the nuclear region of NGC 253 (catalog ) using Suzaku and Chandra, with a particular focus on the Fe line complex. Suzaku has a good energy resolution to resolve the Fe line complex with a low background, while a sub-arcsecond spatial resolution of Chandra enables us to argue spatial distribution. We also show results by XMM-Newton as a complementary analysis. Throughout this paper, we adopt the distance to NGC 253 (catalog ) of 3.4 Mpc (Dalcanton et al., 2009) corresponding to 16 pc arcsec-1. We assume the solar abundance tabulated by Anders & Grevesse (1989). HEAsoft version 6.11, SAS 10.0.0, CIAO 4.3 and XSPEC 12.7.0 were used for data reduction and spectral analysis. For all fitting processes, we adopted C statistics and binned spectra so that each bin contains counts after a background subtraction. We quote an error as a 90 % significance level of a single parameter in all tables, determined by Monte Carlo simulations and most of errors are consistent with those obtained by C-statistic of 2.7.
2. Observations & Data Reduction
NGC 253 (catalog ) was observed by Suzaku (seq:805018010) with an exposure time of 101 ks. We analyzed only XIS-FI (XIS0 and XIS3), which has a lower background than XIS-BI (XIS1) at to avoid a systematic uncertainty associated with a simultaneous fitting of different sensors. The redistribution matrix files (RMFs) and ancillary response files (ARFs) were created with the xisrmfgen and xissimarfgen ftools (Ishisaki et al., 2007), respectively. Since the bright region is within several tens of arcseconds, which is much smaller than the Suzaku point spread function (PSF; as a half-power diameter), we assume the source to be a point-source when creating the arf files. The accumulation of dark Earth observations was used to estimate the non X-ray background (NXB) spectra, via the xisnxbgen ftool (Tawa et al., 2008). We subtracted NXB, the dominant background above 5 keV, but not the X-ray background, which was evaluated by an offset observation next to our field as to be less than 3 % of the flux in R0. The spectra and responses of XIS0 and XIS3 were merged using the ftools mathpha, marfrmf and addrmf.
We utilized PN data from two XMM observations (ObsID:0125960101 and 0152020101) with the effective exposure time of 31 and 54 ksec after removing flared time intervals which is over 0.35 counts/sec above 10 keV. RMS and ARF files were made by the SAS rmfgen and arfgen tools. We extracted the background from a source-free region.
The object was also observed by Chandra three times with the net exposure time of 14 ks (seq:600114), 44 ks (seq:600093) and 83 ks (seq:600305), respectively. We analyzed the level 2 Chandra ACIS-S event data. We used the merged data of three observations without any good-time-interval filtering because the background count rate is always 6.5 % of the source in 5.0–8.0 keV. RMFs and ARFs were created using the CIAO mkacisrmf and mkwarf tools. We extracted the background from a source-free region.
3. Analysis & Results
3.1. Neutral, He-like and H-like Fe K lines with Suzaku and XMM
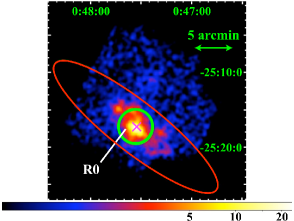
Spectra taken with Suzaku were extracted from a circular region with a radius of , indicated as R0 in Figure 1 left. The center of R0 corresponds to the peak position of the Suzaku 4.0–10.0 keV image. The size of R0 was optimized to realize the largest number of photons avoiding other disk-origin components and anomaly columns in the XIS0 detector below the nuclear region.
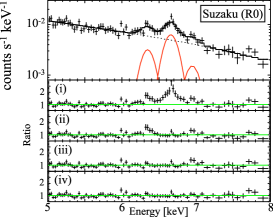
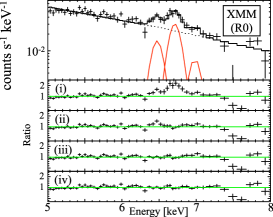
As shown in Figure 2 left, complex Fe K line structure was detected from the Suzaku spectrum as large residuals to a power-law continuum model. The continuum was determined in 5.0–8.0 keV but excluding 6.3–7.1 keV to avoid Fe K emission lines. We added Gaussian emission line models one by one. The line width was fixed to 0. Fitting was significantly improved by each step. The best-fit line center, equivalent width (EW), and flux, along with their errors are summarized in Table 1. We considered only the error of line flux in estimating the error of EW. A systematic error in flux due to PSF modeling is bracketed by comparing two arfs: one for a point source and one for a uniformly extended source. The difference, 10 , was smaller than the statistical error. Suzaku XIS achieved an energy scale accuracy better than 6 eV at 6 keV (Koyama et al., 2007), which means that the systematic error on the energy center is much smaller than the statistical error. The 3 acceptable range of the energy center of the lowest-energy line from our Suzaku observation is 6.29-6.43 keV, which includes Fe I to Fe XVI (House, 1969). The most natural explanation of the line is the neutral fluorescent line. We therefore interpreted the line as Fe I, although Weaver et al. (2002) indicated that it could be emission from low ionization-state ions (Fe IV-Fe XV).
We employed the Monte Carlo procedure described in Buote et al. (2009) to calculate a significance of these lines. In this process, we evaluated the reduction in the C-statistic (29.9 for Fe I and 11.4 for Fe XXVI) after adding a line with the energy center range restricted to 6.3–6.5 keV for the Fe I line and 6.87–7.07 keV for the Fe XXVI line. The two lines were added individually. We conducted 10000 Monte Carlo simulations without Fe I and Fe XXVI lines with the same exposure and binning as the observation. The fraction of simulation that improved the C-statistic by 29.9 and 11.4 are 0 and , respectively. Therefore the significance of the detection of Fe I and Fe XXVI are 99.99 % and 99.89 %, respectively. This is the first clear detection of the Fe I and Fe XXVI lines in NGC 253 (catalog ).
We also extracted a spectrum from R0 by XMM as a complementary analysis. We found the same complex Fe K lines as shown in Figure 2 middle and we confirmed that resultant parameters are almost consistent with those of Suzaku which are summarized in Table 1.
| Region | neutral Fe | Fe XXV | Fe XXVI | |
|---|---|---|---|---|
| Suzaku | ||||
| Energy (keV) ∗ | 6.360.03 | 6.670.02 | 6.96 | |
| R0 | Flux † | 3.8 | 8.4 | 2.3 |
| EW (eV) | 84 | 220 | 60 | |
| XMM | ||||
| Energy (keV) ∗ | 6.490.02 | 6.720.01 | 6.990.03 | |
| R0 | Flux † | 3.8 | 8.00.9 | 2.1 |
| EW (eV) | 77 | 18921 | 52 | |
| Chandra | ||||
| Energy (keV) ∗ | 6.40 (fix) | 6.66 | 6.97 (fix) | |
| R1 | Flux † | 0.9 | 2.11.2 | 1.1 |
| EW (eV) | 33 | 253145 | 91 | |
| Energy (keV) ∗ | 6.45 | 6.64 | 6.97 (fix) | |
| R2 | Flux † | 1.21.1 | 4.8 | 0.8 |
| EW (eV) | 8679 | 617 | 59 | |
| Energy (keV) ∗ | 6.43 | 6.64 | 6.95 | |
| R1+R2 | Flux † | 1.7 | 7.1 | 1.71.2s |
| EW (eV) | 75 | 427 | 8258 | |
| Energy (keV) ∗ | 6.46 | 6.650.04 | 6.97 (fix) | |
| P1 | Flux † | 0.8 | 1.9 | 0.9 |
| EW (eV) | 176 | 662 | 73 | |
∗ Energy center at the rest frame.
† Photon flux in the unit of 10-6 photons s-1 cm-2.
3.2. Spectral Analysis with Chandra
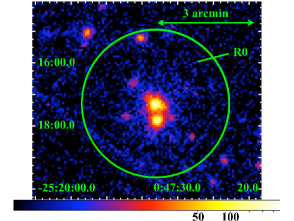
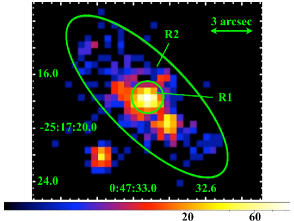
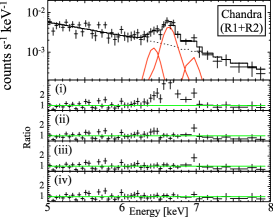
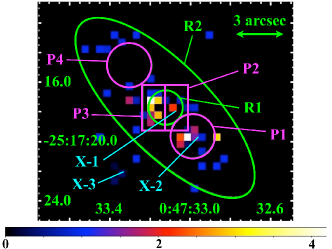
We utilized Chandra, characterized by a sub-arcsecond angular resolution, for determining the emission region of the Fe K lines. From a Chandra image, we see that most of the emission above 4 keV is concentrated in area (Figure 1 right). We divided the compact area into two regions, R1 and R2, as indicated in Figure 1 right to examine whether the emission lines are associated with the AGN. R1 is a circlular region of a radius of whose center is the peak of 4–10 keV surface brightness. The buried AGN is located in R1 (Müller-Sánchez et al., 2010). R2 is an ellipse with the major and minor axes of and , respectively, but excluding R1. First, we extracted the spectrum from the whole (R1 + R2) region. The spectrum around the Fe K line complex is shown in Figure 2 right. We performed the same analysis as we did with the Suzaku data. The results are summarized in Table 1. Flux of Fe XXV and Fe XXVI are consistent among three observatories to within statistical errors, which suggests that these lines mostly originate from this compact region. On the other hand, the flux of Fe I observed with Suzaku and XMM is twice larger than that with Chandra. Hence, the neutral emission may be more extended than the ionized emission or variable. The smaller EWs of the Suzaku and XMM observations are because of a higher continuum due to the emission from the disk.
We also extracted the spectra from R1 and R2 to evaluate the contribution from the buried AGN. As is shown in Table 1, Fe I and Fe XXV lines are observed in the R2 region, while only an upper limit is obtained for Fe XXVI. The contribution to Fe I and Fe XXV is even larger in R2 than in R1. Thus the AGN is not the dominant source of the two lines and these emission lines are distributed over the (R1+R2) regions.
3.3. Imaging analysis with Chandra
As described above, the observed Fe K complex is unlikely to be explained by the AGN alone. In this section, we conducted imaging analysis to demonstrate the spacial distribution of this structure. Figure 3 shows the Chandra narrow band line flux image for the Fe XXV (6.6–6.8 keV) line. Contribution of the continuum was subtracted from the images in the following way. We simply assumed that the continuum above 5 keV is expressed by a single power-law with the same photon index (2.0) in the whole region. The contribution from the continuum in 6.6–6.8 keV is calculated pixel by pixel using the photon index and the counts in 5.0–6.0 keV, where no line feature exists. The assumption of a uniform photon index is rather crude, because this can be applied for only the same spectrum properties. We also confirmed that the following results did not change with different assumption of photon indices (1.0 and 4.0). In R1, a heavily absorbed non thermal component from the buried AGN instead of a high temperature plasma dominates the hard band above 3 keV. Despite poor statistics, the map suggests that the line emission is not concentrated in R1, i.e., the location of the buried AGN. In contrast, two bright regions of Fe XXV line are found in P1 and P3 defined in Figure 3.
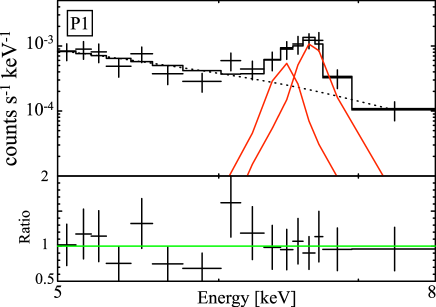
We also extracted the line flux image for the neutral Fe K line. However, the statistics are too poor to do any analysis. Hence we focus on the Fe XXV. To confirm the strong line emission in P1 and P3, we extracted spectra from four regions as indicated in Figure 3 denoted as P1, P2, P3 and P4. P1 and P4 are circles with a radius of 1′′.5 while P2 and P3 are rectangles of 1′′.5 3′′. P1 and P3 include the peak position while P2 and P4 are selected from darker areas for comparisons. P1 shows a strong line feature, while no line feature is found in P4. The resulting line fluxes in P1 are shown in Table 1. 50 % and 30 % of the observed total Fe I and Fe XXV lines are emitted only from P1 as shown in Figure 4 left. P2 and P3 have the same continuum flux but the resulting line flux of P3 for Fe XXV is twice larger than that of P2.
The coordinates of peak pixel centers in P1 and P3 are (, ) = (00h47m33s.20, 25∘17′17′′.2) and (00h47m33s.01, 25∘17′19′′.7), respectively. These are coincident with the peak positions of 1.3 mm continuum in the radio observation (Sakamoto et al., 2011) to within the position resolutions. The 99 % uncertainty of absolute X-ray position by Chandra is 0′′.8, while the beam size of the radio observation is 1′′.11′′.1. Thus, the Fe XXV line shows a clear association with the two peaks of molecular clouds. P1 is the most luminous in mid infrared and is suggested to be a super star cluster (Keto et al., 1999). P3 is the brightest in the 1.3 mm radio continuum and is featured by the water maser associated with star formation (e.g. Henkel et al., 2004).
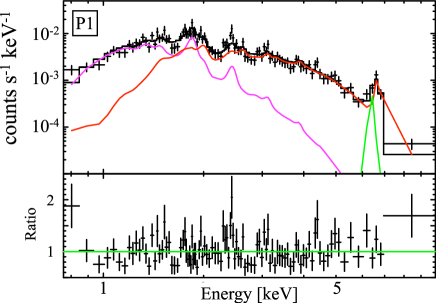
3.4. Wide-band Spectrum fitting of the P1 region
To extract physical parameters we fitted the wide-band spectra (0.8–10 keV) of P1, where the highest line flux was confirmed. We adopted two-temperature thermal plasmas in collisionally ionization equilibrium plus a Gaussian whose centroid is 6.4 keV as the neutral Fe K line. One plasma represents highly-ionized Si and S emission lines and the other makes up for continuum above 3 keV and the Fe XXV emission line. The spectrum with the best-fit model is plotted in Figure 4. The abundance is fixed at solar values. The spectrum is well represented with the . The temperature of the higher-temperature plasma is 2.5 keV. This plasma is responsible for the Fe XXV and Fe XXVI lines. The unabsorbed luminosity, thermal energy and total iron mass of the higher-temperature plasma are calculated to be (8.61038 , 5.41052 and 20 M⊙, respectively. The unabsorbed luminosities of the Fe I and Fe XXV lines in P1 are also calculated to be 1.2 and 2.71037 . Note that P1 has a radius of 24 pc and the spherical volume of 5.8104 pc3.
4. Origin of the emission lines
In this section, we discuss the origin of the neutral Fe I, ionized Fe XXV and Fe XXVI lines. This line structure likely extends to the R2 region, i.e., the central 8′′ corresponding to 130 pc in the nuclear region of NGC253 (catalog ). However, we focus on the very compact P1 region with a radius of 24 pc, which shows the most luminous line structure. We calculate the contribution from (i) point sources such as cataclysmic variables (CVs), active binaries and high-mass X-ray binaries (HMXBs), (ii) SNRs and (iii) cold molecular clouds. Candidate (i) would produce all three lines, while (ii) and (iii) would only be responsible for the ionized lines and the neutral lines, respectively.
4.1. Point sources
CVs and active binaries are bright point sources that emit Fe lines with typical luminosities of erg s-1 and erg s-1, respectively. The luminosity in P1 corresponds to sources, or a number density of 100–1000 pc-3. We can also estimate the number density from line flux of CVs which are relatively luminous compared to active binaries. The typical luminosity of the Fe I line is on the order of 1029-30 (Ezuka & Ishida, 1999), which leads to the large number 107-8 sources and a number density of 500–5000 pc-3. The number density of CVs and active binaries are both pc-3 in the Galaxy (e.g. Rogel et al., 2008; Favata et al., 1995). Even at Galactic center, the expected number density of CVs is on the order of pc-3, assuming that their number density can be scaled from the stellar density (Muno et al., 2003). Therefore the contribution of these point sources seems low. HMXBs are also one of candidates with typical luminosity of 1033-34 for Fe I fluorescent line (Torrejón et al., 2010). This corresponds to 103-4 HMXBs or pc-3 in P1. Considering the number of HMXBs in the Galaxy (100), contribution of HMXBs also seems low, unless extreme number of HMXBs and any other point sources such as black hole candidates are produced by star forming activity, or population of undetected obscured HMXBs (Walter et al., 2006) is much larger.
4.2. SNRs
Supernova remnants (SNRs) likely make the biggest contribution as a diffuse plasma. The luminosity and thermal energy of young or middle-aged SNRs which contribute to highly-ionized Fe lines in LMC are and , respectively (Hughes et al., 1998). Both the luminosity and thermal energy of the higher-temperature plasma of NGC253 (catalog ) correspond to about 100–1000 and 10–100 young or middle-aged SNRs, respectively. We also estimated the number of SNRs using the observed Fe mass (202 M⊙) and Fe mass ejection per one Type II SN (8.410-2 M⊙; Iwamoto et al., 1999). The resultant number of SNRs is about 24020 which is consistent with the estimated value by the luminosity. This suggests that the very dense massive star cluster in P1 exists, which is consistent with the results of the mid infrared observations.
4.3. Molecular clouds
Molecular clouds that are irradiated by surrounding X-ray sources would emit a fluorescent Fe I line. We assume that the incident X-ray is photoelectrically absorbed by the molecular gas that subtends an angle seen from the continuum source. The line flux of the Fe I K line can be estimated as
| (1) |
where , , and indicate the fluorescence yield of Fe I K line (), the density of the molecular gas, the photoelectric cross section, and the X-ray source intensity, respectively. Assuming a thermal bremsstrahlung spectrum for the continuum source, the X-ray source intensity, , can be determined in the 6.0–7.5 keV band. The Fe column density is written as , where and represent the elemental abundance of iron to hydrogen and the column density of the required molecular gas, respectively. The photoelectric cross section of Fe above 7.1 keV is approximated as cm2 as described in Nobukawa et al. (2008). Substituting these values, we obtain
| (2) |
The solid angle corresponds to the case that the X-ray sources are distributed entirely behind the molecular gas. This column density was consistent with the molecular clouds observed in the radio observation (Sakamoto et al., 2011) to within the statistical errors. Thus, the observed Fe I line flux is explained by the emission from the NGC253 (catalog ) nucleus and the dense molecular clouds in the nuclear region.
5. Conclusions
Suzaku and XMM observations revealed complex Fe K line structure in the nuclear region of NGC 253 (catalog ) and resolved it into Fe I, Fe XXV and Fe XXVI lines. Chandra demonstrated that the emission is concentrated mostly in the 60 arcsec2 nuclear region, but is not localized at the position of a buried AGN. The Fe XXV line shows an association with molecular clouds. The complex Fe K line can be explained by a combination of 10–1000 SNRs and a fluorescent line from molecular clouds ().
References
- Anders & Grevesse (1989) Anders, E., & Grevesse, N. 1989, gca, 53, 197
- Boller et al. (2003) Boller, T., Keil, R., Hasinger, G., Costantini, E., Fujimoto, R., Anabuki, N., Lehmann, I., & Gallo, L. 2003, A&A, 411, 63
- Buote et al. (2009) Buote, D. A., Zappacosta, L., Fang, T., Humphrey, P. J., Gastaldello, F., & Tagliaferri, G. 2009, ApJ, 695, 1351
- Dalcanton et al. (2009) Dalcanton, J. J., et al. 2009, ApJS, 183, 67
- Ezuka & Ishida (1999) Ezuka, H., & Ishida, M. 1999, ApJS, 120, 277
- Favata et al. (1995) Favata, F., Micela, G., & Sciortino, S. 1995, A&A, 298, 482
- Grimm et al. (2003) Grimm, H.-J., Gilfanov, M., & Sunyaev, R. 2003, MNRAS, 339, 793
- Henkel et al. (2004) Henkel, C., Tarchi, A., Menten, K. M., & Peck, A. B. 2004, A&A, 414, 117
- House (1969) House, L. L. 1969, ApJS, 18, 21
- Hughes et al. (1998) Hughes, J. P., Hayashi, I., & Koyama, K. 1998, ApJ, 505, 732
- Ishisaki et al. (2007) Ishisaki, Y., et al. 2007, PASJ, 59, 113
- Iwamoto et al. (1999) Iwamoto, K., Brachwitz, F., Nomoto, K., Kishimoto, N., Umeda, H., Hix, W. R., & Thielemann, F.-K. 1999, ApJS, 125, 439
- Keto et al. (1999) Keto, E., Hora, J. L., Fazio, G. G., Hoffmann, W., & Deutsch, L. 1999, ApJ, 518, 183
- Koyama et al. (2007) Koyama, K., et al. 2007, PASJ, 59, 23
- Müller-Sánchez et al. (2010) Müller-Sánchez, F., González-Martín, O., Fernández-Ontiveros, J. A., Acosta-Pulido, J. A., & Prieto, M. A. 2010, ApJ, 716, 1166
- Muno et al. (2003) Muno, M. P., et al. 2003, ApJ, 589, 225
- Nobukawa et al. (2008) Nobukawa, M., et al. 2008, PASJ, 60, 191
- Pietsch et al. (2001) Pietsch, W., et al. 2001, A&A, 365, L174
- Ranalli et al. (2008) Ranalli, P., Comastri, A., Origlia, L., & Maiolino, R. 2008, MNRAS, 386, 1464
- Rogel et al. (2008) Rogel, A. B., Cohn, H. N., & Lugger, P. M. 2008, ApJ, 675, 373
- Sakamoto et al. (2011) Sakamoto, K., Mao, R.-Q., Matsushita, S., Peck, A. B., Sawada, T., & Wiedner, M. C. 2011, ApJ, 735, 19
- Strickland & Heckman (2007) Strickland, D. K., & Heckman, T. M. 2007, ApJ, 658, 258
- Tawa et al. (2008) Tawa, N., et al. 2008, PASJ, 60, 11
- Torrejón et al. (2010) Torrejón, J. M., Schulz, N. S., Nowak, M. A., & Kallman, T. R. 2010, ApJ, 715, 947
- Walter et al. (2006) Walter, R., et al. 2006, A&A, 453, 133
- Weaver et al. (2002) Weaver, K. A., Heckman, T. M., Strickland, D. K., & Dahlem, M. 2002, ApJ, 576, L19