Extragalactic point source detection in WMAP 7-year data at 61 and 94 GHz
Abstract
The detection of point sources in Cosmic Microwave Background maps is usually based on a single-frequency approach, whereby maps at each frequency are filtered separately and the spectral information on the sources is derived combining the results at the different frequencies. On the contrary, in the case of multi-frequency detection methods, source detection and spectral information are tightly interconnected in order to increase the source detection efficiency.
In this work we apply the matched multifilter method to the detection of point sources in the WMAP 7yr data at 61 and 94 GHz. This linear filtering technique takes into account the spatial and the cross-power spectrum information at the same time using the spectral behaviour of the sources without making any a priori assumption about it. We follow a two-step approach. First, we do a blind detection of the sources over the whole sky. Second, we do a refined local analysis at their positions to improve the signal-to-noise ratio of the detections. At 94 GHz we detect 129 objects at (excluding the Large Magellanic Cloud region); 119 of them are reliable extragalactic sources and 104 of these 119 lie outside the WMAP Point Source Catalog mask. Nine of the total 129 detections are known Galactic sources or lie in regions of intense Galactic emission and one additional (weak) high-Galactic latitude source has no counterpart in low-frequency radio catalogues. Our results constitute a substantial improvement over the NEWPS-3year catalogue.
keywords:
methods: data analysis – techniques: image processing – radio continuum: galaxies – cosmic microwave background – surveys1 Introduction
The study of the Cosmic Microwave Background (CMB) provides a very useful tool to understand the Universe and its evolution. A proper analysis of this primordial radiation allows us to discriminate between different evolutionary models of the Universe. Different experiments have taken data with different observing conditions (i.e. resolutions, frequencies, fields of view, …) in order to improve our comprehension of this radiation and, therefore, of the Universe. The excellent sensitivities of modern instruments, close to fundamental limits, imply that our ability to accurately measure the CMB temperature anisotropies is limited by the contamination of CMB maps by astrophysical emissions (foregrounds). For this reason, many techniques have been developed in order to separate the different components that one can find in the maps. While on moderate to large angular scales the main contaminants are diffuse Galactic emissions, extragalactic point sources dominate on small angular scales both in temperature (Toffolatti et al., 1998; De Zotti et al., 1999; Hobson et al., 1999; De Zotti et al., 2005) and in polarisation (Tucci et al., 2004; Tucci et al., 2005; López-Caniego et al., 2009; Argüeso et al., 2011a).
Astrophysical foregrounds can be both a disturbance for CMB studies and interesting per se. The WMAP surveys have made possible to investigate for the first time the statistical properties of bright radio sources above GHz over the whole sky (Bennett et al., 2003; Hinshaw et al., 2007; López-Caniego et al., 2007; Chen & Wright, 2008; González-Nuevo et al., 2008; Massardi et al., 2009; Wright et al., 2009; Gold et al., 2011). The first Planck results (Planck Collaboration et al., 2011a) have already offered the possibility of extending the study to higher frequencies and fainter flux densities (Planck Collaboration et al., 2011b).
There is a rich literature on methods to extract compact sources from CMB maps (see Herranz & Vielva, 2010, for a recent review). Successful techniques exploit a variety of tools: wavelets (Vielva et al., 2001; Vielva et al., 2003; González-Nuevo et al., 2006; Sanz et al., 2006; López-Caniego et al., 2007), matched filters (Vikhlinin et al., 1995; Tegmark & de Oliveira-Costa, 1998; Barreiro et al., 2003; López-Caniego et al., 2006) and other linear filtering tools (Sanz et al., 2001; Chiang et al., 2002; Herranz et al., 2002a; López-Caniego et al., 2004, 2005a, 2005b). Usually these methods filter maps at each frequency separately. In addition, Bayesian techniques that include prior information about the distribution of the sources have been proposed in the literature (Hobson & McLachlan, 2003; Carvalho et al., 2009; Argüeso et al., 2011b).
Although single-frequency filtering techniques have been remarkably successful, a multi-frequency approach allows us to take advantage of additional information such as the cross-power spectrum of the noise. This makes possible to improve the significance of sources seen at different frequencies but with relatively low signal-to-noise ratio in each frequency channel without any a priori assumption on their spectral properties. However, multi-frequency detection of point sources in CMB maps is still a poorly explored field. Herranz & Sanz (2008) introduced the matrix filters technique (MTXF) as the first fully multi-frequency, non-parametric, linear filtering technique that is able to find point sources and to do unbiased estimations of their flux densities. The MTXF technique exploits the distinctive spatial behaviour of these sources without assuming any specific spectral behaviour. Herranz et al. (2009) applied the MTXF to realistic simulations of the Planck radio channels, showing that it is possible to practically double the number of detections for some of the channels with respect to the single-frequency matched filter approach for a fixed reliability level.
The MTXF approach exploits the multi-frequency information only on the diffuse components (like CMB, Galactic emissions and noise). A more complete approach should take into account also the correlations among the different frequency maps due to point sources themselves. A step in this direction was done by Herranz et al. (2002b) who presented the matched multi-filter (MMF) method, a generalisation of the standard matched filter for multi-frequency data where the frequency dependence of the signal is known. This is the case for the thermal Sunyaev-Zel’dovich (SZ) effect (Sunyaev & Zeldovich, 1970, 1972), for which the method was originally developed and that has been used to build the Planck Early SZ catalog. Unfortunately this is not the case for extragalactic radio sources. However, Lanz et al. (2010) took advantage of an analogy between the SZ and the point source case. In the SZ case, the spectral behaviour of the sources is known but the size of the clusters is not. To deal with this, the size of the source is described, in the design of an MMF, by means of a free parameter, whose value is determined maximising the signal-to-noise ratio for each detected source (Herranz et al., 2002b). In the case of point sources, the angular profiles are known (they are given by the point spread functions, PSFs, of the instrument) and we only need to optimise a set of parameters describing the spectral shape.
In Lanz et al. (2010) the MMF was applied to realistic simulations of the Planck mission. The promising results obtained in that work prompted us to apply the method to real data, namely to the 7-yr WMAP data. More precisely, we have considered the V and W maps (61 and 94 GHz respectively), because at these frequencies the knowledge of the statistical properties of radio galaxies was poor. The structure of the article is as follows. In § 2 we briefly describe the method, and in § 3 the data used. In § 4 we present and discuss our results, comparing our flux density estimates with measurements with other instruments. Our main conclusions are summarised in § 5.
2 Method
The MMF is the optimal linear detection method when the spatial profile and the frequency dependence of the sources are known. By ‘optimal’ we mean, as it is common in statistics, that the estimation of the flux density of the sources is unbiased and has minimum variance (maximum efficiency). In Fourier space the MMF takes the form:
| (1) |
where is the Fourier mode, is the column vector of the filters , is the column vector , is the frequency dependence, is the source profile at each frequency and is the inverse matrix of the cross-power spectrum P. The MMF takes as arguments images (in this work ) and returns a single filtered image where the sources are optimally enhanced with respect to the noise. The variance of the output filtered image is given by:
| (2) |
If a source has a signal-to-noise ratio after the filtering, we say that we have a detection at that position.
Since we are dealing with point sources, the profiles are directly given by the PSFs of the instrument. The cross-power spectrum is not known a priori but can be inferred from the data under the assumption that the point sources are sparse. The unknown frequency dependence, , of a given source can be parametrised as:
| (3) |
where and are the flux densities at a frequency and at the frequency of reference . The spectral index is a free parameter. As pointed out by Lanz et al. (2010), each image is filtered several times for different MMFs. These MMFs are identical except for the spectral index . The test values of the spectral index used in this work are , with a step of 0.05. As it was shown in the cited work, the signal-to-noise (SNR) ratio of the detected source is maximal for the correct choice of this parameter, and by construction (we want an efficient estimator of the flux density of the source), the uncertainty assigned to the source is the square root of the variance expressed in eq. (2) for the correct value of . While the parametrisation of eq. (3) is perfectly adequate in our case, any other parametrisation, even a non-functional description of the vector by means of its components, could be used in other cases, e.g. when more than two frequencies are considered simultaneously.
3 Application to WMAP data
As mentioned above, the WMAP V and W bands are particularly interesting because only a small fraction of WMAP sources were detected with SNR in these bands. We have used an adapted version of the code described in López-Caniego et al. (2007), Massardi et al. (2009) and in López-Caniego et al. (2009), modified in order to handle two frequencies simultaneously and to accommodate our MMF filtering. The code reads in an input parameter file containing the specific characteristics of the maps to be analysed as well as the patch size, the pixel size and overlap among the patches to effectively cover the of the sky. Then, it reads in the two input maps in FITS format and extracts the patches to be analysed using the tangential plane approximation implemented in the CPAC library 111http://astro.ic.ac.uk/mortlock/cpack/. Each pair of V and W patches is analysed simultaneously using the MMF, and a first set of detections is produced. Next, the code iteratively explores different values of the spectral index for each source, allowing for the appearance of new possible detections. At the end, the code gathers all the candidates and generates a list of detections above a given SNR, converting the positions of the detected objects in the plane to the sphere. We have used flat patches of , each containing pixels. The pixel area is , corresponding to the HEALPix resolution parameter (see Górski et al. (2005) for more details). In total we have 371 patches, with significant overlaps among them in order to avoid as much as possible border effects. As described in Massardi et al. (2009), we perform a two-step process, first doing a blind search across the sky and then refining the analysis obtaining new patches centred at the positions of the sources identified in the blind step. In this way we further reduce any projection and border effect that we could have.
When dealing with the V and especially the W WMAP bands it is necessary to carefully characterise the properties of the beams, both to build the optimal filters (eq. 1) and to obtain a good photometry of the sources. WMAP beams, particularly at 94 GHz, are highly non-Gaussian and non circularly symmetric. We also need to take into account that for the W band the pixel size () is dangerously close to the minimum sampling of the FWHM required to avoid aliasing, and that real sources are not necessarily located at the geometrical centre of the pixels. We have dealt with these systematic effects in the following way.
We used the beam transfer functions (circularly symmetric) provided by WMAP222 lambda.gsfc.nasa.gov/product/map/dr4/beam_xfer_get.cfm to create high resolution templates of the beams (equivalent to the HEALPix ) projected into the tangent plane. Please note that the maps that we have used to perform our analysis have a pixel size corresponding to . In addition, we must consider that sources are not necessarily located at the geometrical centre of these pixels. Therefore, taking the beam transfer functions, we divided each pixel in subpixels () using the following formula:
| (4) |
where we obtained the value of the beam template in any angular position () from the beam transfer function using the Legendre polynomials. Then we averaged the high-resolution beams over all the possible displacements of the source centre inside a pixel. In order to obtain a well-estimated average of the beams, we repeated this process 5000 times. These averaged beam templates were then degraded to the same resolution of our maps (). In this way we take into account, on average, the effects of pixelisation and the possible offsets of the sources with respect to the geometrical centre of the pixel.
A careful correction for the non-circularity of the beams would require a detailed knowledge of the combination of beam orientations for all scans through every position in the sky. Since this information is not available to us, we only applied to the flux densities an average correction factor that takes into account the effective beam areas for each channel. The correction factors were obtained using the self-calibration method based on SExtractor (Bertin & Arnouts, 1996) AUTO photometry, described in González-Nuevo et al. (2008). In that work, the NEWPS 3yr sources detected above the level by SExtractor and with flux densities Jy were used for the self-calibration. Only 3 W-band sources satisfied these requirements and therefore the correction factor for this band could not be reliably estimated. To overcome this problem we have applied SExtractor to the W map at the positions of 296 sources observed by the Australia Telescope Compact Array (ATCA) and the Very Large Array (VLA). Fifteen of them were detected at by SExtractor. Since all the ATCA/VLA sources have been detected at a very high significance level, we were confident that there were no spurious detections in this sample. These sources were used to recalculate the effective beam area at 94 GHz. We obtained sr, to be compared with the nominal value of sr for the symmetrised beam. Note that all the ingredients described in this section must be introduced in the code before the filtering process.
| RA (∘) | Declination (∘) | (Jy/beam) | rms (Jy) | spectral index | Id in other catalogues |
|---|---|---|---|---|---|
| 13.237 | 56.576 | 2.86 | 0.22 | -1.25 | NGC 281 |
| 44.622 | -18.834 | 0.54 | 0.10 | -2.40 | |
| 52.264 | 31.338 | 4.81 | 0.57 | 4.50 | NGC 1333 |
| 60.731 | 36.189 | 0.49 | 0.09 | -3.35 | NGC 1499 |
| 83.654 | 22.045 | 155 | 2 | -1.15 | Crab Neb |
| 83.807 | -5.419 | 216 | 3 | -0.35 | Orion region |
| 84.018 | -6.338 | Orion region | |||
| 85.396 | -1.917 | 30 | 2 | -0.2 | Orion region |
| 246.756 | -24.633 | Ophiucus region | |||
| 285.398 | -36.983 | 3.31 | 0.55 | 3.70 | NGC 6729 |
| RA (∘) | Declination (∘) | (Jy/beam) | rms (Jy) | spectral index | Id in other catalogues | Flags |
|---|---|---|---|---|---|---|
| 1.483 | -6.350 | 1.30 | 0.23 | -0.80 | PMN J0006-0623 | WNP |
| 5.033 | 73.493 | 1.41 | 0.26 | -0.45 | GB6 J0019+7327 | P |
| 6.514 | -35.154 | 0.72 | 0.14 | -1.65 | PMN J0026-3512 | WN |
| 9.603 | -24.892 | 1.65 | 0.33 | 0.30 | PMN J0038-2459 | WNP |
| 16.715 | -40.600 | 1.74 | 0.21 | -0.55 | PMN J0106-4034 | WNP |
| 23.160 | -16.928 | 0.91 | 0.17 | -1.20 | PKS 0130-17 | WNP |
| 24.279 | 47.846 | 1.91 | 0.19 | -1.20 | GB6 J0136+4751 | WNP |
| 24.383 | -24.518 | 1.56 | 0.30 | 0.20 | PMN J0137-2430 | WNP |
| 32.749 | -51.070 | 1.93 | 0.17 | -1.00 | PMN J0210-5101 | WNP |
| 34.293 | 73.803 | 0.73 | 0.13 | -1.70 | GB6 J0217+7349 | NP |
| 39.510 | 28.836 | 2.20 | 0.33 | -0.20 | GB6 J0237+2848 | WNP |
| 39.723 | 16.654 | GB6 J0238+1637 | WP | |||
| 43.374 | -54.666 | 1.56 | 0.20 | -0.55 | PMN J0253-5441 | WNP |
| 46.088 | -62.233 | 1.31 | 0.25 | 0.05 | PMN J0303-6211 | WNP |
| 49.957 | 41.450 | 2.67 | 0.16 | -1.90 | GB6 J0319+4130 | WNP |
| 50.377 | -37.092 | 0.81 | 0.14 | -1.55 | Fornax A | NP |
| 53.549 | -40.203 | 1.47 | 0.25 | -0.20 | PMN J0334-4008 | WNP |
| 54.252 | 32.327 | 2.57 | 0.42 | 0.70 | GB6 J0336+3218 | P |
| 54.862 | -1.734 | 2.33 | 0.33 | 0.05 | PMN J0339-0146 | WNP |
| 57.187 | -27.832 | 1.36 | 0.26 | 0.00 | PMN J0348-2749 | WNP |
| 61.062 | -36.120 | 2.14 | 0.21 | -0.65 | PMN J0403-3605 | WNP |
| 64.548 | 38.025 | 1.96 | 0.16 | -2.15 | 3C 111 | NP |
| 65.845 | -1.374 | 3.39 | 0.25 | -1.15 | PMN J0423-0120 | WNP |
| 67.166 | -37.869 | 1.66 | 0.29 | 0.05 | PMN J0428-3756 | WNP |
| 68.301 | 5.418 | 3.51 | 0.41 | 0.50 | GB6 J0433+0521 | WNP |
| 72.260 | -81.053 | 1.61 | 0.28 | 0.25 | PMN J0450-8100 | WNP |
| 73.914 | -46.248 | 3.05 | 0.26 | -0.50 | PMN J0455-4616 | WNP |
| 74.270 | -23.427 | 1.66 | 0.20 | -0.75 | PMN J0457-2324 | WNP |
| 78.849 | -45.994 | 1.02 | 0.19 | -1.40 | PMN J0515-4556 | WP |
| 79.975 | -45.795 | 2.30 | 0.21 | -1.20 | PMN J0519-4546 | WNP |
| 80.849 | -36.456 | 2.57 | 0.19 | -1.05 | PMN J0522-3628 | WNP |
| 84.678 | -44.028 | 3.15 | 0.21 | -1.15 | PMN J0538-4405 | WNP |
| 91.968 | -6.396 | 7.99 | 0.49 | 0.40 | PKS 0605-06 | NP |
| 92.460 | -15.756 | 1.79 | 0.24 | -0.50 | PMN J0609-1542 | WNP |
| 97.363 | -19.946 | 1.66 | 0.32 | 0.55 | PMN J0629-1959 | WNP |
| 98.985 | -75.242 | 2.03 | 0.19 | -0.80 | PMN J0635-7516 | WNP |
| 101.703 | 44.896 | 1.80 | 0.33 | 0.05 | GB6 J0646+4451 | WNP |
| 102.564 | -16.699 | 1.75 | 0.26 | -0.35 | PKS 0648-16 | NP |
| 110.556 | 71.313 | 2.15 | 0.26 | -0.05 | GB6 J0721+7120 | WNP |
| 111.493 | -0.972 | 2.23 | 0.38 | 0.65 | PMN J0725-0054 | WP |
| 114.856 | 1.724 | 0.96 | 0.18 | -1.35 | GB6 J0739+0136 | WNP |
| 117.689 | 12.478 | 2.04 | 0.23 | -0.90 | GB6 J0750+1231 | WNP |
| 126.524 | 3.272 | 1.27 | 0.22 | -0.90 | GB6 J0825+0309 | WNP |
| 129.076 | -20.280 | 1.07 | 0.19 | -1.10 | PMN J0836-2017 | WNP |
| 130.356 | 70.885 | 0.91 | 0.15 | -1.30 | GB6 J0841+7053 | WNP |
| 133.730 | 20.128 | 2.48 | 0.29 | -0.70 | GB6 J0854+2006 | WNP |
| 140.233 | 44.738 | 0.89 | 0.14 | -2.00 | GB6 J0920+4441 | WP |
| 140.441 | -26.324 | 1.07 | 0.21 | -0.85 | PMN J0921-2618 | WP |
| 141.810 | 38.974 | 2.63 | 0.21 | -1.15 | GB6 J0927+3902 | WNP |
| 159.372 | -29.584 | 1.29 | 0.22 | -0.75 | PMN J1037-2934 | WNP |
| 159.659 | 5.136 | 0.80 | 0.16 | -1.70 | GB6 J1038+0512 | W |
| 164.323 | -80.083 | 1.65 | 0.19 | -0.85 | PMN J1058-8003 | WNP |
| 164.615 | 1.562 | 2.86 | 0.22 | -1.10 | GB6 J1058+0133 | WNP |
| 171.870 | -18.836 | 0.97 | 0.19 | -1.20 | PMN J1127-1857 | WP |
| 176.717 | -38.190 | 0.92 | 0.15 | -1.75 | PMN J1147-3812 | WNP |
| 178.285 | 49.483 | 1.47 | 0.19 | -0.70 | GB6 J1153+4931 | WNP |
| 179.831 | 29.192 | 1.21 | 0.22 | -0.60 | GB6 J1159+2914 | WNP |
| 187.270 | 2.104 | 10.71 | 0.33 | -1.20 | GB6 J1229+0202 | WNP |
| 187.699 | 12.338 | 5.99 | 0.26 | -1.05 | GB6 J1230+1223 | WNP |
| 191.732 | -25.848 | PKS 1244-255 | WNP | |||
| 193.992 | -5.821 | 8.59 | 0.32 | -1.15 | PMN J1256-0547 | WNP |
| 194.823 | 51.645 | 1.37 | 0.25 | 0.05 | GB6 J1259+5141 | W |
| 197.630 | 32.472 | 0.82 | 0.13 | -1.75 | GB6 J1310+3220 | WNP |
| 201.390 | -42.960 | 16.92 | 0.46 | -1.20 | Centaurus A | NP |
| 204.426 | -13.021 | 4.96 | 0.29 | -0.60 | PMN J1337-1257 | WNP |
| 209.267 | 19.351 | 1.39 | 0.21 | -0.75 | GB6 J1357+1919 | WNP |
| 214.876 | 54.421 | 1.05 | 0.20 | -0.50 | GB6 J1419+5423 | WNP |
| 216.967 | -42.070 | 1.75 | 0.23 | -0.75 | PMN J1427-4206 | WNP |
| 229.382 | -24.370 | 2.31 | 0.28 | -0.40 | PMN J1517-2422 | WNP |
| 237.415 | 2.563 | 1.54 | 0.27 | -0.55 | GB6 J1549+0237 | WNP |
| 237.763 | 5.461 | 1.77 | 0.26 | -0.50 | GB6 J1550+0527 | WNP |
| 243.420 | 34.145 | 2.58 | 0.25 | -0.30 | GB6 J1613+3412 | WNP |
| 244.386 | -77.279 | 1.07 | 0.16 | -1.20 | PMN J1617-7717 | WNP |
| 246.561 | -29.832 | 1.91 | 0.30 | -0.40 | PKS 1622-29 | NP |
| 248.816 | 38.155 | 3.25 | 0.25 | -0.50 | GB6 J1635+3808 | WNP |
| 249.747 | 57.392 | 1.98 | 0.29 | 0.55 | GB6 J1638+5720 | WNP |
| 250.551 | 68.974 | 0.80 | 0.08 | -2.45 | GB6 J1642+6856 | WNP |
| 250.742 | 39.825 | 3.89 | 0.23 | -0.75 | GB6 J1642+3948 | WNP |
| 260.115 | -1.025 | 2.18 | 0.27 | -0.40 | PKS 1717-00 | NP |
| 260.873 | -65.025 | 1.32 | 0.25 | -0.25 | PMN J1723-6500 | WP |
| 263.303 | -13.051 | 3.05 | 0.29 | -0.30 | PKS 1730-13 | NP |
| 263.593 | 38.888 | 1.08 | 0.20 | -0.70 | GB6 J1734+3857 | WNP |
| 265.933 | -3.813 | 2.55 | 0.22 | -0.90 | PKS 1741-03 | NP |
| 267.966 | 9.655 | 4.05 | 0.26 | -0.45 | GB6 J1751+0938 | WNP |
| 268.340 | 28.738 | 1.65 | 0.21 | -0.50 | GB6 J1753+2847 | WNP |
| 270.301 | 78.459 | 1.05 | 0.17 | -1.00 | NVSS J180045+782804 | WP |
| 270.400 | 44.088 | 1.40 | 0.22 | -0.45 | GB6 J1801+4404 | WNP |
| 271.711 | 69.794 | 1.34 | 0.20 | -0.25 | GB6 J1806+6949 | WNP |
| 277.443 | 48.800 | 1.07 | 0.13 | -1.60 | GB6 J1829+4844 | WNP |
| 280.720 | 68.162 | 0.82 | 0.14 | -0.90 | GB6 J1842+6809 | WP |
| 282.241 | 67.063 | 0.84 | 0.13 | -1.15 | GB6 J1849+6705 | WNP |
| 287.737 | -20.060 | 2.12 | 0.34 | 0.10 | PMN J1911-2006 | WNP |
| 290.987 | -21.081 | 1.50 | 0.25 | -0.65 | PMN J1923-2104 | WNP |
| 291.214 | -29.282 | 7.01 | 0.28 | -1.00 | PMN J1924-2914 | WNP |
| 292.018 | 73.976 | 1.56 | 0.15 | -1.20 | GB6 J1927+7357 | WNP |
| 299.461 | -38.755 | 2.04 | 0.26 | -0.55 | PMN J1957-3845 | WNP |
| 299.942 | 40.752 | 6.02 | 0.36 | -2.25 | Cygnus A | NP |
| 300.337 | -17.769 | 0.84 | 0.16 | -1.60 | PMN J2000-1748 | WNP |
| 302.849 | -15.774 | 1.45 | 0.29 | -0.25 | PMN J2011-1546 | WNP |
| 314.018 | -47.226 | 1.87 | 0.25 | -0.45 | PMN J2056-4714 | WNP |
| 323.562 | -1.791 | 1.25 | 0.22 | -1.00 | PMN J2134-0153 | WNP |
| 324.128 | 0.682 | 1.67 | 0.28 | -0.30 | GB6 J2136+0041 | WNP |
| 327.069 | 6.999 | 3.98 | 0.23 | -1.15 | GB6 J2148+0657 | WNP |
| 327.945 | -30.455 | 1.44 | 0.24 | -0.55 | PMN J2151-3028 | WNP |
| 328.366 | 47.275 | 1.93 | 0.26 | -0.25 | GB6 J2153+4716 | NP |
| 329.184 | -69.703 | 1.81 | 0.22 | -0.50 | PMN J2157-6941 | WNP |
| 330.649 | 42.251 | 2.68 | 0.25 | -0.30 | GB6 J2202+4216 | WNP |
| 330.745 | 31.724 | 1.66 | 0.28 | -0.05 | GB6 J2203+3145 | WNP |
| 330.851 | 17.436 | 1.24 | 0.23 | -0.70 | GB6 J2203+1725 | WNP |
| 334.914 | 63.283 | 2.98 | 0.57 | 2.90 | GB6 J2219+6317 | NP |
| 336.405 | -5.002 | 3.43 | 0.26 | -0.75 | PMN J2225-0457 | WNP |
| 337.427 | -8.582 | 2.69 | 0.30 | -0.35 | PMN J2229-0832 | WNP |
| 338.171 | 11.674 | 4.19 | 0.34 | 0.20 | GB6 J2232+1143 | WNP |
| 338.909 | -48.584 | 1.33 | 0.19 | -0.85 | PMN J2235-4835 | WNP |
| 341.600 | -12.087 | 1.24 | 0.21 | -1.05 | PMN J2246-1206 | WP |
| 343.547 | 16.149 | 7.96 | 0.35 | -0.35 | GB6 J2253+1608 | WNP |
| 344.514 | -28.003 | 3.58 | 0.28 | -0.35 | PMN J2258-2758 | WNP |
| 352.347 | -47.438 | 1.18 | 0.22 | -0.55 | PMN J2329-4730 | WP |
| 359.607 | -53.218 | 1.24 | 0.20 | -0.60 | PMN J2357-5311 | WP |
4 Results and discussion
The source detection was performed applying the MMF filter to the WMAP 7yr V and W maps, at 61 and 94 GHz respectively. We have used only one (V1) of the 2 differencing assemblies for the V band, because V1 and V2 are very similar. As for the W band, we used 2 (W2 and W3) out of the 4 differencing assemblies because their symmetrized beam profiles are geometrically very similar (same as for W1 and W4) and this makes the photometry easier. The W2 and W3 maps were combined pixel by pixel, weighting with the inverse of the variances of the pixels. To minimise the spurious detections due to the complex structure of the Galactic emissions near the equatorial plane and of the Large Magellanic Cloud (LMC) region, we have removed from the final catalogue objects with and within a radius of around the LMC ( in equatorial coordinates). No sources are detected within the Small Magellanic Cloud.
4.1 Point source detection
The two-step filtering approach described in section 3 yields 129 detections in the 61 and 94 GHz WMAP 7yr maps, outside the Galactic plane and LMC regions specified above. For each of them, the MMF gives the flux density at the reference frequency (94 GHz, in eq. ( 3)) and the spectral index, the only free parameter of the method. The uncertainty on the spectral index can be estimated from intensive simulations made in Lanz et al. (2010). Table 1 lists the nine sources that are either well known Galactic sources (like the Crab Nebula, the HII regions NGC 281 and NGC 1499 or the star-formation regions NGC 1333 and NGC 6729) or are located within Galactic molecular cloud complexes, like the Orion or the Ophiucus regions, or within regions of intense Galactic emissions, plus one unidentified. Table 1 gives the flux densities within the WMAP 94 GHz beam. In most cases, these are lower limits to the total flux densities because the sources are resolved. Given the different beam sizes at the two frequencies, the spectral indices cannot be reliably estimated in the case of resolved sources.
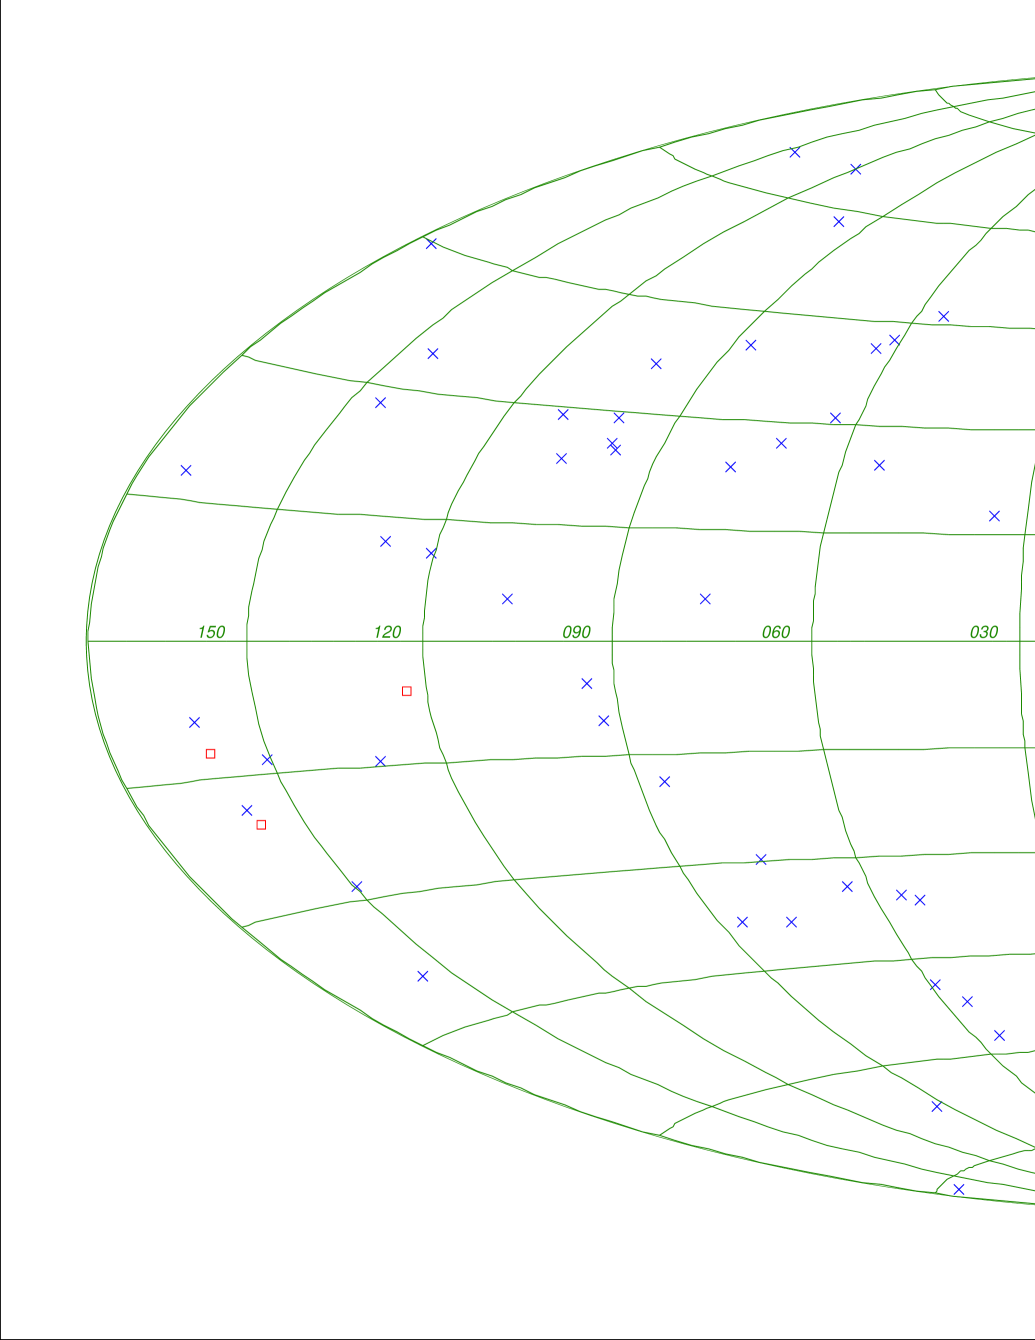
Excluding the ten sources listed in Table 1, the MMF has detected 119 objects, listed in Table LABEL:fuentes_extrag. All these objects have a counterpart in lower frequency radio catalogues, that cover the whole sky to much fainter flux density limits333Except for a few of the sources in Table 1, none of the objects detected by the MMF has an IRAS counterpart., (see Figure 1). The apparently ultra-steep () spectrum of Cygnus A is partly due to resolution effects (the 94 GHz beam encompasses a lower fraction of the total flux density than the 61 GHz beam).
In Tables 1 and LABEL:fuentes_extrag, sources without an estimation of the flux density or the spectral index are objects that are only ‘detected’ at one frequency. Therefore, because the method we use to filter the maps is multifrequency, the spectral indices of these sources fall outside the range studied in this work. These sources are not taken into account in the subsequent analysis.
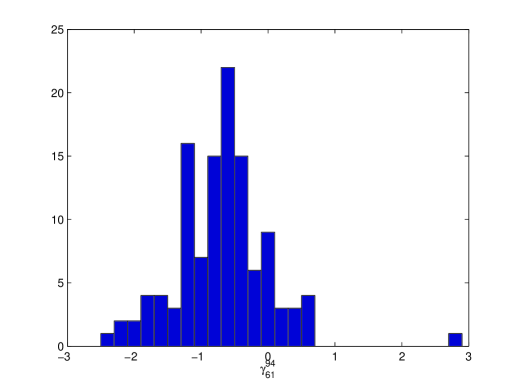
The spectral index distribution of the sources in Table LABEL:fuentes_extrag, shown in Figure 2, has a median value of -0.65 with a dispersion of 0.71. For comparison, Wright et al. (2009), mostly based on lower frequency WMAP data, found a mean spectral index , with a dispersion . Our results are therefore consistent with the steepening of source spectra above GHz found for different data sets (Sadler et al., 2008; González-Nuevo et al., 2008; Marriage et al., 2011; Massardi et al., 2010; Planck Collaboration et al., 2011b).
| S (Jy) | ||
|---|---|---|
| 61 GHz | 94 GHz | |
| 1.27 | 10.11.7 | 10.91.8 |
| 2.01 | 254 | 183 |
| 3.18 | 215 | 195 |
| 5.05 | 278 | 95 |
| 8.00 | 148 | 189 |
| 12.68 | 2716 | 99 |
| 20.10 | 1818 | 1818 |
| 31.85 | 3636 | |
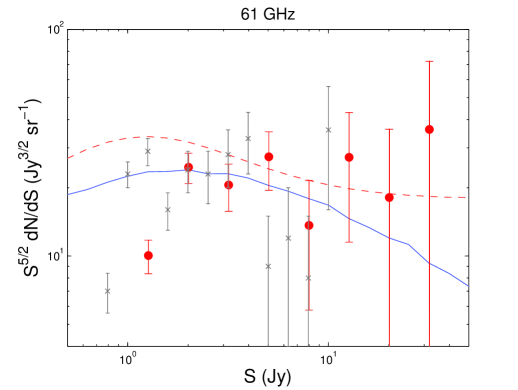
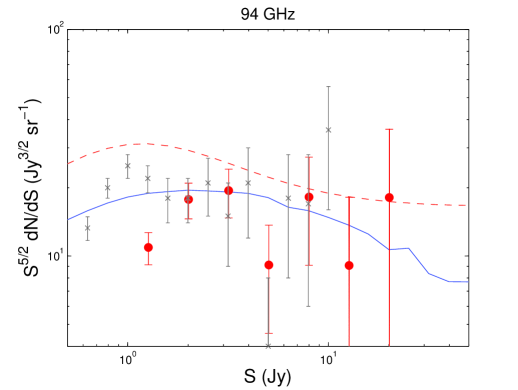
The Euclidean normalised source counts at 61 and 94 GHz are given in Table 3 and shown in Figure 3, where they are compared with the counts in the nearest Planck channels (Planck Collaboration et al., 2011b) and with the predictions of the De Zotti et al. (2005) and Tucci et al. (2011) models.
In this figure, the flux densities obtained with the MMF were corrected with a Bayesian approach (Herranz et al., 2006) in order to remove as much as possible the Eddington bias (Eddington, 1913). This approach takes into account the distribution in flux density of the objects as a power law with unknown slope, and an additive Gaussian noise. It is important to point out that this correction is statistical, and therefore it has been taken into account only in the estimation of the source counts.
The comparison in Figure 3 shows that our completeness limit is Jy. Above this limit, the agreement with the Planck counts and with the Tucci et al. (2011) model is generally good. This confirms that the Tucci et al. (2011) model deals appropriately with the high frequency behaviour of source spectra.
Although several data sets had suggested (Sadler et al., 2008; González-Nuevo et al., 2008) and then detected (Planck Collaboration et al., 2011b, c) a break in the bright extragalactic radio sources (at high-flux level) at GHz, this break is only well explained with the current data if we consider the Tucci et al. (2011) model.
4.2 Comparison with the WMAP catalogues
The WMAP Five-Band Point Source Catalog (Gold et al., 2011) lists all the sources that where detected at in at least one frequency channel, outside a mask excluding sources in the Galactic plane and Magellanic Cloud regions. Flux densities in the other channels are reported if the signal is detected at a significance. In this catalogue, 94 GHz flux densities are reported for 236 sources. However it is not clear how many of them are detected at a level at 94 GHz. Since the WMAP and NEWPS catalogues have comparable statistical completeness and reliability properties, on the basis of the NEWPS3yr catalogue (see section 4.3) we may roughly estimate that the detections are 22. We expect a similar or smaller number of sources with the same significance in the less complete WMAP catalogue at the same frequency. By contrast, our method guarantees that all the 119 (presumably) extragalactic sources, 104 of which are outside the WMAP Point Source Catalog mask, are detected at at 94 GHz.
4.3 Comparison with NEWPS catalogues
López-Caniego et al. (2007) looked for sources in the WMAP 3-yr maps at the positions of known 5 GHz sources (non-blind search) and reported 22 detections at 94 GHz (listed in the NEWPS3yr catalogue). Massardi et al. (2009) combined a non-blind (based on the ATCA 20 GHz survey catalogue) and a blind search on WMAP 5-yr maps, excluding the W (94 GHz) channel (NEWPS5yr catalogue). At 61 GHz they detected 169 sources, 61 of which are not present in our catalogue (if we also take into account Table 1); 45 of them however are detected at with the MMF in the blind step of our detection process. Seven of the other 18 sources are at and may be contaminated by Galactic emission, and three lie in the LMC region, excluded from our search. The remaining 8 sources have not been detected by the MMF. On the other hand, our catalogue of extragalactic objects contains 16 sources not present in the NEWPS5yr catalogue. We must remark that our catalogue is completely based on a blind search, whereas the NEWPS catalogue was guided by a previous selection of sourecs detected at low frequency.
4.4 Comparison with ATCA and NRAO flux densities
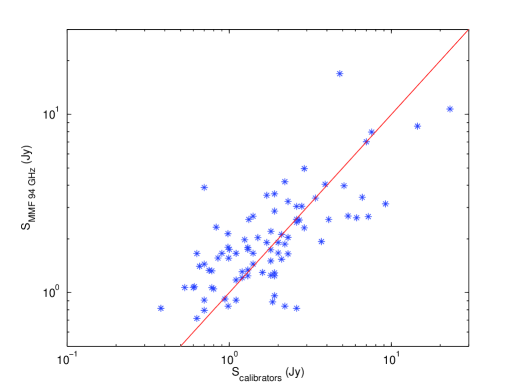
Our sample of 94 GHz detections includes 85 sources with ground based mm observations either with ATCA444http://www.narrabri.atnf.csiro.au/calibrators/index.html or with the NRAO 12m telescope (Holdaway et al., 1994)555http://www.alma.nrao.edu/memos/html-memos/alma123/memo123.pdf. The ATCA flux densities for these sources have been collected in the frequency range between 85 and 105 GHz with the “old” ATCA digital correlator with up to MHz bandwidth. The MMF flux density estimates are compared with ATCA and NRAO measurements in Figure 4. There is evidence that the MMF somewhat overestimates the flux densities below Jy, most likely due to the Eddington bias. Above 2 Jy the mean absolute fractional error somewhat higher than expected from the combination of nominal measurement errors and variability, suggesting that the true errors associated to the MMF flux density estimates are somewhat larger than the nominal values. In this respect, it must be noted that the WMAP 7-yr maps are averages over seven years of observations while the ATCA and NRAO measurements refer to a single epoch.
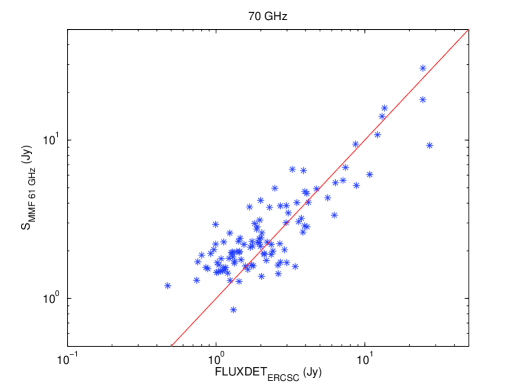
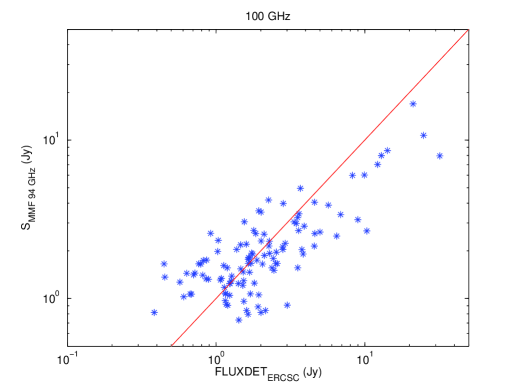
4.5 Comparison with the Planck Early Release Compact Source Catalogue (ERCSC)
Thanks to its higher sensitivity, Planck has detected far more sources than WMAP. The Early Release Compact Source Catalogue (ERCSC) lists 1381 sources detected at 100 GHz and 599 detected at 70 GHz; 308 and 788 of the ERCSC 70 GHz and 100 GHz sources, respectively, are outside of the WMAP Point Source Catalog mask. Three of our sources in Table LABEL:fuentes_extrag are not present in the ERCSC, but are present in lower frequency catalogues with flux densities consistent with those inferred from WMAP data.
The ERCSC gives four different measures of flux density for each source. For the comparison with our results, we have chosen the estimate called FLUXDET, which is calculated using an approach similar to ours and appears to have higher reliability for low signal-to-noise ratios. Figure 5 compares the FLUXDET flux densities at 70 and 100 GHz with the MMF ones at the nearest WMAP frequencies (61 and 94 GHz, respectively). Again there is evidence that the MMF flux densities are affected by the Eddington bias below Jy. The MMF flux densities of the 5 sources with Jy are all lower than the the ERCSC flux densities at 100 GHz. Two of these sources (the one at , and Cen A) has a strong dust emission, seen in the IRAS survey, that enhances the 100 GHz flux density. The other 3 are well known highly variable blazars (3C273, 3C279, 3C454.3), caught by Planck in a bright phase.
The spectral index distributions of our sources are pretty close to that of the ERCSC sources: the median spectral index of our sources is -0.65, with a standard deviation of 0.71; for ERCSC sources with (to avoid strong contamination by dust emission) and excluding the Galactic plane and the LMC region as defined previously in order to have a sample comparable with ours, we find a median value of with a standard deviation of 0.52.
5 Conclusions
The detection of extragalactic point sources is a crucial task in the analysis of CMB maps because point sources are the main contaminant of the CMB power spectrum on small angular scales. From the same maps we can extract interesting astrophysical information about the point sources themselves. The development of efficient detection tools is therefore very important. The MMF holds the promise of achieving detections down to fainter flux densities than achievable by standard methods.
Applying this tool to WMAP 7yr maps at 61 and 94 GHz simultaneously we have obtained 129 detections at both frequencies, outside the Galactic plane (i.e. at ) and the LMC regions. Nine of these sources, listed in Table 1, are either known Galactic sources or reside in regions of high Galactic emission. One additional source, also listed in Table 1, does not have a counterpart in low frequency radio catalogues. All the other 119 sources, listed in Table LABEL:fuentes_extrag, do have a low frequency counterpart; 104 of them reside outside the WMAP Point Source Catalog mask. For comparison, the NEWPS-3year catalogue contains 22 detections at 94 GHz. Although the Planck ERCSC contains far more sources at the frequencies (70 and 100 GHz) nearest to those used in the present analysis, we have detected three sources not present in the ERCSC, yet with flux densities consistent with lower frequency measurements.
A comparison of the flux densities yielded by the MMF with those obtained at GHz with the ATCA or the NRAO 12m telescope, and with the Planck ERCSC data at 70 and 100 GHz, shows a generally good agreement above Jy, although the rms differences between MMF and ground based or ERCSC values are larger than expected from variability and nominal measurement errors. This suggests that the errors associated to MMF flux density estimates are somewhat larger than the nominal values listed in Table LABEL:fuentes_extrag. Below 2 Jy, the MMF flux densities tend to be somewhat overestimated, as the effect of the Eddington bias.
The distribution of 61–94 GHz spectral indices of sources in Table LABEL:fuentes_extrag has a median value equal to (with a dispersion of 0.71), while Wright et al. (2009), mostly based on lower frequency WMAP data, found a mean spectral index , with a dispersion . Our results therefore confirm the steepening of extragalactic radio source spectra above GHz, suggested by various data sets (Sadler et al., 2008; González-Nuevo et al., 2008; Marriage et al., 2011; Massardi et al., 2010) and then confirmed by analyses of different samples (Planck Collaboration et al., 2011b, c; Giommi et al., 2011) of bright extragalactic sources extracted by the Planck Early Release Compact Source Catalogue (Planck Collaboration et al., 2011a).
This average steepening observed in the spectra of bright extragalactic sources, which are mainly blazars in this frequency range (Angel & Stockman, 1980), has been recently interpreted by Tucci et al. (2011) in terms of the "break" frequency, foreseen in the emission spectra of blazars by classic physical models for the synchrotron emission in the inner part of inhomogenous conical jets. Remarkably, this new model by Tucci et al. (2011) is able to give a good a fit not only to the source number counts here presented (see Figure 3; § 4.1) but also to almost all the published data on number counts and spectral index distributions of bright extragalctic radio sources up to, al least, 200-300 GHz.
Acknowledgments
The authors acknowledge partial financial support from the Spanish Ministerio de Economía y Competitividad projects AYA2010-21766-C03-01 and CSD2010-00064. LFL acknowledges the Spanish CSIC for a JAE-Predoc fellowship and the hospitality of the Scuola Internazionale Superiore di Studi Avanzati (SISSA) of Trieste during two research stays in 2010 and 2011. ML-C thanks the Spanish Ministerio de Economía y Competitividad for a Juan de la Cierva fellowship. JG-N, GdZ, and MM acknowledge financial support from ASI/INAF Agreement I/072/09/0 for the Planck LFI activity of Phase E2. DH wishes to acknowledge the Spanish Ministerio de Educación for a José Castillejo Fellowship (JC2010-0096) and the Astronomy Group at the Cavendish Laboratory for their hospitality during a research stay in 2011. The authors are grateful to Luigi Toffolatti and Marco Tucci for their useful comments and explanations, in particular on the extragalactic source counts.
References
- Angel & Stockman (1980) Angel J. R. P., Stockman H. S., 1980, ARA&A, 18, 321
- Argüeso et al. (2011a) Argüeso F., Sanz J. L., Herranz D., 2011a, arXiv:1101.0701v1, accepted for publication in Signal Processing
- Argüeso et al. (2011b) Argüeso F., Salerno E., Herranz D., Sanz J. L., Kuruoğlu E. E., Kayabol K., 2011b, MNRAS, 414, 410
- Barreiro et al. (2003) Barreiro R. B., Sanz J. L., Herranz D., Martínez-González E., 2003, MNRAS, 342, 119
- Bennett et al. (2003) Bennett C. L., Bay M., Halpern M., Hinshaw G., Jackson C., Jarosik N., Kogut A., Limon M., Meyer S. S., Page L., Spergel D. N., Tucker G. S., Wilkinson D. T., Wollack E., Wright E. L., 2003, ApJ, 583, 1
- Bertin & Arnouts (1996) Bertin E., Arnouts S., 1996, A&AS, 117, 393
- Carvalho et al. (2009) Carvalho P., Rocha G., Hobson M. P., 2009, MNRAS, 393, 681
- Chen & Wright (2008) Chen X., Wright E. L., 2008, ApJ, 681, 747
- Chiang et al. (2002) Chiang L.-Y., Jørgensen H. E., Naselsky I. P., Naselsky P. D., Novikov I. D., Christensen P. R., 2002, MNRAS, 335, 1054
- De Zotti et al. (1999) De Zotti G., Toffolatti L., Argüeso F., Davies R. D., Mazzotta P., Partridge R. B., Smoot G. F., Vittorio N., 1999, in Maiani L., Melchiorri F., Vittorio N., eds, 3K cosmology Vol. 476 of American Institute of Physics Conference Series, The Planck Surveyor Mission: Astrophysical Prospects. pp 204–+
- De Zotti et al. (2005) De Zotti G., Ricci R., Mesa D., Silva L., Mazzotta P., Toffolatti L., González-Nuevo J., 2005, A&A, 431, 893
- Eddington (1913) Eddington A. S., 1913, MNRAS, 73, 359
- Giommi et al. (2011) Giommi P., Polenta G., Lähteenmäki A., Thompson D. J., Capalbi M., Cutini S., Gasparrini D., González-Nuevo J., et al. 2011, arXiv:1108.1114v1
- Gold et al. (2011) Gold B., Odegard N., Weiland J. L., Hill R. S., Kogut A., Bennett C. L., Hinshaw G., Chen X., Dunkley J., Halpern M., 2011, ApJS, 192, 15
- González-Nuevo et al. (2006) González-Nuevo J., Argüeso F., López-Caniego M., Toffolatti L., Sanz J. L., Vielva P., Herranz D., 2006, MNRAS, 369, 1603
- González-Nuevo et al. (2008) González-Nuevo J., Massardi M., Argüeso F., Herranz D., Toffolatti L., Sanz J. L., López-Caniego M., De Zotti G., 2008, MNRAS, 384, 711
- Górski et al. (2005) Górski K. M., Hivon E., Banday A. J., Wandelt B. D., Hansen F. K., Reinecke M., Bartelmann M., 2005, ApJ, 622, 759
- Herranz et al. (2002a) Herranz D., Gallegos J., Sanz J. L., Martínez-González E., 2002a, MNRAS, 334, 533
- Herranz et al. (2002b) Herranz D., Sanz J. L., Hobson M. P., Barreiro R. B., Diego J. M., Martínez-González E., Lasenby A. N., 2002b, MNRAS, 336, 1057
- Herranz et al. (2006) Herranz D., Sanz J. L., López-Caniego M., González-Nuevo J., 2006, IEEE International Symposium on Signal Processing and Information Technology, 1, 541
- Herranz & Sanz (2008) Herranz D., Sanz J. L., 2008, IEEE Journal of Selected Topics in Signal Processing, 5, 727
- Herranz et al. (2009) Herranz D., López-Caniego M., Sanz J. L., González-Nuevo J., 2009, MNRAS, 394, 510
- Herranz & Vielva (2010) Herranz D., Vielva P., 2010, IEEE Signal Processing Magazine, 27, 67
- Hinshaw et al. (2007) Hinshaw G., Nolta M. R., Bennett C. L., Bean R., Doré O., Greason M. R., Halpern M., Hill R. S., Jarosik N., Kogut A., Komatsu E., 2007, ApJS, 170, 288
- Hobson et al. (1999) Hobson M. P., Barreiro R. B., Toffolatti L., Lasenby A. N., Sanz J. L., Jones A. W., Bouchet F. R., 1999, MNRAS, 306, 232
- Hobson & McLachlan (2003) Hobson M. P., McLachlan C., 2003, MNRAS, 338, 765
- Holdaway et al. (1994) Holdaway M., Owen F., Rupen M., 1994, Alma memo , Source Counts at 90 GHz, National Radio Astronomy Observatory
- Lanz et al. (2010) Lanz L. F., Herranz D., Sanz J. L., González-Nuevo J., López-Caniego M., 2010, MNRAS, 403, 2120
- López-Caniego et al. (2004) López-Caniego M., Herranz D., Barreiro R. B., Sanz J. L., 2004, in Bouman C. A., Miller E. L., eds, Computational Imaging II. Edited by Bouman, Charles A.; Miller, Eric L. Proceedings of the SPIE, Volume 5299, pp. 145-154 (2004). Vol. 5299 of Presented at the Society of Photo-Optical Instrumentation Engineers (SPIE) Conference, A Bayesian approach to filter design: detection of compact sources. pp 145–154
- López-Caniego et al. (2005a) López-Caniego M., Herranz D., Sanz J. L., Barreiro R. B., 2005a, EURASIP Journal on Applied Signal Processing, 15, 2426
- López-Caniego et al. (2005b) López-Caniego M., Herranz D., Barreiro R. B., Sanz J. L., 2005b, MNRAS, 359, 993
- López-Caniego et al. (2006) López-Caniego M., Herranz D., González-Nuevo J., Sanz J. L., Barreiro R. B., Vielva P., Argüeso F., Toffolatti L., 2006, MNRAS, 370, 2047
- López-Caniego et al. (2007) López-Caniego M., González-Nuevo J., Herranz D., Massardi M., Sanz J. L., De Zotti G., Toffolatti L., Argüeso F., 2007, ApJS, 170, 108
- López-Caniego et al. (2009) López-Caniego M., Massardi M., González-Nuevo J., Lanz L., Herranz D., De Zotti G., Sanz J. L., Argüeso F., 2009, ApJ, 705, 868
- Marriage et al. (2011) Marriage T. A., Juin J. B., Lin Y.-T., Marsden D., Nolta M. R., Partridge B., Ade P. A. R., Aguirre P., et al. 2011, ApJ, 731, 100
- Massardi et al. (2009) Massardi M., López-Caniego M., González-Nuevo J., Herranz D., De Zotti G., Sanz J. L., 2009, MNRAS, 392, 733
- Massardi et al. (2010) Massardi M., Bonaldi A., Negrello M., Ricciardi S., Raccanelli A., De Zotti G., 2010, MNRAS, 404, 532
- Planck Collaboration et al. (2011a) Planck Collaboration: Ade P. A. R., Aghanim N., Arnaud M., Ashdown M., Aumont J., Baccigalupi C., Balbi A., Banday A. J., Barreiro R. B., et al. 2011a, A&A, 536, A7
- Planck Collaboration et al. (2011b) Planck Collaboration: Ade P. A. R., Aghanim N., Argüeso F., Arnaud M., Ashdown M., Aumont J., Baccigalupi C., Balbi A., Banday A. J., et al. 2011b, A&A, 536, A13
- Planck Collaboration et al. (2011c) Planck Collaboration: Aatrokoski J., Ade P. A. R., Aghanim N., Aller H. D., Aller M. F., Angelakis E., Arnaud M., Ashdown M., Aumont J., et al. 2011c, A&A, 536, A15
- Sadler et al. (2008) Sadler E. M., Ricci R., Ekers R. D., Sault R. J., Jackson C. A., de Zotti G., 2008, MNRAS, 385, 1656
- Sanz et al. (2001) Sanz J. L., Herranz D., Martínez-Gónzalez E., 2001, ApJ, 552, 484
- Sanz et al. (2006) Sanz J. L., Herranz D., López-Caniego M., Argüeso F., 2006, in Proceedings of the 14th European Signal Processing Conference (2006). EUSIPCO 2006 Conference, Wavelets on the sphere. Application to the detection problem. pp 1–5
- Sunyaev & Zeldovich (1970) Sunyaev R. A., Zeldovich Y. B., 1970, Comments on Astrophysics and Space Physics, 2, 66
- Sunyaev & Zeldovich (1972) Sunyaev R. A., Zeldovich Y. B., 1972, Comments on Astrophysics and Space Physics, 4, 173
- Tegmark & de Oliveira-Costa (1998) Tegmark M., de Oliveira-Costa A., 1998, ApJL, 500, L83+
- Toffolatti et al. (1998) Toffolatti L., Argüeso Gómez F., De Zotti G., Mazzei P., Franceschini A., Danese L., Burigana C., 1998, MNRAS, 297, 117
- Tucci et al. (2004) Tucci M., Martínez-González E., Toffolatti L., González-Nuevo J., De Zotti G., 2004, MNRAS, 349, 1267
- Tucci et al. (2005) Tucci M., Martínez-González E., Vielva P., Delabrouille J., 2005, MNRAS, 360, 935
- Tucci et al. (2011) Tucci M., Toffolatti L., De Zotti G., Martínez-González E., 2011, A&A, 533, A57
- Vielva et al. (2001) Vielva P., Barreiro R. B., Hobson M. P., Martínez-González E., Lasenby A. N., Sanz J. L., Toffolatti L., 2001, MNRAS, 328, 1
- Vielva et al. (2003) Vielva P., Martínez-González E., Gallegos J. E., Toffolatti L., Sanz J. L., 2003, MNRAS, 344, 89
- Vikhlinin et al. (1995) Vikhlinin A., Forman W., Jones C., Murray S., 1995, ApJ, 451, 542
- Wright et al. (2009) Wright E. L., Chen X., Odegard N., Bennett C. L., Hill R. S., Hinshaw G., Jarosik N., Komatsu E., Nolta M. R., Page L., Spergel D. N., et al. 2009, ApJS, 180, 283