X-ray Selected BL Lacertae Objects: Catalogue and Statistical Properties
Abstract
This talk focuses on the statistical properties of X-ray selected BL Lacertae objects (XBLs) whose catalogue has been compiled. It consists of 312 sources from different X-ray surveys, unambiguously identified to mid-2010. Results of the statistical research of different observational quantities (redshift, muliwavelength luminosities, host/nucleus absolute Magnitudes, central black hole masses, synchrotron peak frequencies, broadband spectral indices) are also provided and existence of the correlation between them is proved. Overall flux variability shows an increasing trend towards greater frequencies. XBL are found to be much less active in point of intra-night optical variability compared to radio-selected BL Lacs (RBLs). A separate list of 106 XBL candidates is also created including the same characteristics for each source as in the case of XBL catalogue.
1 Abastumani Astrophysical Observatory at the Ilia State University, 0162, Cholokashvili Av. 3/5, Tbilisi, Georgia
bk@genao.org
Introduction
BL Lacertae objects form one of the extreme subclass of active galactic nuclei (AGN). The prototype of these sources, BL Lacertae, was detected by [11] who classified it as a short-period variable star of 13-15 stellar magnitude and named the object as "363.1929 Lac". The name "BL Lacertae" was given by van Schewick in 1941. On the basis of the photographic plates, taken at the Sonnenberg observatory during 1927-1933, he deduced that there was an irregular variable star that varied between 13.5 mag and 15.1 mag (see [2]). After almost three decades, [21] reported that BL Lacertae coincided with the radio source VRO 42.22.01. This was followed by the detection of high and variable radio/optical polarization ([15], [23]), rapid optical variability with 0.1 mag over a few hours and flicker with the amplitude mag per 2 minutes ([19]), steep optical spectrum following a single power law, similar to quasars but showing no emission lines ([17]).
On the basis of the absorption features, detected in the optical spectra obtained with the 5 m
Hale telescope, [18] determined the redshift of BL
Lacertae. The obtained value () revealed that there was an
extragalactic source, hosted by an elliptical galaxy. During
1970-1978, one detected up to 30 sources with the same properties. On the "Pitsburgh Conference on BL Lacertae Objects"
(1978), [3] suggested that the extreme
properties of these objects should be caused by a Doppler-boosted
emission pointed to the observer. During this conference, Ed
Speigel introduced a term "blazars" to denote an independent class
of the extragalactic sources, including BL Lacertae objects (BLLs) and flat
spectrume radio-quasars (FSRQs, showing the same features with
additional presence of emission lines). X-ray satellite Einstein
and Energetic Gamma-Ray Experimental Telescope
(EGRET)introduced new eras in the investigation of these sources.
It was revealed that blazars constitute the most observed class of
the extragalactic sources through rays up to the TeV frequencies.
BLLs are thus the extragalactic sources with following features:
a. quasi-featureless spectra, leak of the prominent emission lines;
b. strong radio sources with a core-dominant morphology;
c. strong and variable optical/radio polarization;
d. violent flux variability through all spectral bands;
e. observed superluminal motions;
f. broad continuum extending from the radio to very high-energy -rays.
Up to now, more than 900 BLLs are unambiguously identified (see the second edition of the Roma-BZCAT, http://www.asdc.asi.it/bzcat). Bulk of them are originally detected either through radio or X-ray bands. Due to this reason, One divided them broadly into the radio-selected (RBLs) and X-ray selected ones (XBLs). However, these subclass differ each from other by their spectral energy distributions. A BLL is assumed to be a XBL if ([24])
| (1) |
where the X-ray flux density is taken at 1keV (2.42 Hz) and the radio one - at 5 GHz (both in Janskys). We deal otherwise with a RBL source.
Catalogue
The XBL catalogue consists of 312 sources (see [13]),
consisting of their equatorial coordinates, redshifts,
multiwavelength flux values and isotropic luminosities,
X-ray-to-radio flux ratios etc. It was compiled on the basis of following X-ray surveys:
1. HEAO-1 Large Area Sky Survey ([25], 16
sources).
2. Einstein Observatory Medium Sensitivity
Survey([14]), [8]; 25 sources);
3. Enstein Observatory Extended Medium Sensitivity Survey ([9],42sources);
4. Exosat High Galactic Latitude Survey ([10], 10
sources);
5. Einstein Slew Survey ([6], 61 sources);
6. ROSAT All-Sky Survey ([1], 306 sources);
7. XMM-Newton Bright Serendipitious Survey ([5], 3
sources).
A great deal of the XBLs belongs to the different
surveys.
A separate list of 106 XBL candidates is also created including the same characteristics for each source as in the case of XBL catalogue. We can not consider them as BLL sources mainly due to
lack of the optical spectroscopy. Their spectra are either not
published or they are of bad quality and we thus can not exclude the
existence of the emission lines. Their observational features are,
in fact, the same as for confirmed BLLs and we expect that high
signal-to-noise ratio spectroscopy will boost the number of XBLs.
Statistical Properties of XBLs
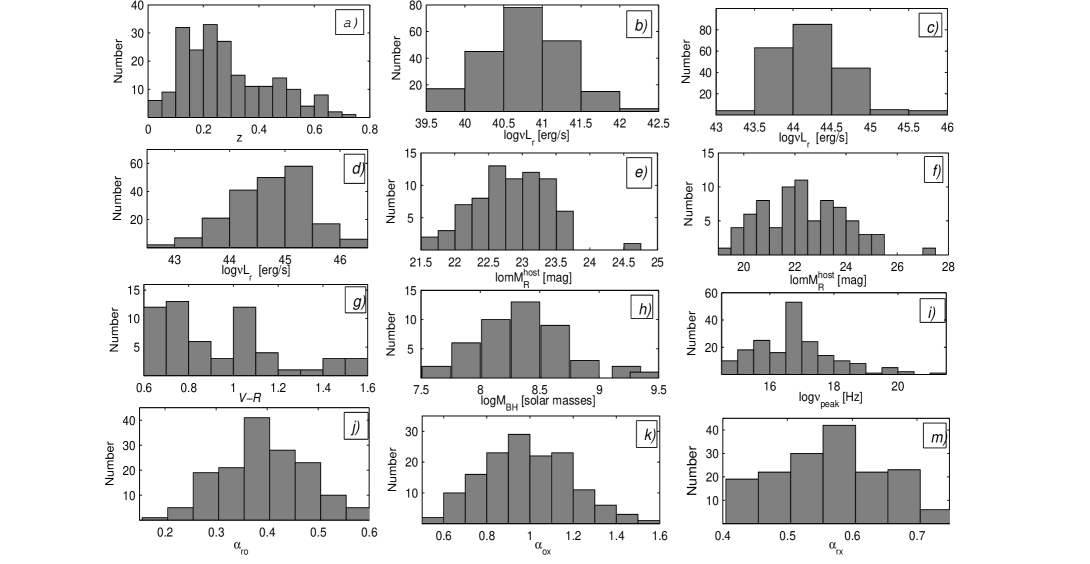
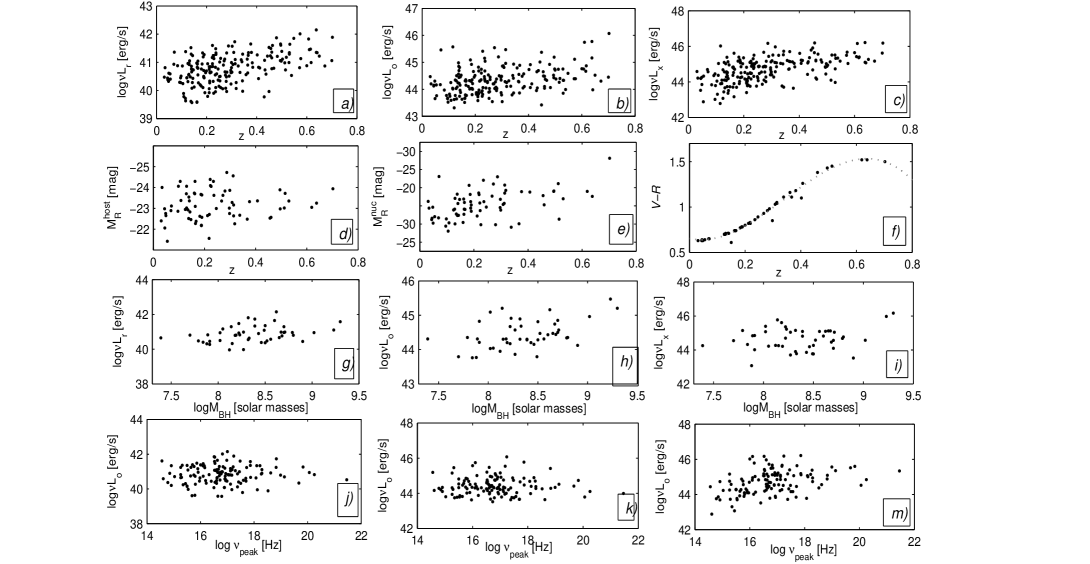
Figure 1 gives the distributions of different observational quantities: redshift, 1.4 GHz/V-band/ROSAT-band luminosities, host and nucleus R band absolute magnitudes, host V-R indices etc. Correlations between different quantities are given in Figure 2.
Redshifts:only 207 XBLs (66.3% of total sample) have
confirmed redshifts. They range from z=0.031 (Mrk 421) to z=0.702
(H151+660) with a peak of the distribution at z=0.23 (Fig1a). About
37% of the sources are concentrated within z=0.1 - 0.3, and 88% of
the sources have z<0.5. Redshifts of 105 sources remain still
either undetermined or not confirmed due to absence or extremal weakness of the spectral lines in these sources.
Luminosities: common logarithms of 1.4 GHz isotropic
luminosities are distributed from 39.57 to 42.15 (erg/s) peaking at
erg/s (Fig1b). As for optical V band luminosities,
they are distributed from erg/s to
erg/s with a peak at erg/s (Fig1c). Finally, erg/s for ROSAT band X-ray luminosity that peaks
at erg/s (Fig1d). Radio/optical/X-ray luminosities
are found to be correlated with the redshift above the 99%
confidence level: correlation coefficient is equal to 0.53,
0.47, 0.58, respectively (Fig2a,b,c). In that case, we deal with an
evolution from distant ellipicals with powerfool nuclei to normal
elliptical galaxies. However, there is a significant scatters in the
correlations that are probably caused by the scatter in jet
directions (leading to the scatter in Dopper boosting of the
emission) and different brightness state.
Hosts/nuclei: up to now, the hosts only of 94 XBLS are
detected. As a rule, they are elliptical galaxies with effective
radii kpc and ellipticity .R band absolute magnitude range from -21.11 mag to -24.72
(Fig1e). The distribution peaks at mag and its mean is
-22.83 mag. The nuclei show much broader range of R band absolute
magnitudes - they are distributed from -19.21 mag to -27.24 mag with
a peak at mag (Fig1f). There is a negative correlation
with a redshift ()above 99% confidence level (Fig2e)
indicating thus a trend of increasing luminosities towards greater redshifts.
V-R indices of the hosts: this quantity ranges from 0.61 to
1.52 and show three different peaks at V-R=0.73, V-R=1.08, and
V-R=1.50 (Fig1g). If confirmed, this may related to the three
"waves" in a birth of elliptical galaxies. However, it may be caused
by poor dataset - V-R indices are available for only 59 sources.
They show a strong positive correlation with the redshift (r=0.97,
>99% confidence level; Fig2f) explained with a redshifted emission of
passively evolving elliptical galaxies with an old stellar
population (see [22]). This correlation, fitted well with a
third-order polinom (see [13]) may be used to evaluate the
redshifts of that XBLs whose V-R indices are derived photometrically
but their z values remain either unknown or controversial.
Masses of central BHs: according to the widely accepted
scenario, BLLs consist of supermassive BHs in their nuclei whose
masses are estimated mainly via the velocity dispersions in their
hosts. values are currently estimated for 47
XBLs which range from 7.39 to 9.30 (Fig1h). A peak of the
distribution is found to be at . These
values do not show a correlation with a redshift. However, there are
weak but statistically significant correlations between and 1.4 GHZ/V band luminosities (Fig2g,h).
Synchrotron peak frequencies: peak frequencies of
synchrotron SEDs (radio to UV/X-ray frequencies) are currently
determined for 187 XBLs. They range from Hz to
Hz with a peak of the distribution at
Hz (Fig1i). It seems that a subclass of
ultra-high peaked BLLs (UHBLs) with should be
an artifact of the poor datasets of multifrequency flux values used
for constructing the SEDs of these sources. Among 22 UHBLs, provided
in [16], 13 sources are proven to have much lower peak
frequencies in [13]. ROSAT band X-ray luminosity shows a
positive correlation () with synchrotron peak frequencies
while those for 1.4 GHz and V band do not reveal any trend
(Fig2j,k,m, respectively). This means a trend of increasing
bolometric luminosity towards greater values. This
result is in contradiction the picture of [7] about the
desreasing power along the sequence LBLs IBLs
HBLs that is explained in [4] as a cosmological
result of gradual depletion of circumnuclear material
causing a decreasing jet power along this sequence.
Broadband spectral indices: radio-to-optical indices are
distributed from 0.17 to 0.59, peaking at . The
range of optical-to-X-ray indices is much broader: with a peak of the distribution at . As
for radio-to-X-ray indies, they span from to
and peak at . The corresponding
figures are Fig1j, Fig1k, and Fig1m, respectively.
Flux variability: Almost 60% of the XBLs are not
investigated for multivavelength flux variability. The best studied
are only brightest XBLs 1ES 2155-304 (since 1890)and Mrk 421 (since
1900). Only several sources have a history of the observation
greater than three decades. XBLs show basically erratical
variability changing duration, amplitude and base flux level
from flare to flare. Periodical changes are reported very rarely,
e.g. flares with 420 d period in 1ES 2321+419 through 1.5-12 keV
band was reported in [20]; quasi-periodical flares of 3.2 yr
duration in 1ES 1028+511 through optical R band, reported in
[12] etc. There is a trend of increasing overall range of
optical variability towards shorter wavelengths ([13]):
mag (18 sources),
mag (66 sources),
mag (28 sources). At the
intra-night timescales, XBLs are less active compared to RBLs in the
optical domain: flickerings with mag/night
were recorded for several times while there are much more occasions
and higher amplitudes in the case of RBLs. The reason is yet unclear
and can not be simply related to the different jet orientation to
the observer of these two BLL subclasses that could
lead to the different boosting in the observed flux.
Summary and Conclusions
In this talk, I have presented a catalogue of 312 XBLs, updated to mid-2010. In the future, we may expect that the number of XBLs will grow on the expense of XBL candidates (106 sources) which may not be assumed as BLL sources mainly due to the lack of high signal-to-noise ratio optical spectra. XBLs are the extragalactic sources with and with the common logarithms of radio/optical/X-ray luminosities of 39-42, 43-45, and 42-46 erg/s order, respectively. These sources show a trend of increasing luminosity towards distant objects that has a deep cosmological implication - there is an evolution from distant elliptical galaxies with powerful nuclei into the ellipticals without active nuclei. However, this correlation may be related simply to the selection effect - great number of distant BLLs may be exist whose apparent fluxes are below the detection threshold of current observing technique. XBL hosts are elliptical galaxies with effective radii of kpc and while the nuclei reveal much broader range of optical absolute magnitude of (-19.93, -27.24). indices of the hosts reveal a third order polynomial relationship with . values range with almost two order of the masses up to maximum value of 9.30 and do not show a correlation with a redshift. But they show positive correlations with radio and optical luminosities that may serve as an argument of the Blandford-Znajek mechanism of jet production. Bolometric luminosities do not show an decreasing trend towards higher synchrotron peak frequencies, as it was shown in some previous works, and the blazar sequence may not be simply explained by the hypothesis od depleting circumnuclear material along this sequence. As for Synchrotron peak frequencies Hz with a mean value of 16.76. We are also far from perfect understanding both of the character of multiwavelength flux variability and the nature of unstable processes, responsible for these variations.
Acknowledgement
I would like to thank Ganna Ivashchenko for my invitation. My participation in the conference is supported by the Shota Rustaveli Science Foundation grant N3/15.
References
- [1] Bade N., Engels D., Fink H. et al. Astron. Astrophys., V. 254, pp. 21-24 (1992)
- [2] Beckmann V. ’Evolutionary behaviour of AGN: Investigations on BL Lac objects and Seyfert II galaxies’, PhD Thesis, University of Hamburg Press, p. 13 (2000)
- [3] Blandford R. D., Rees M. J. in Pittsburgh Conference on BL Lac Objects,University of Pittsburgh Press,pp. 341-347 (1978)
- [4] Cavaliere A., D’Elia V. Astrophys. J., V. 571, pp. 226-233 (2002)
- [5] Della Ceca R., Maccacaro T.,Caccianiga A. et al. Astron. Astrophys., V. 428, pp. 383-399 (2004)
- [6] Elvis M., Plummer D., Schachter J., Fabbiano G. Astrophys. J. Suppl. Ser., V. 80, pp. 257-303 (1992)
- [7] Fossati G., Maraschi L., Celotti A. et al. MNRAS, V. 299, pp. 433-448 (19988)
- [8] Gioia I. M., Maccacaro T., Schild R. E. et al. Astrophys. J., V. 283, pp. 495-511 (1984)
- [9] Gioia I. M., Maccacaro T., Schild R. E. et al. Astrophys. J. Suppl. Ser., V. 72, pp. 567-619 (1990)
- [10] Giommi P., Tagliaferri G., Beuermann K. et al. Astrophys. J., V. 378, pp. 77-92 (1991)
- [11] Hoffmeister K. Astron. Nachr., V. 236, pp. 233-246 (1929)
- [12] Kapanadze B. Z. MNRAS, V. 398, pp. 832-840 (2009)
- [13] Kapanadze B. Z. Astron. J., V. , pp. (submitted) (2011)
- [14] Maccacaro T., Gioia I. M.; Zamorani G. Astrophys. J., V. 253, pp. 504-511 (1982)
- [15] MacLeod J. M., Andrew B. H. Astrophys. Lett., V. 1, pp. 243-247 (1968)
- [16] Nieppola E., Tornikoski M., Valtaoja E. Astron. Astrophys., V. 445, pp. 441-450 (2007)
- [17] Oke J. B., Neugebauer G., Becklin E. E. Astrophys. J., V. 156, pp. 41-43 (1969)
- [18] Oke J. B., Gunn J. E. Astrophys. J., V. 189, pp. 50-53 (1974)
- [19] Racine R. Astrophys. J., V. 159, pp. 99-103 (1970)
- [20] Rani B., Wiita P. J., Gupta A. C.Astrophys. J., V. 696, pp. 2170-2170 (2009)
- [21] Schmitt J. Nature, V. 218, pp. 663-664 (1968)
- [22] Urry C. M., Scarpa R., O’Dowd M. et al. Astrophys. J., V. 532, pp. 816-829 (2000)
- [23] Viswanathan N. Astropys. J., V. 155, pp. 133-137 (1969)
- [24] Wurtz R. E. ’The Host Galaxies and Galaxy Clustering Environments of BL Lacertae Objects’, PhD Thesis, University of Colorado Press (1994)
- [25] Wood K. S., Meekins J. F., Yentis D. J. et al. Astrophys. J. Suppl. Ser., V. 56, pp. 507-649 (1984)