Resolving the Galaxies within a Giant \lya Nebula: Witnessing the Formation of a Galaxy Group?
Abstract
Detailed analysis of the substructure of Ly nebulae can put important constraints on the physical mechanisms at work and the properties of galaxies forming within them. Using high resolution HST imaging of a \lya nebula at , we have taken a census of the compact galaxies in the vicinity, used optical/near-infrared colors to select system members, and put constraints on the morphology of the spatially-extended emission. The system is characterized by (a) a population of compact, low luminosity () sources — 17 primarily young, small ( kpc), disky galaxies including an obscured AGN — that are all substantially offset (20 kpc) from the line-emitting nebula; (b) the lack of a central galaxy at or near the peak of the \lya emission; and (c) several nearly coincident, spatially extended emission components — \lya, Heii, and UV continuum — that are extremely smooth. These morphological findings are difficult to reconcile with theoretical models that invoke outflows, cold flows, or resonant scattering, suggesting that while all of these physical phenomena may be occurring, they are not sufficient to explain the powering and large extent of \lya nebulae. In addition, although the compact galaxies within the system are irrelevant as power sources, the region is significantly overdense relative to the field galaxy population (by at least a factor of 4). These observations provide the first estimate of the luminosity function of galaxies within an individual \lya nebula system, and suggest that large \lya nebulae may be the seeds of galaxy groups or low-mass clusters.
Subject headings:
galaxies: evolution — galaxies: formation — galaxies: high-redshift1. Introduction
Giant (100 kpc), radio-quiet \lya nebulae (or \lya “blobs”) that have been discovered in the distant universe by virtue of their extremely luminous \lya emission (erg s-1) are thought to be regions of ongoing massive galaxy formation. When studied in detail, these systems show complex morphologies, obscured active galactic nuclei (AGN) and/or associated star-forming galaxies (e.g., Francis et al., 1996; Ivison et al., 1998; Steidel et al., 2000; Palunas et al., 2004; Chapman et al., 2004; Matsuda et al., 2004, 2007; Basu-Zych & Scharf, 2004; Dey et al., 2005; Geach et al., 2007; Smith et al., 2008; Prescott et al., 2009; Ouchi et al., 2009; Yang et al., 2011). There is strong evidence that the largest Ly nebulae are rare (Saito et al., 2006; Yang et al., 2009, 2010; Prescott, 2009; Matsuda et al., 2011) and typically reside in the most overdense regions of the Universe (e.g., Palunas et al., 2004; Matsuda et al., 2004, 2005, 2009; Saito et al., 2006; Prescott et al., 2008; Yang et al., 2009).
Unlike \lya halos observed around quasars and radio galaxies (e.g., McCarthy 1993, and references therein; Weidinger et al. 2005; Miley et al. 2006; Barrio et al. 2008; Smith et al. 2009), the dominant power source responsible for these radio-quiet \lya nebulae has been difficult to determine. Studies have investigated whether \lya nebulae could be powered by galactic superwind outflows (e.g., Taniguchi & Shioya, 2000; Taniguchi et al., 2001; Mori et al., 2004), photoionization by obscured AGN or star formation (e.g., Chapman et al., 2004; Basu-Zych & Scharf, 2004; Geach et al., 2007, 2009; Prescott et al., 2009), or gravitational cooling within cold filaments (“cold flows”; e.g., Nilsson et al., 2006; Smith & Jarvis, 2007; Dijkstra & Loeb, 2009; Goerdt et al., 2010; Faucher-Giguère et al., 2010), but have come to a range of conclusions. It has also been suggested that the large extent of \lya nebulae could be due to resonant scattering of \lya photons from a central source, with recent work providing observational evidence for this effect around Lyman-break galaxies (Steidel et al., 2011). Thus, despite considerable study, the mechanisms responsible for the copious \lya emission and the large extent of \lya nebulae have remained controversial.
The question of the substructure of \lya nebulae has received much less attention, but it is a topic that can provide much-needed complementary clues to the origin of \lya nebulae as well as to what they ultimately evolve into. As the potential physical mechanisms responsible for powering the \lya emission each have morphological implications, studying the morphology of the spatially-extended emission on kiloparsec and sub-kiloparsec scales can provide insight into the processes at work and the underlying powering mechanism in \lya nebulae. In addition, taking a complete census of the diffuse and compact sources within \lya nebulae and studying the relative positions and properties (luminosities, colors, morphologies, sizes) of the galaxies that reside within them is valuable for establishing the evolutionary state of these dynamic systems. Doing all of this, however, requires determining the membership of these crowded regions either with spectroscopy (typically feasible only for the brightest knots) or deep, high resolution imaging that can resolve and put constraints on the spectral energy distribution (SED) of faint individual sources. As yet, very few radio-quiet \lya nebulae have been imaged with HST, and those that have typically lack the critical high resolution constraints above the Balmer break.
In this paper we study the sub-kiloparsec structure of a giant \lya nebulae at using high-resolution imaging from HST. This \lya nebula was discovered thanks to its extreme Spitzer/MIPS 24µm emission and its extended morphology in broad-band imaging (LABd05; Dey et al., 2005, hereinafter Paper I). Roughly 20″ (160 kpc) in size with a \lya luminosity of 1.71044 erg s-1, LABd05 rivals other known \lya nebulae in energetics and complexity. The data presented in Paper I revealed at least three important components (and potential sources of ionization) in the system: (1) the strong 24µm source, likely dominated by an obscured AGN, (2) a Lyman break galaxy to the northeast of the nebula, and (3) a source that does not have a counterpart in the ground-based imaging but that was identified near the center of the \lya emission due to the presence of narrow, spatially unresolved Heii1640 and Civ1548,1550 emission lines in the ground-based spectrum. Follow-up narrow-band imaging of the surrounding environment revealed that LABd05 resides within a very large filamentary structure at least 50 comoving Mpc in size (Prescott et al., 2008), and imaging polarization observations have demonstrated that the \lya emission is not strongly polarized (, ; Prescott et al., 2011), hinting that scattering may not be significant in this source.
While revealing, our previous studies were limited by ground-based resolution and depth, and our resulting knowledge of the system was incomplete. First, at ground-based resolution, it was unclear whether the system hosted other compact galaxies and whether the \lya itself contained a compact central source or was clumpy on small scales. Second, it was unclear whether the 24µm source and the Lyman break galaxy were important power sources for the \lya nebula. The geometry of the system, with both the 24µm source and the Lyman break galaxy offset from the centroid of the \lya by 25 (20 kpc in projection), argued against this possibility, and the observed SED of both sources suggested that, barring inhomogeneous obscuration, they were unlikely to power more than 20% of the \lya emission. Finally, the source of the unresolved Heii and Civ emission, which appeared to be centered within the \lya emission, was uncertain. While Heii and Civ emission often indicate shock excitation or a hard ionization source, no central galaxy (that could be driving shock-heating via a superwind) was visible in the ground-based imaging and furthermore the measured line ratios were inconsistent with shocks.
In the present work, we use high resolution HST/ACS and NICMOS imaging to take a census of the compact sources within the system, measure their luminosities, morphologies, and locations relative to the line-emitting gas, investigate the question of the location and morphology of the Heii-emitting region, and determine the morphology of the \lya nebula itself. In Section 2 we describe our observations and reductions, and in Section 3 we present our results on the different components of the \lya nebula system. Section 4 summarizes what we have learned about the small-scale morphology of LABd05 and explores the implications of these findings for our understanding of what causes the \lya nebula phenomenon. We conclude in Section 5. In this paper, we assume the standard CDM cosmology (=0.3, =0.7, =0.7); the angular scale at is 7.96 kpc/″. All magnitudes are in the AB system (Oke, 1974).
2. Observations & Reductions
Paper I examined the properties of LABd05 using Keck/LRIS spectroscopy, optical imaging from the NOAO Deep Wide-Field Survey (NDWFS; Jannuzi & Dey, 1999), and Spitzer/IRAC and MIPS imaging (Eisenhardt et al., 2004; Houck et al., 2005). The large-scale environment of LABd05 was studied using Subaru/SuprimeCam intermediate-band \lya imaging (Prescott et al., 2008), and constraints on the \lya polarization of the system were obtained using imaging polarimetry with the Bok Telescope and the SPOL CCD Spectropolarimeter (Prescott et al., 2011). In this paper, we add high resolution HST/ACS and NICMOS imaging to study the small-scale morphology and local environment of LABd05. Table 1 lists the instruments, filters, and total exposure times for the HST imaging. Figure 1 shows selected postage stamps from the multi-wavelength dataset used in this work.
2.1. HST ACS Data
We obtained HST Advanced Camera for Surveys (ACS) imaging of LABd05 on UT 2006 January 13, 14, and 24 using the () filter and two 2% ramp filters, (centered on \lya at z2.7) and (centered on Heii1640 at z2.7).111HST Cycle 14; GO 10591 Basic image calibrations (overscan, bias, and dark subtraction, flat-fielding) were provided by the standard HST ACS pipeline with On-The-Fly-Reprocessing (OTFR) and the task calacs. We removed a residual offset in the bias level of the individual amplifiers on each of the ACS detectors (roughly a 2% effect relative to the background) by estimating the sky background in each amplifier separately using a sigma-clipped mean and subtracting it from the calibrated, flat-fielded individual exposures (the “_FLT” files). Using MultiDrizzle’s default settings and no additional sky subtraction, we performed the distortion correction, cosmic-ray rejection, and image combination, yielding a final scale of 0.05″/pixel and a field-of-view of 207″205″. The point-spread-function (PSF) size for the ACS imaging is FWHM=0.07″, as measured using the TinyTim PSF emulator.222TinyTim: http://www.stsci.edu/hst/observatory/focus/TinyTim. The 5 point source limiting magnitudes for the ACS imaging are 28.3, 25.7, and 25.7 mag (0.4″ diameter aperture) for the F606W, FR462N, and F601N filters, respectively.
The narrow-band \lya and Heii imaging contain both line and continuum emission. To generate HST line-only \lya and Heii images, we scaled the image by factors of 42.9 and 22.9, respectively (estimated empirically based on sources common to both images) and subtracted the result from the original narrow-band images. The resulting HST line-only \lya and Heii images are discussed in Sections 3.2.1 and 3.2.2. To quantify the degree to which the Heii and Civ emission lines in turn contaminate the -band, we measured the total flux within the same spectroscopic aperture (″) used in Paper I to measure the Heii and Civ fluxes, after convolving the image to match the ground-based seeing (FWHM=1″). Comparing the total flux in the aperture ( erg s-1 cm-2) to the reported Heii and Civ line fluxes ( and erg s-1 cm-2, respectively; Paper I), we find that the Heii and Civ emission lines together contribute a small fraction of the -band flux within this aperture (%), and therefore we do not apply a correction to the image.
2.2. HST NICMOS Data
Using the NICMOS NIC2 camera on HST, we obtained high-resolution imaging of the source in the () and () filters — filters which at z2.7 bracket the Balmer/4000Å break. The observations were taken during UT 2006 March 25 and 31, using a NIC-SPIRAL-DITH spiral dither pattern (3 point pattern with 0.6375″ point spacing).333HST Cycle 14; GO 10591 The data were reduced primarily using NICRED (Magee et al., 2007). Once the data were calibrated and corrected for electronic ghosts, pedestal, cosmic ray persistence, and count-rate non-linearity, we made the final image mosaics using MultiDrizzle (Jedrzejewski et al., 2005) and a set of custom bad pixel masks. The final images were supersampled to match the ACS pixel scale (0.05″/pixel) and have a field-of-view of 20″20″. The PSF sizes are FWHM=0.09″ and 0.13″, as measured using the TinyTim PSF emulator, and the 5 point source limiting magnitudes are 27.2 and 27.1 mag (0.4″ diameter aperture) for the and imaging, respectively.
2.3. Subaru Suprime-Cam Data
In this work, we make use of deep Subaru \lya imaging that was obtained previously by Prescott et al. (2008) using the Subaru telescope and the SuprimeCam wide-field imager (Miyazaki et al., 2002). These observations used an intermediate-band filter (4458Å, 201Å), centered on the \lya line at the redshift of the nebula. The limiting magnitude of the \lya image is 26.6 mag (5 in a 2″ diameter aperture). Additional details on the observations and data reduction can be found in Prescott et al. (2008).
We generated a Subaru line-only \lya image by subtracting off a smoothed version of the ACS -band image. From the ground-based spectroscopy, we know that the source labeled “A” in the NDWFS image (Figure 1) is a Lyman Break galaxy (LBG) at the redshift of the system and shows little if any \lya emission or absorption (Paper I). A correct continuum subtraction should therefore leave the LBG with zero flux in the Subaru line-only \lya image. We smoothed the image to match the PSF of the \lya image (FWHM=0.7″), resampled to the same pixel scale as the \lya image, measured the flux of the LBG in both the \lya and -band image (using a 1.0″ diameter aperture), scaled the to match the flux of the LBG in the \lya image, and subtracted the two to create a continuum-subtracted \lya image. Since the is a rather crude approximation to the continuum in the \lya image, the accuracy of this continuum subtraction will vary with source color. We note that for all the galaxies at the redshift of the system, the subtraction should be relatively accurate; those that show residual emission in the \lya image are likely \lya-emitters themselves. On the other hand, in the case of a known interloper galaxy at (labeled ‘B’ in Figure 1; Paper I), we expect our continuum subtraction procedure to overestimate the continuum (since at this redshift the -band is sampling the continuum shortward of \lya which is typically depressed due to the \lya forest). This is consistent with the slight evidence of oversubtraction that we see at the position of the interloper galaxy (Figure 2).
2.4. Image Registration
To ensure accurate image registration, we generated catalogs of source positions in each image using SExtractor (Bertin & Arnouts, 1996) and registered all images to the NDWFS frame using the IRAF tasks ccmap and ccsetwcs. We carried out the registration in three steps. First, the ACS was convolved with a Gaussian kernel to match the PSF of the image (FWHM=0.98″). We registered the smoothed ACS image to the NDWFS image, applied the solution to the unsmoothed ACS image, and then registered the ACS Heii, NICMOS , and NICMOS images to the unsmoothed ACS image. Finally, we registered the ACS \lya image to the ACS Heii image and the Subaru image to the NDWFS image. This sequential procedure was used to maximize the number of common sources available to compute the astrometric solution for each image pair and to avoid compounding registration errors. Table 2 details the number of sources used in the registration and the final estimated astrometric uncertainty relative to the NDWFS image. The NDWFS astrometry is tied to a frame defined by stars in the USNO-A2.0 catalog.
3. The Components of the Nebula
Our multi-wavelength observations show that LABd05 contains a number of compact galaxies, diffuse rest-frame UV continuum emission, smooth \lya emission, spatially-extended Heii emission, and an obscured AGN - all within a 10″ region. In this section, we explore each component of the \lya nebula system in detail. In Section 4, we summarize the key morphological characteristics of this system and discuss the implications of these results for our understanding of the physical mechanisms at work in \lya nebulae, their evolutionary state, and the properties of the galaxies forming within them.
3.1. Compact Sources
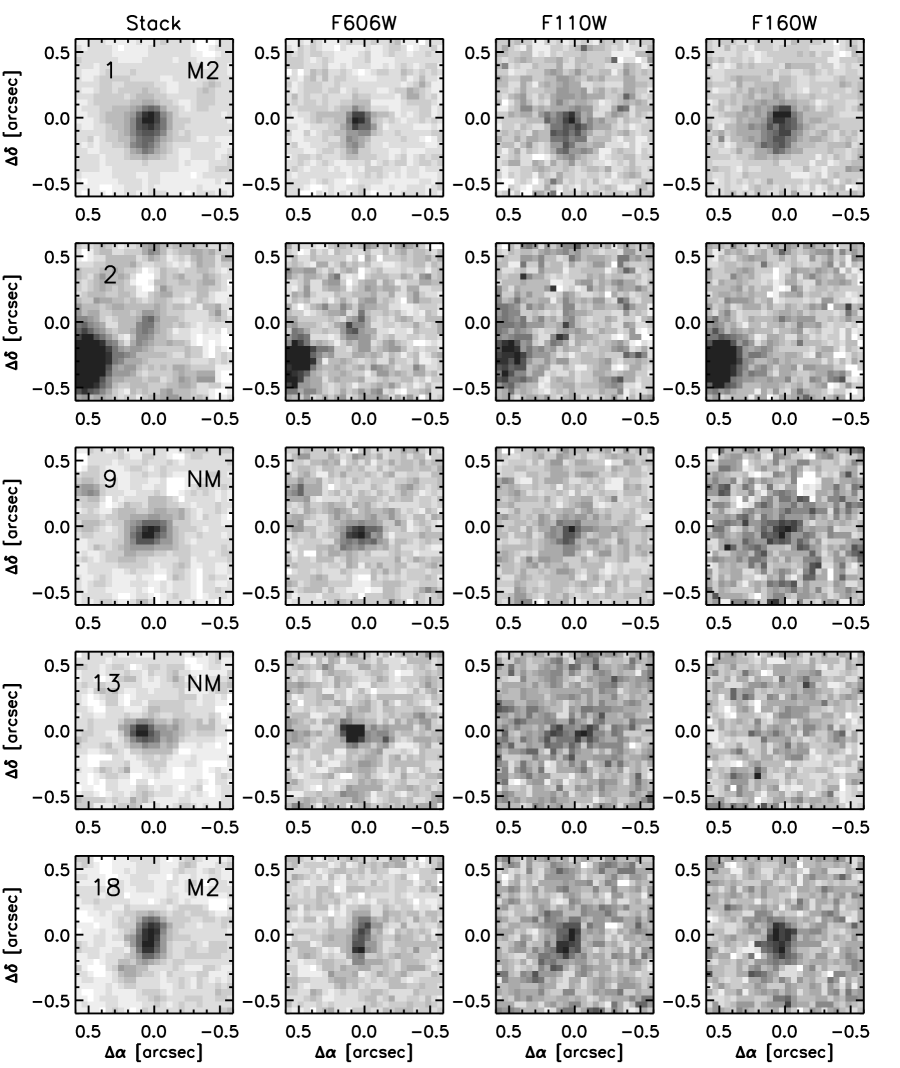
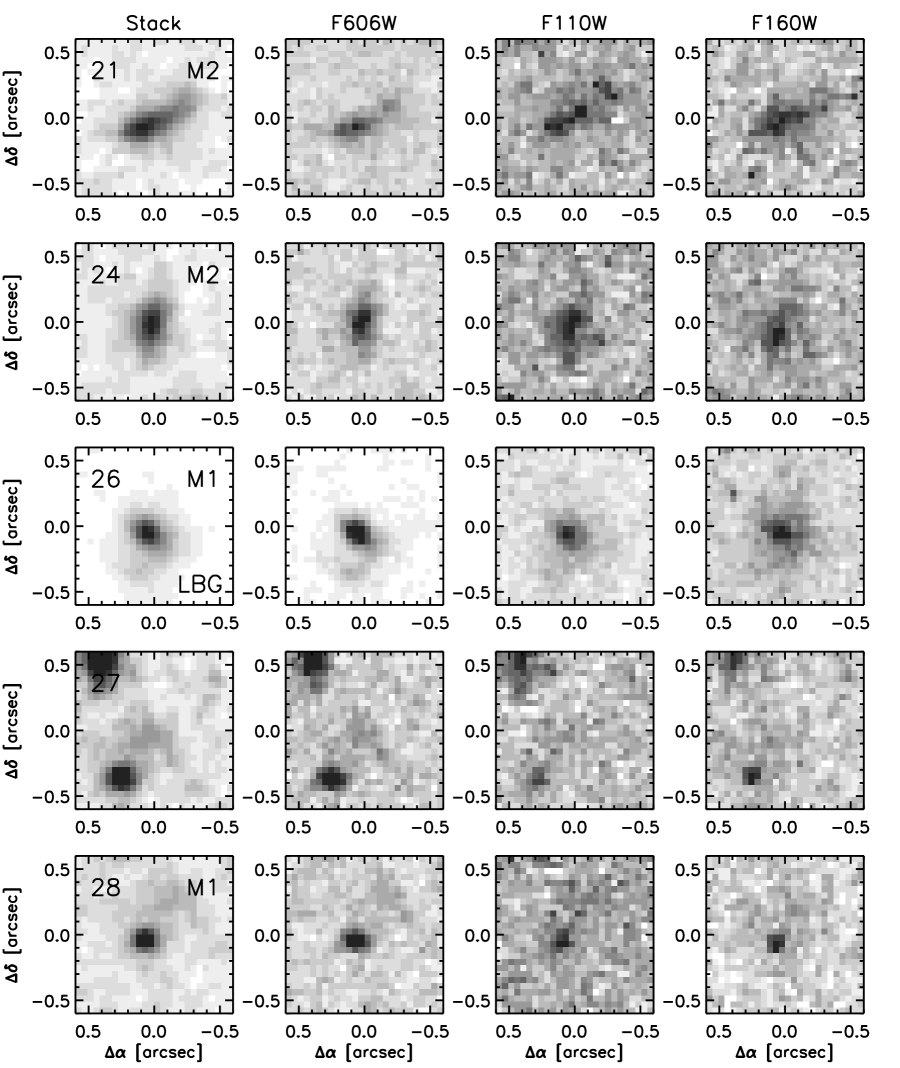
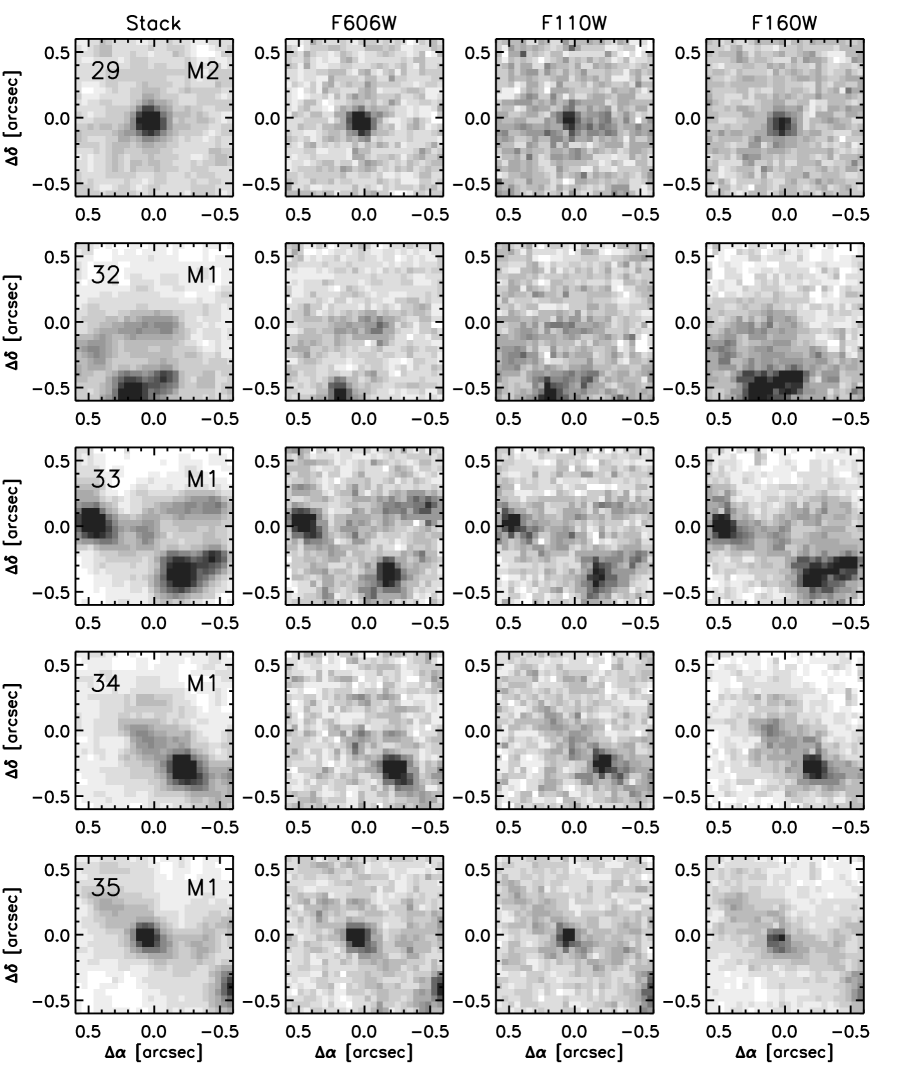
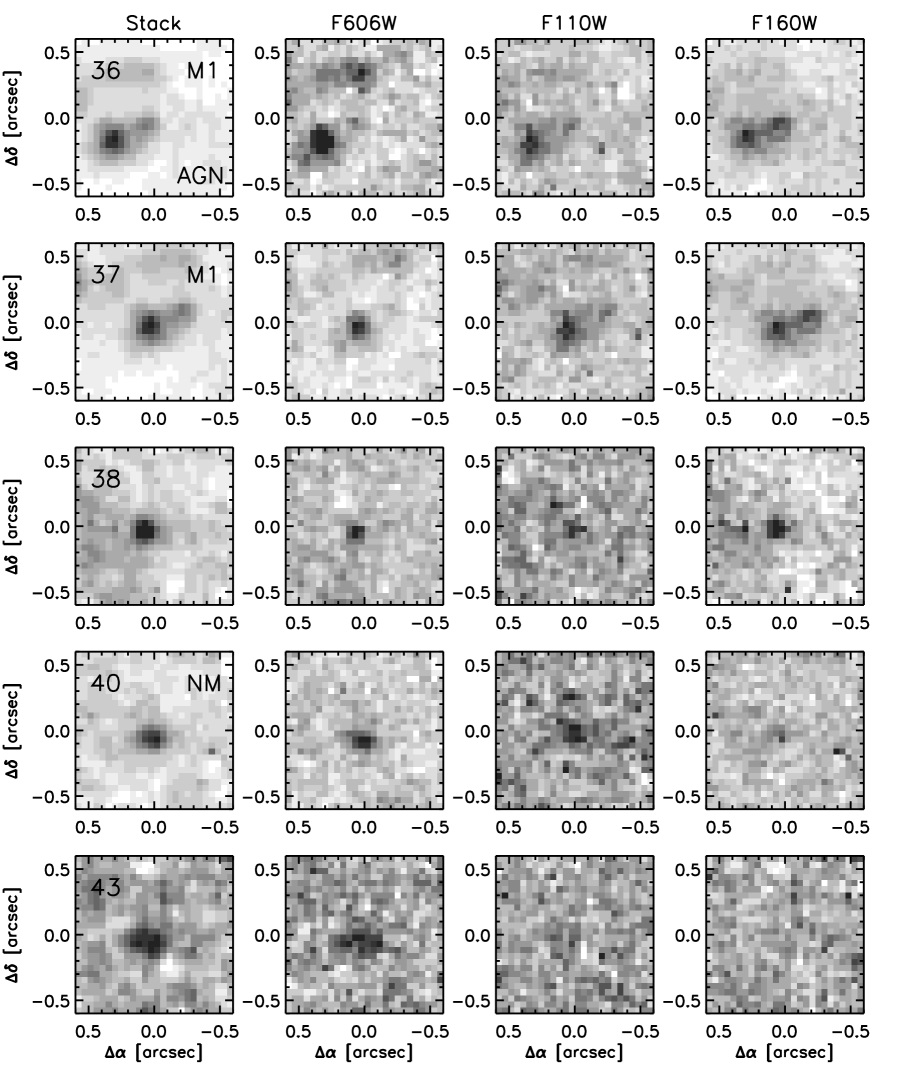
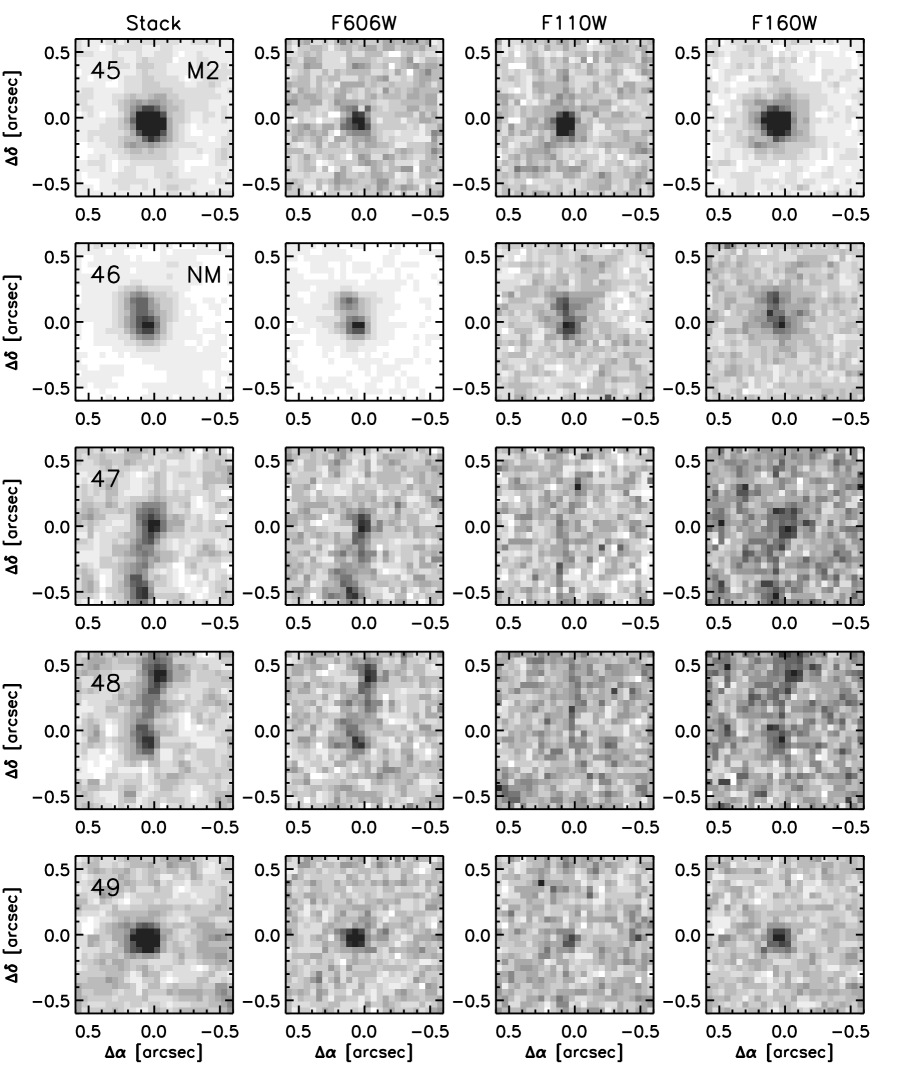
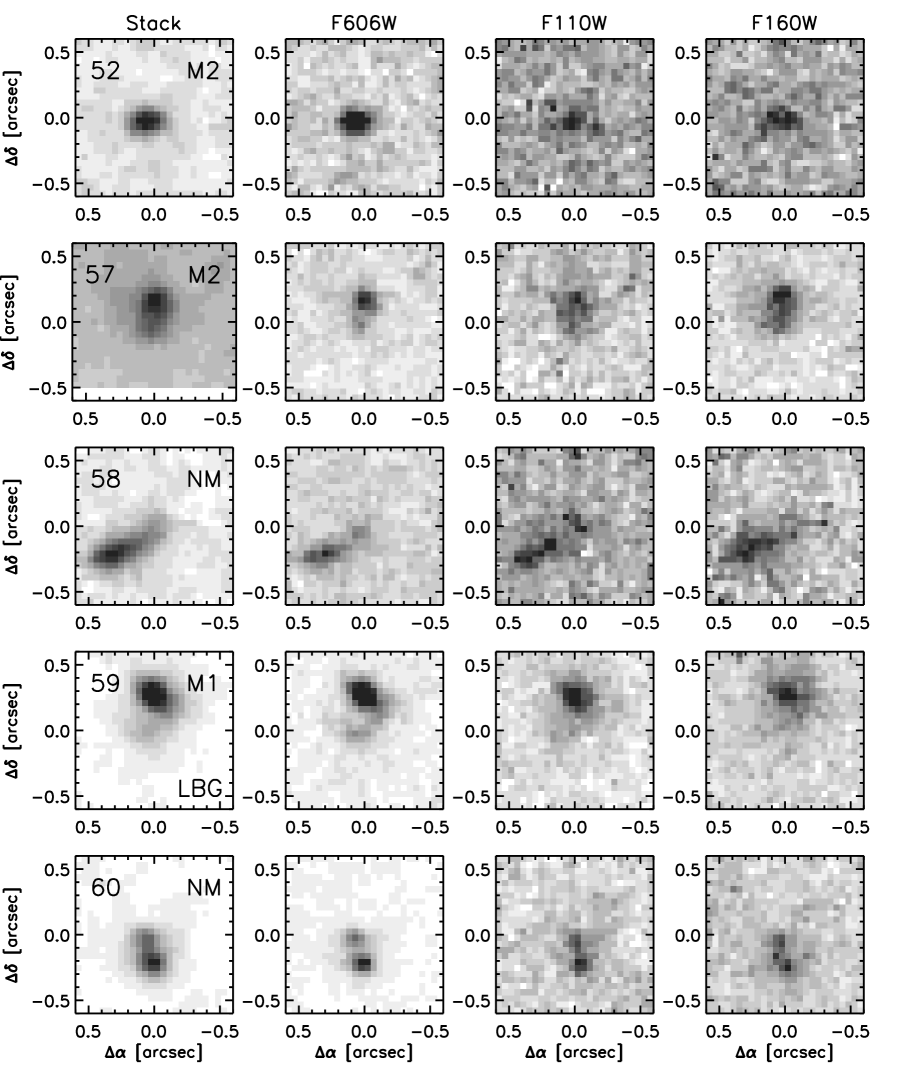
To determine the relative positions of all the sources in the vicinity of the \lya nebula we created a composite stack of the , , and images, after convolving the and -band images to the same PSF as the image and dividing each image by the variance of the sky. We generated an initial list of source positions in the image stack using SExtractor (3 threshold, minimum contiguous area of 4 pixels; Bertin & Arnouts, 1996). All sources within 7″ that are detected above the limiting magnitude in the band are labeled with ID numbers in Figure 2. We then generated an additional catalog of sources positions using the unconvolved -band image and the same parameters. This “-only” catalog is necessary for our analysis of the number counts in the vicinity of LABd05 and the associated completeness corrections (Sections 3.1.1 and 4.2.1). In four cases (#1, 21, 26, and 46) where SExtractor did not deblend an apparent close object pair, we manually added a second source position to the catalog (#57, 58, 59, and 60, respectively), as described in Section 3.1.4. The current data are not sufficient to distinguish whether these objects are true companions or just morphological peculiarities (i.e., tidal features, dust lanes, etc.) associated with the primary object. We choose to treat these pairs as separate objects; however, combining them does not significantly change our conclusions. Individual postage stamps extracted from the image stack as well as the , , and -band imaging are shown for all sources in Appendix A.
3.1.1 Optical and Near-Infrared Photometry
We measured aperture photometry (0.4″ diameter apertures) in all three bands using the original unconvolved images and the positions derived from the image stack. The aperture size was chosen in order to contain as much flux as possible while minimizing contamination from neighboring sources. Aperture corrections of [1.15, 1.52, 1.76] were computed using the TinyTim PSF emulator and applied to the , , and photometry, respectively. The resulting photometry is given in Table 3.
Without knowing the intrinsic colors of sources as a function of magnitude, it is difficult to estimate the completeness of the stacked catalog. Instead, we measured the completeness in the -band alone using the standard approach. First, we generated simulated galaxies, modeled as Gaussian profiles with ″ (1 kpc, the typical size of non-member sources in the field; Section 3.1.4). We then inserted the simulated galaxies into the -band imaging. We generated a “-only” source catalog in the same manner as above and computed the completeness of our approach as a function of input magnitude. The 80% and 50% completeness limits are 27.6 and 28.0 mag in the band, respectively.
3.1.2 The Obscured AGN
Paper I postulated the existence of an obscured AGN at the position of the MIPS source based on the strong 24µm emission and the shape of the full SED. The corresponding detections in the IRAC bands agreed with the MIPS source position to within the astrometric uncertainty (05) and showed that the source had a power-law SED in the mid-infrared, characteristic of an obscured AGN (e.g., Alonso-Herrero et al., 2006). Later IRS spectroscopy demonstrated that the infrared source is at the redshift of the \lya nebula (Colbert et al., 2011), and millimeter and submillimeter observations have confirmed that the full SED is best approximated by a Mrk 231 (i.e., AGN-dominated) template (Bussmann et al., 2009; Yang et al., 2012). In Paper I, the physical location of the AGN within the system was uncertain due to the lower resolution of the IRAC and MIPS imaging, but the centroid of the mid-infrared emission appeared to be offset to the north of the brightest \lya emission. The addition of the HST/NICMOS imaging revealed an extremely red source (#36) located at the centroid of the MIPS 24µm emission (Figure 1) that is very centrally concentrated (Section 3.1.4). This source shows a strong Balmer/4000Å break — it is barely detected in and but very bright in — and is one of the 17 sources flagged as members of the system (Section 3.1.3). It is located in a crowded region, with 5 close neighbors within 1.5″ (12 projected kpc), and diffuse emission visible in the NICMOS band, suggestive of an ongoing merger. Since it is plausible to assume that the AGN lies near the deepest part of the gravitational potential well of this system, we will take the position of source #36 as the center of the system for our subsequent analysis. The measured projected offset between the AGN and the centroid of the \lya emission (Section 3.2.1) is 1.9″ (15 kpc).
3.1.3 Assessing System Membership
Only two compact sources were previously identified from ground-based imaging (Paper I; see NDWFS image in Figure 1). At the Northeast corner of the system is a compact source — labeled “Galaxy A” in Paper I — that ground-based spectroscopic follow-up showed to be an LBG at the redshift of the system. The source at the Southwest corner — named “Galaxy B” in Paper I — was argued to be an interloping system based on the identification of \lya at in the ground-based spectrum. The high resolution HST imaging resolves both of these objects into two components: Galaxy A is associated with objects #26 and 59 and Galaxy B contains knots #46 and 60 (see Section 3.1.4 and Appendix A). Since the spectroscopic identification was done using ground-based spectroscopy that was unable to resolve the two components in each case, it is possible that these pairs are in fact due to chance coincidence. However, with separations of only (i.e., 1.6 kpc), chance projection is extremely unlikely, and the photometry shows that the colors of both components in each pair are similar. Given the ground-based spectroscopic redshift, the very small likelihood of a chance coincidence, and the similar colors, we will assume from here on that #26 and 59 are both associated with the \lya nebula system at and that #46 and 60 are both interlopers at .
To determine the membership of the remaining sources, we make use of the measured optical/NIR colors. Since the NICMOS and bands straddle the Balmer/4000Å break at the redshift of the nebula, sources within the system should show red colors if they have evolved enough with time. While a full SED-fitting approach would be poorly constrained with only three bands, we can use this fact to identify other sources that are likely associated with the system. We start by selecting the sample of sources that are within a radius of 7″ from the AGN (#36) and that are brighter than the limiting magnitude in all three bands. In Figure 3 we plot the versus colors of the resulting sample along with greyscale contours representing the expected color distribution of galaxies drawn from the field (taken from the Hubble Ultra Deep Field, HUDF, which used the same instrument and filters as this work; Coe et al., 2006). The subset of HUDF galaxies with photometric redshifts consistent with the systemic redshift to within typical photometric redshift errors () is shown with line contours. While a handful of sources have colors entirely consistent with being drawn from the field (i.e., they are near the peak of the HUDF greyscale), there is also a locus of objects that is broadly consistent with being at the systemic redshift (i.e., they are within the line contours) but that extends along a line roughly parallel to the reddening vector towards much redder colors. These red colors are quite unusual for typical field galaxies, a hint that this locus may be composed primarily of system members with varying amounts of dust.
In Figure 4, we plot the same sample alongside a series of age tracks for simple stellar population models (single unreddened bursts, solar metallicity) at as well as a constant star-forming model (solar metallicity) and a low metallicity model (), both at the systemic redshift (Bruzual & Charlot, 2003). We again see that the locus discussed above consists of sources that are consistent with the systemic redshift if we allow for a low to moderate amount of dust extinction ( mag). We draw a dividing line in color-color space with a slope parallel to the reddening vector in order to select sources that are consistent with the systemic redshift, given typical photometric errors. Those to the upper left of the line we consider “members” and those to the lower right, “non-members” (designated “NM”). As a check on the effectiveness of our approach, we apply the same color cut to the HUDF galaxy catalog and plot a histogram of the photometric redshifts for this sub-sample (Figure 5). The color cut is effective at selecting high redshift galaxies (90% are at ), and in contrast to the redshift distribution for the full HUDF sample, the photometric redshifts of HUDF galaxies selected using this simple color cut are peaked at the systemic redshift of LABd05 (). On the other hand, our color cut is clearly approximate. The comparison sample selected from the HUDF contains a small subset (10%) of galaxies with , which is consistent with the fact that for young ( Myr) single burst models the predicted colors at overlap those for higher redshifts. The color cut is also not able to reject the known interloper system at (#46 and #60, or Galaxy B). From Figure 5, this is not at all surprising, as the peak of the distribution is broad, spanning . Furthermore, the fact that the interloper system is located at the young end of the age tracks in color-color space (Figure 4) is consistent with the detection of \lya emission (Paper I).
We assess the robustness of our membership assignment further in Section 4.2.2. At this point, we subdivide the member sample based on the projected distance from the AGN (#36). The 9 sources within the radius of 2.1″ (chosen to include all spectroscopically confirmed members, #26, 59, 36) are considered to be members with high confidence and designated “M1”. The 8 members outside this radius are designated “M2”. In Figure 6, we see that all the member sources (circled) are offset by ″ ( projected kpc) from the peak of the \lya emission (Section 3.2.1), i.e., they effectively reside at the outskirts of the \lya nebula.
3.1.4 Sizes and Morphologies
Our next step was to use GALFIT (Peng et al., 2002) to derive sizes and morphologies for the sources within the vicinity of LABd05. Visual inspection of the image revealed that in addition to the many compact galaxies in the region, there is diffuse, spatially extended emission. In order to avoid biasing the fits for the compact sources, we began by subtracting off an approximate fit to this diffuse emission using GALFIT. We then fit all remaining compact sources within 7″ of the AGN that have a peak surface brightness brighter than 25.3 mag arcsec-2 and an isophotal magnitude brighter than 29.0 AB mag in the band. To speed up the process of fitting so many sources simultaneously, we performed the fits in small batches initially, i.e., fitting nearby sources at a time while masking the remaining sources. After experimentation showed that sources #1, 21, 26, and 46 were not being fit well using single components, sources #57, 58, 59, and 60, respectively, were manually added to the catalog. During the initial batch-fitting, the position of sources #57, 58, and 59 were then masked, while #60 was fit normally. Once appropriate fitting parameters had been determined for all sources, we performed a final run of GALFIT on the original image fixing all parameters for the compact sources to the pre-derived values. We allowed the few remaining special cases (#57, 58, and 59) as well as the diffuse continuum component to be fit freely by GALFIT. The entire fitting process was repeated using the fitting parameters derived for the diffuse continuum component in this final step as the initial guess for the first step. The resultant composite fit and corresponding residual images are shown in Figure 7. The centroids and morphological results for the compact sources derived from the band are given in Table 3 and for the diffuse component in Table 4. We discuss this diffuse UV continuum component in further detail in Section 3.2.3.
3.2. Diffuse Components
In addition to the population of compact sources, LABd05 hosts several nearly coincident diffuse emission components.
3.2.1 Diffuse \lya Emission
If the \lya nebula is powered by sources within the nebula itself, we would expect that to be reflected in the morphology of the \lya emission. We used the high resolution ACS \lya imaging to look for spatially resolved knots or clumps that could signal the locations of the ionizing sources for the nebula. However, we find that the morphology of the \lya nebula is smooth, with no significant substructure (Figure 8). At the depth of these observations we would have detected point-source regions down to a \lya flux of erg s-1 cm-2 (5 in 0.4″ diameter apertures) or \lya luminosity of erg s-1. This corresponds to a star-formation rate of yr-1 (assuming Case B, ; Kennicutt, 1998). We can also rule out high surface brightness clumps within the cloud down to a peak surface brightness limit of 4.010-16 erg s-1 cm-2 arcsec-2(3).
Deeper \lya imaging at ground-based resolution obtained with the Subaru Telescope showed that the \lya emission on larger scales has a smooth elliptical morphology that is well fit by an exponential disk profile. Using GALFIT, we derived a centroid, effective radius, Sérsic index, position angle, and axis ratio for the \lya emission (Table 4). The resulting surface brightness profile of the \lya emission is shown in Figures 9 and 10. Surface brightness profiles were also computed for both the Subaru \lya imaging and the ACS \lya imaging using the IRAF task ellipse, where the ellipse parameters were constrained to the centroid, single position angle, and axis ratio of the GALFIT parametric fit to the Subaru \lya imaging. In addition, we measured aperture photometry at the center of the nebula using a small aperture (1.6″ diameter) chosen to minimize contamination from neighboring compact sources (Table 4).
3.2.2 Diffuse He II Emission
From ground-based spectroscopy, LABd05 is known to have strong Heii and Civ emission (Paper I) located near the center of the \lya emission ([-0.9″,-2.5″]; Figure 11). The goal of our Heii imaging was to better localize the Heii-emitting region within the system, and given the depth of our observations, we would have detected the Heii emission at a if it were emitted as a point source. However, the ACS Heii imaging showed no detection down to a 5 point source limiting flux of erg s-1 cm-2 (0.4″ diameter aperture) and a 3 surface brightness limit of erg s-1 cm-2 arcsec-2 (Figure 11). While we cannot, therefore, pinpoint the location of the Heii emission beyond what was determined in Paper I, this non-detection does put a constraint on the size of the Heii-emitting region. To quantify this, we inserted a series of simulated Heii sources, modeled as Gaussian profiles scaled to match the measured Heii flux and a range of FWHM sizes of 0.11.0″, into the Heii image (Figure 11). For each of 100 Monte Carlo trials, we measured the observed flux of the simulated source () as a function of FWHM and determined the FWHM for which the simulated source is detected at , where is the limiting flux of the Heii image (0.4″ diameter aperture). We conclude that the source of Heii must be extended with a FWHM in order to be undetected in our Heii imaging. At the same time, the fact that the previous long-slit spectroscopy did not resolve the Heii line puts an upper limit of 1″ on its true spatial extent (Paper I). This size range corresponds to a Heii-emitting region that spans kpc at the redshift of the nebula. These constraints are summarized in Table 4.
3.2.3 Diffuse Continuum Emission
The broad-band ACS data revealed diffuse emission located near the center of the \lya nebula (Figure 7; Section 3.1.4). As Heii and Civ emission at the systemic redshift are located within the bandpass, and as the band also straddles \lya at the redshift of Galaxy B (the interloper system at ), we must first address the question of whether this diffuse -band emission could be dominated by line emission. However, as we showed in Section 2.1, the Heii and Civ emission lines can contribute at most 7% of the -band flux. The \lya emission from Galaxy B ( erg s-1 cm-2; Paper I) can contribute at most another 4% of the -band flux, but even this negligible fraction is likely a gross overestimate. The spectroscopic data shows that the \lya emission from Galaxy B is compact, centered on the interloper system, rather than spatially extended (Paper I). We conclude therefore that the diffuse -band emission seen in LABd05 is indeed rest-frame UV continuum emission.
As described in Section 3.1.4, we measured the centroid, size, and luminosity of this component using GALFIT, avoiding contamination from nearby compact sources during the fitting process by constraining all the fitting parameters for the compact sources to the previously-derived values. Table 4 gives the position, magnitude, effective radius, Sérsic index, position angle, and axis ratio of the diffuse component. The diffuse continuum component is well-fit by an exponential disk profile and the centroid is nearly coincident with that of the \lya emission (offset by ″). We measured aperture photometry at the center of the nebula in all three bands using a small aperture (1.6″ diameter) chosen to minimize contamination from neighboring compact sources (Table 4). The surface brightness profile of the diffuse continuum emission was also computed using the IRAF task ellipse, where the ellipse parameters were constrained to the centroid, single position angle, and axis ratio of the GALFIT parametric fit (Figures 9 and 10).
At the depth of these observations we would have detected point-source regions with fluxes of 10-17 erg s-1 cm-2 (5, 0.4″ diameter aperture), corresponding to a stellar mass limit of M⊙, assuming a 25 Myr simple stellar population (Bruzual & Charlot, 2003). We can also rule out high surface brightness clumps down to a peak surface brightness limit of 9.510-16 erg s-1 cm-2 arcsec-2(3). However, it is worth remembering that if there are many lower mass sources distributed over this area, they would appear as unresolved diffuse continuum emission.
4. Discussion
4.1. The Substructure of LABd05
The high resolution imaging of HST provides a precise look at the sub-kiloparsec morphology of LABd05, with important implications for our understanding of the substructure of \lya nebulae and the properties of the galaxies forming within them, as well as for determining what power sources are ultimately responsible for the \lya emission. The key morphological characteristics of this \lya nebula system are the following:
-
•
Many Compact, Low Luminosity Galaxies: The system hosts 17 primarily small, disky, low luminosity galaxies including an obscured AGN.
-
•
Offset Morphology: All the compact sources within the system are located 20 kpc away from the peak and centroid of the \lya nebula.
-
•
No Central Galaxy: LABd05 has no central galaxy or compact source brighter than 0.03 visible within the highest surface brightness region of the \lya nebula.
-
•
Diffuse Line and Continuum Emission: While the compact sources appear to avoid the region of the nebula, there are three nearly spatially coincident extended emission components located near the center of the nebula: \lya, Heii, and rest-frame UV continuum emission.
-
•
Smooth, Non-filamentary Morphology: Both the \lya emission and the diffuse UV continuum emission are smooth and show surface brightness profiles that are consistent with exponential disks () with moderate axis ratios (), i.e., they are not particularly clumpy or filamentary.
-
•
Similar UV and Ly Surface Brightness Profiles: The \lya and UV continuum surface brightness profiles, while not identical, are comparable in shape and extent.
In what follows, we discuss each of the key morphological findings in detail. Focusing first on the compact sources, we show that the LABd05 system is overdense relative to the field, hosting a population of small, disky, low luminosity galaxies that, while numerous, are irrelevant to the ionization of the nebula (Section 4.2). We then compare the remaining observed morphological characteristics to the expectations for \lya nebulae driven by superwind outflow, cold flow, and resonant scattering scenarios and find significant discrepancies (Sections 4.34.6). We end with a discussion of the possibility that the LABd05 system is a forming galaxy group (Section 4.7).
4.2. Many Compact, Low Luminosity Galaxies
4.2.1 An Overdense Region
Even without determining the membership of individual nearby galaxies, it is clear from the high resolution ACS and NICMOS imaging that there are a large number of compact sources in the vicinity of LABd05, more than would be expected for a region of this size in the field. Figure 12 shows the -band number counts for sources detected above the limiting magnitude and located within a 7″ radius of the AGN in LABd05. For comparison we show number count measurements drawn from our entire ACS pointing as well as field measurements taken from the Hubble Deep Field-North and -South (HDF-N, HDF-S; Williams et al., 1996; Casertano et al., 2000), the HUDF (Beckwith et al., 2006; Coe et al., 2006), and the GOODS-North and -South fields (Giavalisco et al., 2004). Dividing the LABd05 number counts by those from the HUDF shows that the \lya nebula system is overdense by at least factor of relative to the field at magnitudes of (Figure 13), with the uncertainty computed assuming Poisson statistics. If we further restrict the region of interest to a 2.5″ radius region encompassing just the group of objects lying immediately to the north of the nebula (i.e., centered at [0″,+1.5″] in Figure 2), the overdensity is a factor of above the field. We can derive a better estimate of the true overdensity factor relative to the field at this redshift by applying the membership color cut discussed in Section 3.1.3 to both the LABd05 and HUDF galaxy catalogs. In this case, the overdensity factor of the 7″ radius region approaches at magnitudes of . These high overdensity factors are not surprising if LABd05 is indeed a region of active galaxy formation destined to become a galaxy group or cluster.
4.2.2 Properties of the Member Galaxies
The previous section looked at the question of whether this region is overdense in a statistical sense relative to the field, i.e., without drawing on any knowledge of system membership. In Figure 14, we again show the number counts (top panel), but in addition, we make use of our membership assignment to plot the number counts for sources that are likely within the system (bottom panel), i.e., the observed luminosity function. We find that the observed luminosity function of the M1+M2 subset is largely consistent with what we would predict statistically by taking the observed number counts for the LABd05 region and simply subtracting off the expected number counts for the field, as derived from the HUDF (Figure 14, dashed line). This good agreement between the statistical treatment of the previous section and the individual object membership treatment gives us confidence both that our membership assignment based on optical/NIR colors is reasonable and that our estimate of the observed luminosity function of the system is relatively robust even if our membership assignment is not perfect on an object-by-object basis. To our knowledge, this is the first time a luminosity function has been estimated for an individual Ly nebula system, and it implies that LABd05 is dominated by low luminosity galaxies. Assuming that at is (AB mag at rest-frame 1700Å; Reddy et al., 2008), which corresponds to AB in apparent magnitudes,444The central wavelength of is Å observed Å in the rest frame at we find that the LABd05 system is dominated by galaxies. Only one galaxy, the LBG (#26), is more luminous than .
These data also reveal clues about the ages and morphologies of the galaxies within LABd05. The colors of sources within the system appear to be consistent with young ages ( Myr) and a range of dust extinctions (). The distribution of sizes and Sérsic indices of the galaxies in the vicinity of LABd05 are shown in Figure 15, with those that are likely associated with LABd05 shown as filled (subset M1) and hatched (subset M2) histograms. In general, the galaxies in the vicinity of LABd05 are small ( kpc) with Sérsic indices clustering around , indicative of exponential disk morphologies.
In summary, our analysis suggests that the LABd05 system hosts a large population of young, small, disky, low luminosity galaxies.
4.2.3 Energy Budget of the Member Galaxies
The presence of a large population of compact galaxies within the LABd05 system raises an obvious question: are they responsible for powering the \lya emission via photoionization? We find that the total ionizing luminosity () of all 16 of the well-detected nearby galaxies at the system redshift (excluding the obscured AGN, #36) is photons s-1 (unreddened, Myr single bursts Bruzual & Charlot, 2003), ignoring the effects of distance, geometric corrections, and non-unity escape fractions. This is much less than is required to power the observed \lya ( photons s-1; Paper I). The fact that all of these galaxies lie tens of kiloparsecs away from the peak of the \lya emission makes their potential contribution even smaller.
The only single compact source that could potentially contribute substantially to powering the nebula is the AGN (#36), but simple energetic arguments imply that even it may not be powerful enough to explain all of the \lya emission. In Paper I, we found that the total ionizing luminosity of the AGN, estimated from an extrapolation of the mid-infrared SED, was photons s-1 and potentially orders of magnitude larger than the contribution from the other compact sources. There is a large associated uncertainty on this estimate due to the difficulty of extrapolating the ionizing luminosity from the mid-infrared SED, but if it is accurate, it implies that the AGN can contribute at most 18% of the necessary ionizing photons to explain the \lya (Paper I). Recently, Colbert et al. (2011) argued, based on measurements of PAH features in IRS spectroscopy, that roughly half of the bolometric luminosity of this mid-infrared source may arise from star formation rather than AGN activity. If so, our estimate of the fraction of ionizing photons contributed by the AGN must be reduced by an additional factor of 2. Thus, for the AGN to be the dominant power source for the \lya nebula, the geometry of the system must be such that the AGN is highly obscured to our line-of-sight but relatively unobscured in the direction of the gas cloud. A full analysis of the energetics of the system and the dominant power source will be addressed in an upcoming paper.
4.3. An Offset Morphology with No Central Galaxy
A key observational result of this work is that there is no galaxy or AGN at or near the center of the \lya nebula itself. All the compact sources visible in the HST imaging are offset by 20 kpc from the peak of the \lya emission. In fact, the member galaxies actually appear to encircle the nebula (e.g., #1, 18, 21, 26, 29, 45, 52, 57), although given the small sample size, it is not clear whether or not this effect is significant or merely coincidental. Neither the \lya nor the diffuse UV continuum components show any significant knots of emission that might represent bright star-forming galaxies or luminous stellar clusters. The lack of compact components brighter than 10-17 erg s-1 cm-2 (5) in the diffuse -band light implies that there are no compact sources with luminosities brighter than erg s-1 () embedded within the central line-emitting region of the nebula. Similarly, the lack of any obvious substructure in the ACS \lya image suggests that there are no compact sources forming stars at a rate greater than . The lack of 24µm emission spatially associated with the \lya nebula suggests there is also no hidden starburst at the center. This lack of a central galaxy has important implications for the potential power source in LABd05.
An early model that was proposed to explain the \lya nebula phenomenon was shock-heating in starburst superwinds. However, from previous work we know that the Civ and Heii line ratios in LABd05 are not consistent with shock ionization (Paper I). More importantly, with no central source present to drive a wind it is extremely difficult to describe this system using a simple outflow model. An outflow driven by one of the other sources would need to be severely asymmetric (no secondary \lya peak is present on the opposite side) and extend more than 40 kpc in one direction.
The lack of a central galaxy is similarly problematic for models that attempt to explain large \lya nebulae such as LABd05 as evidence for cold flows. In this scenario, the \lya is powered primarily via gravitational cooling radiation, as gas falls into a gravitational potential well along cold filaments, heats collisionally, and cools via \lya. The theoretical expectation, borne out more recently in numerical simulations, is that the extended \lya emission surrounds a growing galaxy (Haiman et al., 2000; Fardal et al., 2001; Furlanetto et al., 2005; Yang et al., 2006; Dijkstra et al., 2006a, b; Goerdt et al., 2010; Faucher-Giguère et al., 2010). This basic prediction of the cold flow model is violated in the case of LABd05. In order to reconcile the data with this scenario, we would have to conclude that we are witnessing the Ly nebula at an epoch before the star clusters within it have dynamically relaxed to form a centrally concentrated galaxy. Even in this case, since the observed centroid of the \lya emission in this model should be a direct indication of the position of the center of mass of the system, we would need to understand how all of the compact sources — the luminous, obscured AGN and the 16 other compact galaxies — ended up kpc away from the center of mass.
Finally, another hypothesis for explaining the observed properties of \lya nebulae is one in which \lya photons produced by a central source are resonantly scattered in the surrounding gas out to much larger radii. Recent observations have uncovered what appear to be \lya scattering halos around continuum-selected LBGs, with \lya surface brightness profiles similar in shape to those of \lya nebulae (Steidel et al., 2011), and have revived the long-standing question of whether \lya nebulae could simply be scaled up versions of this phenomenon. In addition, imaging polarimetry of one of the \lya nebulae in the SSA22 field (LAB1) resulted in a detection of polarization of the \lya emission (Hayes et al., 2011), suggesting that in this case \lya photons may be scattering from central sources embedded within the nebula (cf. Weijmans et al., 2010) rather than being produced in situ at large radii. While resonant scattering must contribute at some level to the overall extent of \lya nebulae, it is not yet clear whether this process is the dominant cause of the large sizes observed in all (or even most) \lya nebulae. Indeed, this explanation is difficult to reconcile with our observations of LABd05. While existing imaging polarimetric constraints for LABd05 (Prescott et al., 2011) are not sufficient to rule out scattering entirely, with no central galaxy or galaxies, there is no obvious source of \lya photons that could undergo resonant scattering to produce the observed \lya nebula. Instead, the \lya photons could only be supplied by the AGN or compact galaxies at the outskirts. The fact that the \lya is so dramatically offset from these potential source(s) of \lya photons would require that either the gas distribution or the illumination is severely asymmetric.
We note that LABd05 is not the only \lya nebulae known to lack a central source. The extensive multi-wavelength imaging of the GOODS-S field revealed a \lya-emitting nebula at with no obvious continuum counterparts. This fact was used by the authors to argue the \lya emission is most likely powered by gravitational cooling radiation (Nilsson et al., 2006), which, if true, would again require the system to be in a very early state prior to the onset of significant star formation at or near the center of mass of the system. However, the deep HST multiband imaging of the field does reveal a number of compact galaxies within 1-7″ of the \lya emission peak. While none of the available photometric redshifts for these galaxies closely matches the redshift of the \lya nebula, four of the brighter cases are consistent with the systemic redshift, given the large redshift error bars, and a number of fainter galaxies without reliable photometric redshifts are located within 1-3″ of the \lya emission peak. In the context of what we have learned about LABd05, it is clear that powerful \lya nebulae can exist substantially offset from all associated continuum sources. We argue therefore that it remains to be seen whether the Nilsson et al. (2006) \lya nebula is in fact alone.
4.4. Diffuse Line and Continuum Emission
The ACS and ground-based broad-band images show clear evidence for a spatially extended diffuse UV continuum component that is co-located with the spatially extended \lya emission. In addition, the non-detection in our narrow-band imaging strongly suggests that the Heii emission is spatially extended as well ( FWHM ). What is the origin of these diffuse components? Given the lack of a central galaxy, there are only two plausible sources: in situ spatially distributed star formation and/or the obscured AGN that lies kpc away.
One intriguing possibility is that the diffuse UV continuum emission is due to star-formation taking place in very small, widely distributed, perhaps dynamically unrelaxed regions that are unresolved and unseen by the current HST imaging. Possible evidence for this type of extended star formation has been seen in another radio-quiet \lya nebula (SSA22-LAB1; Matsuda et al., 2007) as well as in the outskirts of a radio galaxy (MRC 1138-262, “the Spiderweb galaxy”; Hatch et al., 2008). This scenario would explain the morphology of the observed diffuse continuum component and the presense of ionizing radiation emerging over an extended region. The roughly elliptical shape of the UV continuum and \lya components, along with the velocity profile of the \lya reported by Paper I, lead us to speculate that we could be observing a large inclined disk exhibiting solid-body rotation. Using the central aperture measurements for both components (Table 4), we derive similar star formation rates from the \lya and diffuse UV continuum emission ( and M⊙ yr-1, respectively, within the central 2 arcsec2; Kennicutt, 1998). The corresponding rest-frame equivalent width for \lya of Å, which is plausible for a stellar population (Charlot & Fall, 1993; Malhotra & Rhoads, 2002; Schaerer, 2003). However, the total diffuse UV continuum flux implies that the expected contribution to the ionizing photon flux is photons s-1 from a young ( Myr), solar metallicity, spatially distributed stellar population with a mass of M⊙ (unreddened single bursts; Bruzual & Charlot, 2003). This is only a fraction of the ionizing flux required to power the entire \lya nebula ( photons s-1; Paper I), suggesting that a much lower metallicity stellar population would be required in this scenario. The inferred spatial extent of the Heii emission could potentially support of this picture; however, this would imply a stellar population of extremely young age and low metallicity ( Myr, ; Schaerer, 2003).
The alternative is that the diffuse line and continuum emission are the result of photoionization and scattering from the AGN located nearly 20 kpc away from the peak of the diffuse line and continuum components. Evaluating this scenario requires knowledge of the total power of the AGN and the degree of obscuration in the direction of the nebula. The bolometric luminosity derived from the infrared SED indicates a powerful AGN (; Yang et al., 2012). On the other hand, Colbert et al. (2011) found evidence for strong PAH emission in the mid-infrared spectrum of this source and concluded that a significant fraction of the bolometric luminosity likely results from star-formation as well. Hence, while an AGN beamed in the direction of the nebula but obscured from our direct view can account for some of the observed diffuse light, it is not yet clear what fraction of the observed \lya and UV continuum emission can be explained by this scenario.
Ultimately, understanding the origin of the diffuse continuum components will require better data than are currently available. In particular, deep imaging to measure the continuum colors, deep polarization observations to determine what fraction, if any, of the continuum light is scattered, and a map of the velocity field measured from a non-resonant line (e.g., H or [OIII]5007) are necessary. Given the apparent faintness and redshift of this target, these observations await JWST.
4.5. Smooth, Non-filamentary Morphology
Another key morphological result of this work is the finding that the diffuse emission components (\lya and UV) in LABd05 are remarkably smooth and round. In particular, there is no evidence for the kind of bubble-like structures that have been taken as evidence for the superwind outflow scenario (e.g., Taniguchi et al., 2001; Mori et al., 2004; Matsuda et al., 2004). The diffuse emission is also not particularly clumpy or filamentary, in contrast to the predictions of recent cold flow simulations that suggest the morphologies of \lya nebulae powered by cold accretion should be asymmetric and narrow with “finger-like extensions” (Goerdt et al., 2010). Instead, the \lya morphology of LABd05 is quite symmetric and well-described by an exponential disk. While the typical axis ratio of the predicted \lya nebulae appear (Figures of Goerdt et al., 2010) to be in the range , LABd05 is much less elongated with an axis ratio of . The Goerdt et al. (2010) models also suggest that clumps associated with the inflowing streams should provide an important contribution to the total luminosity. Quantitative estimates are not given in the paper, but from their Figures we estimate that there should be significant clumps (with surface brightnesses times that of the central peak) within the virial radius ( kpc). No significant clumps are seen in the \lya emission from LABd05.
The surface brightness profiles of \lya emission from model nebulae are also typically more centrally concentrated than that observed for LABd05. In Figure 9 we overplot the predicted surface brightness profiles from recent cold flow simulations. The Goerdt et al. (2010) prediction of a power law, which we have scaled to match the total observed \lya flux for LABd05 inside a radius of 5″, is a poor fit to the shape of the observed surface brightness profile. The Faucher-Giguère et al. (2010) predictions shown are based on their two most realistic treatments for \lya emission from gravitational cooling (their models #7 and #9, which include prescriptions for self-shielding). The lower bound of each region shown corresponds to the prediction for a fiducial M⊙ halo mass model at ; the upper bound of each region is the same profile scaled up to a halo mass of M⊙ based on the predicted -Mhalo relation (Faucher-Giguère et al., 2010) and under the naïve assumption that the profile shape is constant as a function of halo mass. Model #7 can in principle reach the peak \lya surface brightness we observe in LABd05, assuming a sufficiently massive halo, but the profile shape is much more centrally concentrated than is observed. Model #9 is orders of magnitude too faint, even for the most massive halos.
We note that although the expected luminosity scaling is the most basic output from models of \lya nebulae powered by cold accretion, this has turned out to be particularly difficult to predict robustly. Early models suggested that the \lya emission from gravitational cooling should be similar to what is observed in \lya nebulae (e.g., Yang et al., 2006; Goerdt et al., 2010). However, more recent work has argued that these \lya nebula luminosity predictions may be orders of magnitude too high due to the effects of self-shielding and that cooling radiation alone is an unlikely explanation for the \lya emission of the most luminous \lya nebulae (Faucher-Giguère et al., 2010). The question of the predicted \lya luminosity from cold accretion is still a matter of some debate, but interestingly our analysis has shown that even if the question of the luminosity scaling is ignored, key morphological discrepancies remain between existing cold flow models and what is seen in LABd05.
4.6. Similar UV and Ly Surface Brightness Profiles
Due to the effects of resonant scattering, there is a generic expectation that high redshift sources of \lya emission should be surrounded by low surface brightness halos of resonantly scattered \lya emission (e.g., Loeb & Rybicki, 1999; Zheng et al., 2010). After a number of observational studies uncovered possible hints of this extended emission in samples of \lya-emitting galaxies (e.g., Hayashino et al., 2004; Ono et al., 2010), Steidel et al. (2011) used a stacking analysis to demonstrate convincingly that extended \lya halos appear to exist around all classes of star-forming galaxies. They noted the large extent of these \lya halos relative to the much more compact UV cores and pointed out the similarities in surface brightness profile shape between the \lya halos around stacked continuum-selected LBGs and stacked \lya nebulae in the same field. They concluded that, if one could image deeply enough ( erg s-1 cm-2), all continuum-selected LBGs would be classified as extended \lya nebulae. The obvious question then becomes: are giant \lya nebulae simply scaled up versions of this phenomenon with the large extent driven simply by resonant scattering of \lya photons from a single or several central sources?
In the case of LABd05, it does not appear that the large \lya extent can be explained simply as a result of resonant scattering. The lack of an obvious central source of \lya photons is the first challenge (as discussed in Section 4.3), but another inconsistency appears when considering the \lya and UV surface brightness profiles (Figure 10). Instead of a compact UV core surrounded by an extended \lya halo, the UV emission in LABd05 is nearly as spatially extended as the \lya, a clear indication that the the nebula’s large size is primarily the result of some other mechanism or geometry. Furthermore, the observed \lya and diffuse UV continuum surface brightness profiles are remarkably similar in their properties. They both show similar radial distributions, are well-described by nearly-exponential disks, and have approximately elliptical shapes with similar axial ratios (Table 4). In comparison, the stacked UV and \lya profiles derived for continuum-selected star-forming galaxies differ significantly (Figure 10; Steidel et al., 2011). Thus, while it seems likely that resonant scattering can explain some of the remaining differences between the two components, it does not appear that the large spatial extent of LABd05 is solely a result of \lya resonant scattering.
4.7. A Galaxy Group in Formation?
LABd05 is unique only because of the existence of deep and high-spatial resolution broad- and narrow-band imaging data. These data provide many pieces of evidence in support of the idea that this is a young, forming system. There are numerous small, low-luminosity, disky galaxies, many of which have very blue colors. Even the reddest objects have colors that are consistent with ages of less than a few hundred million years, perhaps only a hundred million years if they are modestly reddened (i.e., ). The large and luminous \lya halo and the detection of faint, diffuse UV continuum emission in the region also suggest that the system is energetically young. In addition, the fact that 9 of the compact galaxies that are likely to be associated with the system (i.e., roughly half the candidate members, with a total luminosity of 1.2 ) lie within a small projected area 30 kpc in diameter suggests that the system may also be dynamically young, the dynamical time for this region being only Myr.555This calculation assumes that corresponds to a mass of M⊙ (Shapley et al., 2005; Reddy et al., 2006; Erb et al., 2006; Reddy & Steidel, 2009) and a stellar-to-halo mass ratio at this mass of for (Moster et al., 2010).
We speculate that this giant \lya nebula is the progenitor of a galaxy group, witnessed in the process of formation. Under this assumption, the luminosity distribution of the member galaxies can provide a unique perspective on the “initial luminosity function” of galaxies. Spectroscopic redshift measurements of the galaxies within the system will be key to confirming membership and determining the dynamical mass of the system. While we only have spectroscopic redshifts for 3 sources in the region, we have argued both from the excess of galaxies in the vicinity of the nebula and from the colors of these galaxies that most of the compact objects observed are likely members of the system. By assuming that all the galaxies that lie above the dashed line in Figure 4 are members, we have constructed a luminosity function for the system, as shown in Figure 14 (bottom panel). Summing all the UV luminosity contributed by the candidate member galaxies and the diffuse continuum results in a total of 23.4 AB mag in the band, or . It is therefore possible that this system could evolve into a small group, with the smaller galaxies merging into larger systems over a few dynamical times.
Clearly better data are needed, both to confirm the system membership and to measure the stellar masses of the member galaxies more robustly. Nevertheless, LABd05 provides the tantalizing hope that detailed studies of more such systems, even statistical studies, can result in a determination of the initial mass function of galaxies, analogous to the manner in which studies of stellar clusters in our own Galaxy have yielded the stellar initial mass function. While LABd05 is only one source, we note that there are other \lya nebulae that appear to be similar in morphology. For example, one of the \lya nebulae in the SSA22 field at (LAB1) shows multiple embedded galaxies and a hint of diffuse UV continuum in between the galaxies in ground-based data (Matsuda et al., 2007). As discussed in Section 4.3, the \lya nebula found in the GOODS-S field at has no central continuum counterpart (Nilsson et al., 2006). Deep HST imaging of a larger sample of giant \lya nebulae will be important for understanding the extent to which the morphology and galaxy properties observed in LABd05 are characteristic of \lya nebula systems in general.
5. Conclusions
Using high resolution HST imaging, we have taken a census of all the compact sources within a large \lya nebula at . We find that the \lya nebula system contains numerous compact, young, disky galaxies and an obscured AGN that are all located tens of kiloparsecs from the peak of the \lya emission and provide a negligible contribution to the ionization of the nebula. The observed luminosity function shows that the compact sources within the system are predominantly low luminosity () galaxies, highly suggestive of a galaxy forming environment. The large-scale morphology of the system is characterized by the lack of a central galaxy at or near the peak of the \lya nebula and the presence of several nearly coincident, smooth, and spatially extended emission components (\lya, Heii, and diffuse UV continuum). These morphological results — in particular the lack of a central galaxy and the offset morphology — disfavor models of outflows, cold flows, and resonant scattering halos, suggesting that while these phenomena may be present, they are not sufficient to explain the powering and the large extent of giant \lya nebulae. Based on these observations, we speculate that large \lya nebulae are progenitors of low-redshift galaxy groups or low-mass clusters.
References
- Alonso-Herrero et al. (2006) Alonso-Herrero, A., et al. 2006, The Astrophysical Journal, 640, 167
- Barrio et al. (2008) Barrio, F. E., et al. 2008, Monthly Notices of the Royal Astronomical Society, 389, 792
- Basu-Zych & Scharf (2004) Basu-Zych, A., & Scharf, C. 2004, The Astrophysical Journal, 615, L85
- Beckwith et al. (2006) Beckwith, S. V. W., et al. 2006, The Astronomical Journal, 132, 1729
- Bertin & Arnouts (1996) Bertin, E., & Arnouts, S. 1996, Astronomy and Astrophysics Supplement, 117, 393
- Bruzual & Charlot (2003) Bruzual, G., & Charlot, S. 2003, Monthly Notices of the Royal Astronomical Society, 344, 1000
- Bussmann et al. (2009) Bussmann, R. S., et al. 2009, The Astrophysical Journal, 705, 184
- Casertano et al. (2000) Casertano, S., et al. 2000, The Astronomical Journal, 120, 2747
- Chapman et al. (2004) Chapman, S. C., Scott, D., Windhorst, R. A., Frayer, D. T., Borys, C., Lewis, G. F., & Ivison, R. J. 2004, The Astrophysical Journal, 606, 85
- Charlot & Fall (1993) Charlot, S., & Fall, S. M. 1993, The Astrophysical Journal, 415, 580
- Coe et al. (2006) Coe, D., Benítez, N., Sánchez, S. F., Jee, M., Bouwens, R., & Ford, H. 2006, The Astronomical Journal, 132, 926
- Colbert et al. (2011) Colbert, J. W., Scarlata, C., Teplitz, H., Francis, P., Palunas, P., Williger, G. M., & Woodgate, B. 2011, The Astrophysical Journal, 728, 59
- Dey et al. (2005) Dey, A., et al. 2005, The Astrophysical Journal, 629, 654
- Dijkstra et al. (2006a) Dijkstra, M., Haiman, Z., & Spaans, M. 2006a, The Astrophysical Journal, 649, 14
- Dijkstra et al. (2006b) Dijkstra, M., Haiman, Z., & Spaans, M. 2006b, The Astrophysical Journal, 649, 37
- Dijkstra & Loeb (2009) Dijkstra, M., & Loeb, A. 2009, Monthly Notices of the Royal Astronomical Society, 400, 1109
- Eisenhardt et al. (2004) Eisenhardt, P. R., et al. 2004, The Astrophysical Journal Supplement Series, 154, 48
- Erb et al. (2006) Erb, D. K., Steidel, C. C., Shapley, A. E., Pettini, M., Reddy, N. A., & Adelberger, K. L. 2006, The Astrophysical Journal, 646, 107
- Fardal et al. (2001) Fardal, M. A., Katz, N., Gardner, J. P., Hernquist, L., Weinberg, D. H., & Dave, R. 2001, The Astrophysical Journal, 562, 605
- Faucher-Giguère et al. (2010) Faucher-Giguère, C.-A., Kereš, D., Dijkstra, M., Hernquist, L., & Zaldarriaga, M. 2010, The Astrophysical Journal, 725, 633
- Francis et al. (1996) Francis, P. J., et al. 1996, The Astrophysical Journal, 457, 490
- Furlanetto et al. (2005) Furlanetto, S. R., Schaye, J., Springel, V., & Hernquist, L. 2005, The Astrophysical Journal, 622, 7
- Geach et al. (2007) Geach, J. E., Smail, I., Chapman, S. C., Alexander, D. M., Blain, A. W., Stott, J. P., & Ivison, R. J. 2007, The Astrophysical Journal, 655, L9
- Geach et al. (2009) Geach, J. E., et al. 2009, The Astrophysical Journal, 700, 1
- Giavalisco et al. (2004) Giavalisco, M., et al. 2004, The Astrophysical Journal, 600, L93
- Goerdt et al. (2010) Goerdt, T., Dekel, A., Sternberg, A., Ceverino, D., Teyssier, R., & Primack, J. R. 2010, Monthly Notices of the Royal Astronomical Society, 407, 613
- Gorjian et al. (2008) Gorjian, V., et al. 2008, The Astrophysical Journal, 679, 1040
- Haiman et al. (2000) Haiman, Z., Spaans, M., & Quataert, E. 2000, The Astrophysical Journal, 537, L5
- Hatch et al. (2008) Hatch, N. A., Overzier, R. A., Röttgering, H. J. A., Kurk, J. D., & Miley, G. K. 2008, Monthly Notices of the Royal Astronomical Society, 383, 931
- Hayashino et al. (2004) Hayashino, T., et al. 2004, The Astronomical Journal, 128, 2073
- Hayes et al. (2011) Hayes, M., Scarlata, C., & Siana, B. 2011, Nature, 476, 304
- Houck et al. (2005) Houck, J. R., et al. 2005, The Astrophysical Journal, 622, L105
- Ivison et al. (1998) Ivison, R. J., Smail, I., Le Borgne, J.-F., Blain, A. W., Kneib, J.-P., Bezecourt, J., Kerr, T. H., & Davies, J. K. 1998, Monthly Notices of the Royal Astronomical Society, 298, 583
- Jannuzi & Dey (1999) Jannuzi, B. T., & Dey, A. 1999, in Photometric Redshifts and the Detection of High Redshift Galaxies, ed. R. Weymann, R., Storrie-Lombardi, L., Sawicki, M., & Brunner, Vol. 191 (Astronomical Society of the Pacific Conference Series), 111
- Jedrzejewski et al. (2005) Jedrzejewski, R., Hack, W., Hanley, C., Busko, I., & Koekemoer, A. M. 2005, Astronomical Data Analysis Software and Systems XIV ASP Conference Series, 347
- Kennicutt (1998) Kennicutt, R. C. 1998, Annual Review of Astronomy and Astrophysics, 36, 189
- Loeb & Rybicki (1999) Loeb, A., & Rybicki, G. B. 1999, The Astrophysical Journal, 524, 527
- Magee et al. (2007) Magee, D. K., Bouwens, R. J., & Illingworth, G. D. 2007, Astronomical Data Analysis Software and Systems XVI ASP Conference Series, 376, 261
- Malhotra & Rhoads (2002) Malhotra, S., & Rhoads, J. E. 2002, The Astrophysical Journal, 565, L71
- Matsuda et al. (2007) Matsuda, Y., Iono, D., Ohta, K., Yamada, T., Kawabe, R., Hayashino, T., Peck, A. B., & Petitpas, G. R. 2007, The Astrophysical Journal, 667, 667
- Matsuda et al. (2004) Matsuda, Y., et al. 2004, The Astronomical Journal, 128, 569
- Matsuda et al. (2005) Matsuda, Y., et al. 2005, The Astrophysical Journal, 634, L125
- Matsuda et al. (2009) Matsuda, Y., et al. 2009, Monthly Notices of the Royal Astronomical Society: Letters, 400, L66
- Matsuda et al. (2011) Matsuda, Y., et al. 2011, Monthly Notices of the Royal Astronomical Society: Letters, 410, L13
- McCarthy (1993) McCarthy, P. J. 1993, Annual Review of Astronomy and Astrophysics, 31, 639
- Miley et al. (2006) Miley, G. K., et al. 2006, The Astrophysical Journal, 650, L29
- Miyazaki et al. (2002) Miyazaki, S., et al. 2002, Publications of the Astronomical Society of Japan
- Mori et al. (2004) Mori, M., Umemura, M., & Ferrara, A. 2004, The Astrophysical Journal, 613, L97
- Moster et al. (2010) Moster, B. P., Somerville, R. S., Maulbetsch, C., van den Bosch, F. C., Macciò, A. V., Naab, T., & Oser, L. 2010, The Astrophysical Journal, 710, 903
- Nilsson et al. (2006) Nilsson, K. K., Fynbo, J. P. U., Mø ller, P., Sommer-Larsen, J., & Ledoux, C. 2006, Astronomy and Astrophysics, 452, L23
- Oke (1974) Oke, J. B. 1974, The Astrophysical Journal Supplement Series, 27, 21
- Ono et al. (2010) Ono, Y., Shimasaku, K., Dunlop, J., Farrah, D., McLure, R., & Okamura, S. 2010, The Astrophysical Journal, 724, 1524
- Ouchi et al. (2009) Ouchi, M., et al. 2009, The Astrophysical Journal, 696, 1164
- Palunas et al. (2004) Palunas, P., Teplitz, H. I., Francis, P. J., Williger, G. M., & Woodgate, B. E. 2004, The Astrophysical Journal, 602, 545
- Peng et al. (2002) Peng, C. Y., Ho, L. C., Impey, C. D., & Rix, H.-W. 2002, The Astronomical Journal, 124, 266
- Prescott (2009) Prescott, M. K. M. 2009, Phd, University of Arizona
- Prescott et al. (2009) Prescott, M. K. M., Dey, A., & Jannuzi, B. T. 2009, The Astrophysical Journal, 702, 554
- Prescott et al. (2008) Prescott, M. K. M., Kashikawa, N., Dey, A., & Matsuda, Y. 2008, The Astrophysical Journal, 678, L77
- Prescott et al. (2011) Prescott, M. K. M., Smith, P. S., Schmidt, G. D., & Dey, A. 2011, 12
- Reddy & Steidel (2009) Reddy, N. A., & Steidel, C. C. 2009, The Astrophysical Journal, 692, 778
- Reddy et al. (2006) Reddy, N. A., Steidel, C. C., Erb, D. K., Shapley, A. E., & Pettini, M. 2006, The Astrophysical Journal, 653, 1004
- Reddy et al. (2008) Reddy, N. A., Steidel, C. C., Pettini, M., Adelberger, K. L., Shapley, A. E., Erb, D. K., & Dickinson, M. 2008, The Astrophysical Journal Supplement Series, 175, 48
- Saito et al. (2006) Saito, T., Shimasaku, K., Okamura, S., Ouchi, M., Akiyama, M., & Yoshida, M. 2006, The Astrophysical Journal, 648, 54
- Schaerer (2003) Schaerer, D. 2003, Astronomy and Astrophysics, 397, 527
- Shapley et al. (2005) Shapley, A. E., Steidel, C. C., Erb, D. K., Reddy, N. A., Adelberger, K. L., Pettini, M., Barmby, P., & Huang, J. 2005, The Astrophysical Journal, 626, 698
- Smith & Jarvis (2007) Smith, D. J. B., & Jarvis, M. J. 2007, Monthly Notices of the Royal Astronomical Society: Letters, 378, L49
- Smith et al. (2008) Smith, D. J. B., Jarvis, M. J., Lacy, M., & Martínez-Sansigre, A. 2008, Monthly Notices of the Royal Astronomical Society, 389, 799
- Smith et al. (2009) Smith, D. J. B., Jarvis, M. J., Simpson, C., & Martínez-Sansigre, A. 2009, Monthly Notices of the Royal Astronomical Society, 393, 309
- Steidel et al. (2000) Steidel, C. C., Adelberger, K. L., Shapley, A. E., Pettini, M., Dickinson, M., & Giavalisco, M. 2000, The Astrophysical Journal, 532, 170
- Steidel et al. (2011) Steidel, C. C., Bogosavljević, M., Shapley, A. E., Kollmeier, J. A., Reddy, N. A., Erb, D. K., & Pettini, M. 2011, 17
- Taniguchi & Shioya (2000) Taniguchi, Y., & Shioya, Y. 2000, The Astrophysical Journal, 532, L13
- Taniguchi et al. (2001) Taniguchi, Y., Shioya, Y., & Kakazu, Y. 2001, The Astrophysical Journal, 562, L15
- Weidinger et al. (2005) Weidinger, M., Mø ller, P., Fynbo, J. P. U., & Thomsen, B. 2005, Astronomy and Astrophysics, 436, 825
- Weijmans et al. (2010) Weijmans, A.-M., Bower, R. G., Geach, J. E., Swinbank, A. M., Wilman, R. J., de Zeeuw, P. T., & Morris, S. L. 2010, Monthly Notices of the Royal Astronomical Society, 402, 2245
- Williams et al. (1996) Williams, R. E., et al. 1996, The Astronomical Journal, 112, 1335
- Yang et al. (2010) Yang, Y., Zabludoff, A., Eisenstein, D., & Davé, R. 2010, The Astrophysical Journal, 719, 1654
- Yang et al. (2011) Yang, Y., Zabludoff, A., Jahnke, K., Eisenstein, D., Davé, R., Shectman, S. A., & Kelson, D. D. 2011, The Astrophysical Journal, 735, 87
- Yang et al. (2009) Yang, Y., Zabludoff, A., Tremonti, C., Eisenstein, D., & Davé, R. 2009, The Astrophysical Journal, 693, 1579
- Yang et al. (2006) Yang, Y., Zabludoff, A. I., Dave, R., Eisenstein, D. J., Pinto, P. A., Katz, N., Weinberg, D. H., & Barton, E. J. 2006, The Astrophysical Journal, 640, 539
- Yang et al. (2012) Yang, Y., et al. 2012, The Astrophysical Journal, 744, 178
- Zheng et al. (2010) Zheng, Z., Cen, R., Weinberg, D., Trac, H., & Miralda-Escude, J. 2010, 11
| Instrument | Filter | Exposure Time | Bandpass Width | Restframe | |
|---|---|---|---|---|---|
| (min) | at | ||||
| HST/ACS | FR462N ([O ii] outer ramp) | 216 | 4448 ÅaaRamp filters and were centered on \lya and Heii1640, respectively, at z2.7 during these observations. | 89 Å | Ly1216 |
| HST/ACS | F606W (Broad-band ) | 129 | 5907 Å | 2342 Å | 1295-1936 Å |
| HST/ACS | FR601N ([O iii] outer ramp) | 129 | 5998 ÅaaRamp filters and were centered on \lya and Heii1640, respectively, at z2.7 during these observations. | 120 Å | He ii1640 |
| HST/NICMOS NIC2 | F110W (Broad-band ) | 281 | 1.1 m | 0.6 m | 2188-3829 Å |
| HST/NICMOS NIC2 | F160W (Broad-band ) | 281 | 1.6 m | 0.4 m | 3829-4923 Å |
| Band | bbNumber of common sources used to compute astrometric correction. | ||
|---|---|---|---|
| (arcsec) | (arcsec) | ||
| NDWFS | - | - | - |
| Subaru | 5062 | 0.10 | 0.09 |
| ACS Ly | 8 | 0.17 | 0.13 |
| ACS Heii | 18 | 0.12 | 0.10 |
| ACS | 402 | 0.12 | 0.09 |
| NICMOS | 6 | 0.12 | 0.09 |
| NICMOS | 7 | 0.12 | 0.09 |
| ID | Right Ascension | Declination | ReaaMorphological measurements and denote the effective radius and Sérsic index as measured by GALFIT (Section 3.1.4). | aaMorphological measurements and denote the effective radius and Sérsic index as measured by GALFIT (Section 3.1.4). | bbAperture magnitudes for the , , and bands were computed using 0.4″ diameter apertures and aperture corrections of [1.15, 1.52, 1.76]. | bbAperture magnitudes for the , , and bands were computed using 0.4″ diameter apertures and aperture corrections of [1.15, 1.52, 1.76]. | bbAperture magnitudes for the , , and bands were computed using 0.4″ diameter apertures and aperture corrections of [1.15, 1.52, 1.76]. | SystemccMembership categories based on optical/NIR colors and proximity (see Section 3.1.3): “M1” - likely system member inside a radius of 2.1″ from the AGN (#36); “M2” - likely system member but beyond a radius of 2.1″ from the AGN (#36); “NM” - likely non-member. Objects with membership confirmed by a spectroscopic redshift are indicated with parenthetical remarks. Sources with no membership designation were not well-detected in one or more bands. |
|---|---|---|---|---|---|---|---|---|
| (hours) | (degrees) | (arcsec) | (AB) | (AB) | (AB) | Member? | ||
| 36 | 14:34:10.981 | 33:17:32.48 | 0.39 | 19.9 | 28.24 0.38 | 1.62 0.43 | 1.69 0.22 | M1 (AGN) |
| 26 | 14:34:11.036 | 33:17:34.47 | 0.17 | 1.0 | 25.36 0.03 | 0.09 0.07 | 0.32 0.10 | M1 (LBG) |
| 59 | 14:34:11.041 | 33:17:34.14 | 0.27 | 1.4 | 26.15 0.06 | 0.03 0.15 | 0.36 0.20 | M1 (LBG) |
| 28 | 14:34:10.913 | 33:17:33.80 | 0.15 | 2.0 | 26.86 0.11 | -0.34 0.37 | 1.00 0.42 | M1 |
| 32 | 14:34:10.990 | 33:17:32.89 | 0.31 | 1.4 | 27.17 0.15 | 0.20 0.32 | 1.10 0.33 | M1 |
| 33 | 14:34:11.025 | 33:17:32.70 | - | - | 27.61 0.21 | 0.95 0.30 | 1.10 0.25 | M1 |
| 34 | 14:34:11.085 | 33:17:33.02 | - | - | 27.98 0.30 | 1.35 0.37 | 1.30 0.24 | M1 |
| 35 | 14:34:11.059 | 33:17:32.76 | 0.29 | 2.8 | 26.46 0.08 | 0.72 0.12 | 0.94 0.12 | M1 |
| 37 | 14:34:11.002 | 33:17:32.35 | 0.27 | 2.2 | 26.80 0.11 | 1.10 0.14 | 1.20 0.11 | M1 |
| 1 | 14:34:11.036 | 33:17:25.76 | 0.31 | 2.0 | 26.63 0.09 | 0.96 0.13 | 0.79 0.11 | M2 |
| 18 | 14:34:10.764 | 33:17:36.75 | 0.15 | 0.4 | 27.29 0.16 | 0.67 0.26 | 0.51 0.30 | M2 |
| 21 | 14:34:10.956 | 33:17:36.06 | 0.26 | 0.9 | 26.73 0.10 | 0.68 0.16 | 0.48 0.18 | M2 |
| 24 | 14:34:10.926 | 33:17:34.81 | 0.23 | 0.8 | 26.46 0.08 | 0.34 0.15 | 0.32 0.21 | M2 |
| 29 | 14:34:10.743 | 33:17:33.85 | 0.09 | 1.1 | 26.81 0.11 | 0.31 0.21 | 0.63 0.25 | M2 |
| 45 | 14:34:11.258 | 33:17:30.24 | 0.10 | 0.9 | 27.59 0.21 | 1.71 0.24 | 1.77 0.11 | M2 |
| 52 | 14:34:10.845 | 33:17:27.10 | 0.11 | 0.6 | 26.69 0.10 | 0.24 0.20 | 0.30 0.29 | M2 |
| 57 | 14:34:11.039 | 33:17:25.56 | 0.08 | 0.5 | 26.61 0.09 | 0.94 0.13 | 0.87 0.11 | M2 |
| 2 | 14:34:10.997 | 33:17:25.98 | 0.11 | 0.4 | 28.04 0.32 | - | - | - |
| 27 | 14:34:10.897 | 33:17:34.12 | 0.21 | 0.2 | 27.97 0.30 | - | - | - |
| 38 | 14:34:10.902 | 33:17:32.29 | 0.20 | 2.6 | 27.62 0.22 | - | - | - |
| 43 | 14:34:11.015 | 33:17:31.17 | 0.16 | 0.2 | 27.54 0.20 | - | - | - |
| 47 | 14:34:10.544 | 33:17:29.10 | 0.17 | 0.7 | 27.77 0.25 | - | - | - |
| 48 | 14:34:10.551 | 33:17:28.61 | 0.16 | 0.8 | 27.76 0.25 | - | - | - |
| 49 | 14:34:11.412 | 33:17:29.15 | 0.08 | 0.7 | 27.47 0.19 | - | - | - |
| 9 | 14:34:10.955 | 33:17:38.49 | 0.17 | 0.9 | 27.19 0.15 | 0.82 0.22 | 0.01 0.32 | NM |
| 13 | 14:34:11.251 | 33:17:37.90 | 0.09 | 0.9 | 27.18 0.15 | 0.67 0.24 | -0.29 0.45 | NM |
| 40 | 14:34:10.555 | 33:17:31.92 | 0.11 | 0.7 | 27.46 0.19 | 0.79 0.29 | -0.42 0.57 | NM |
| 58 | 14:34:10.936 | 33:17:36.24 | 0.50 | 4.1 | 27.53 0.20 | 1.13 0.26 | 0.05 0.32 | NM |
| 46 | 14:34:10.850 | 33:17:29.85 | 0.11 | 0.9 | 25.49 0.04 | -0.10 0.09 | 0.30 0.13 | NM ()dd aperture magnitude uncorrected for contamination by \lya emission at ( erg s-1 cm-2; Paper I). |
| 60 | 14:34:10.854 | 33:17:30.05 | 0.13 | 1.0 | 25.97 0.05 | 0.05 0.12 | 0.24 0.18 | NM ()dd aperture magnitude uncorrected for contamination by \lya emission at ( erg s-1 cm-2; Paper I). |
| Diffuse Continuum | Diffuse \lya | Diffuse Heii | |||
|---|---|---|---|---|---|
| Band | |||||
| Restframe wavelength (Å) | 1298-1939Å | 2298-3720Å | 3829-4923Å | 1640-1716Å | |
| GALFIT ParametersaaErrors on morphological parameters are formal fitting errors reported by GALFIT but do not include errors resulting from the continuum subtraction or previous fitting of embedded compact sources. They therefore likely underestimate the true uncertainty in fitting this complex system. | |||||
| Right Ascension (hours) | 14:34:10.940 | 14:34:10.986 | 14:34:10.925bbApproximate position of the Heii source measured from ground-based spectroscopic data (Paper I). | ||
| Declination (degrees) | +33:17:29.87 | +33:17:30.43 | +33:17:29.92bbApproximate position of the Heii source measured from ground-based spectroscopic data (Paper I). | ||
| Size (arcsec) | FWHM ccLimits on the size derived from ACS Heii imaging and ground-based spectroscopic data, as described in Section 3.2.2. | ||||
| Sérsic Index () | |||||
| Axis Ratio (b/a) | |||||
| Position Angle (∘) | |||||
| Total Magnitude (AB) | |||||
| Total Luminosity | |||||
| ( erg s-1) | |||||
| ( erg s-1) | |||||
| Aperture PhotometryddAperture photometry measured at the center of the nebula within a small 1.6″ diameter aperture, chosen to avoid nearby compact sources. No aperture corrections were applied. Limits are 3 values. | |||||
| Magnitude (AB) | |||||
| Luminosity | |||||
| ( erg s-1) | |||||
| ( erg s-1) | eeHeii luminosity measured within a ″ spectroscopic slit assuming (Paper I). |
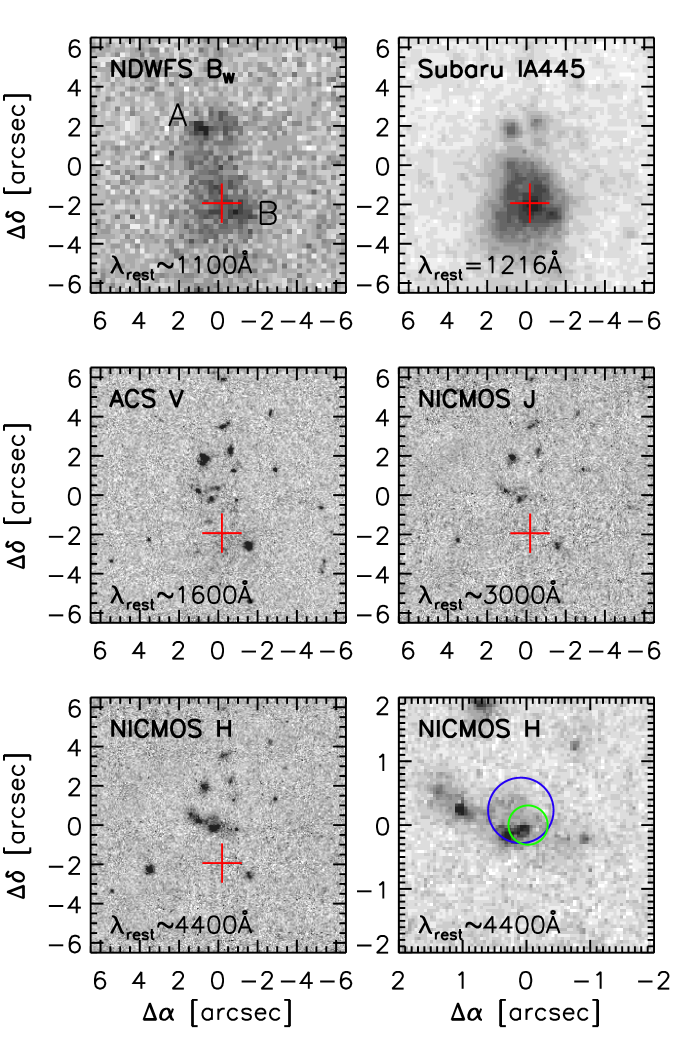
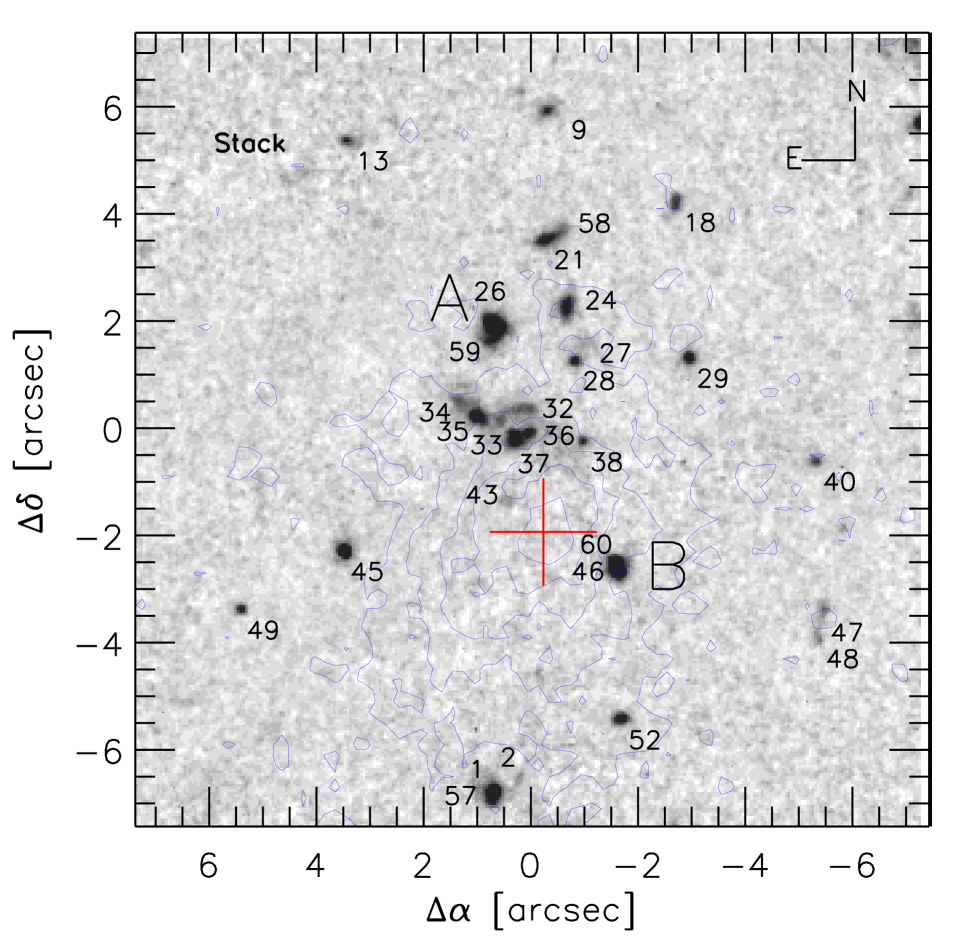
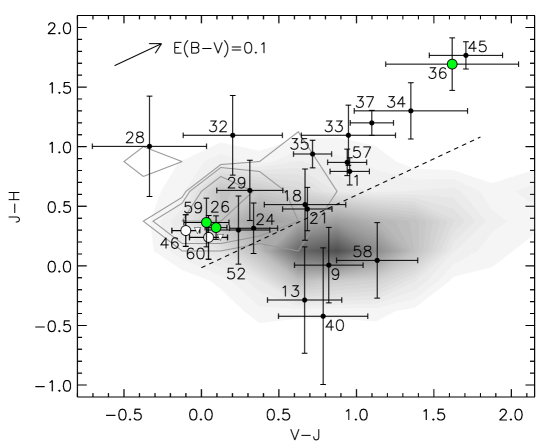
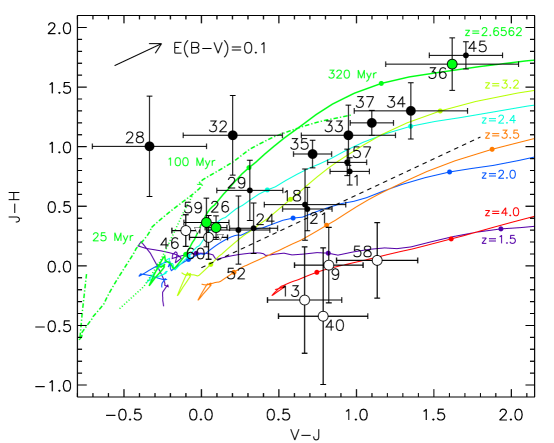
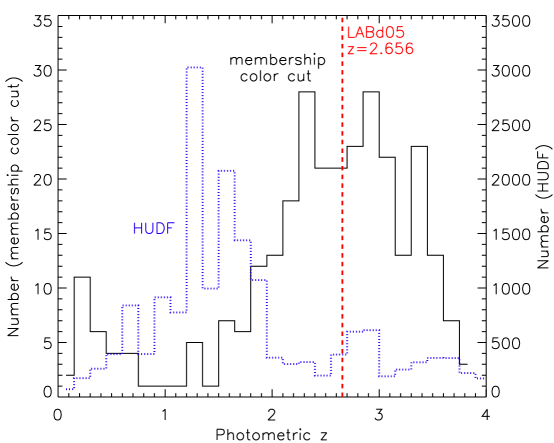
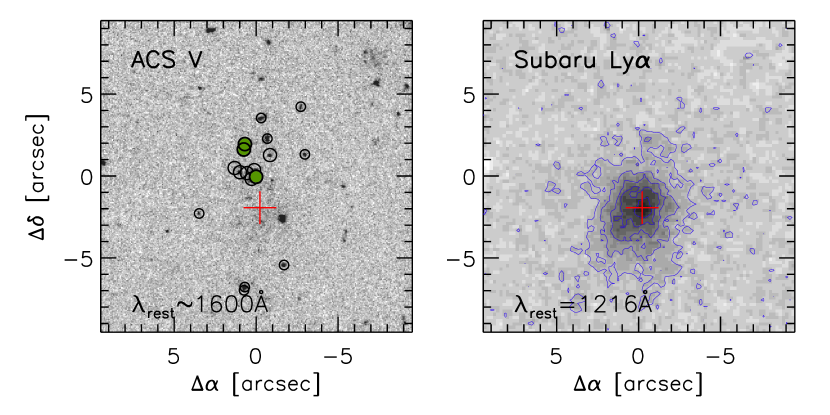
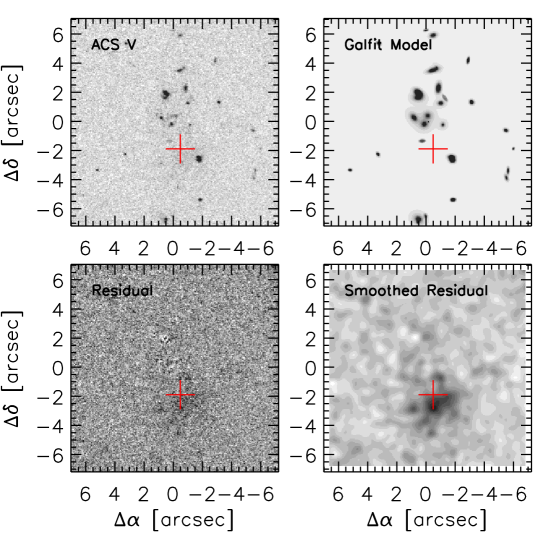
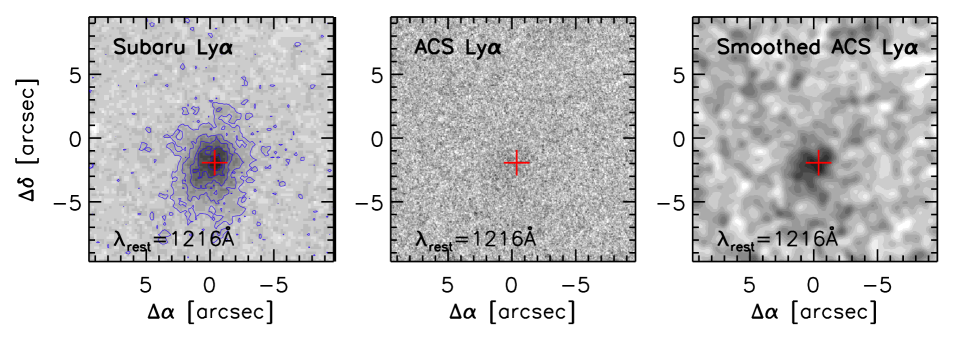
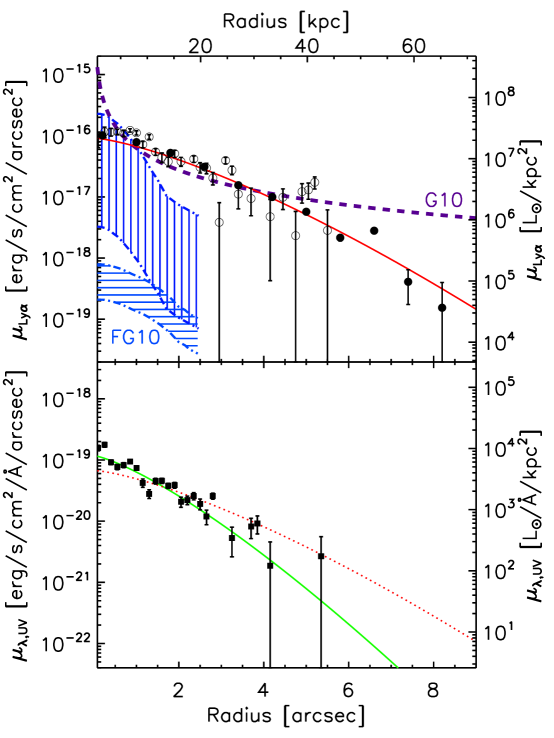
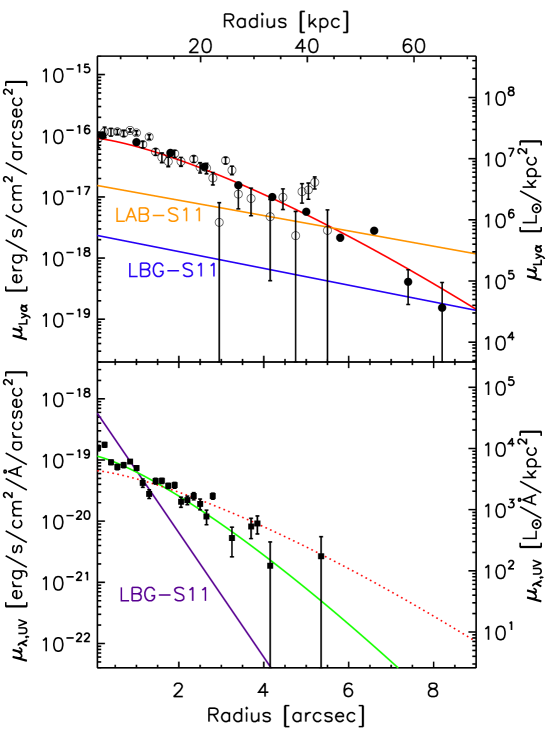
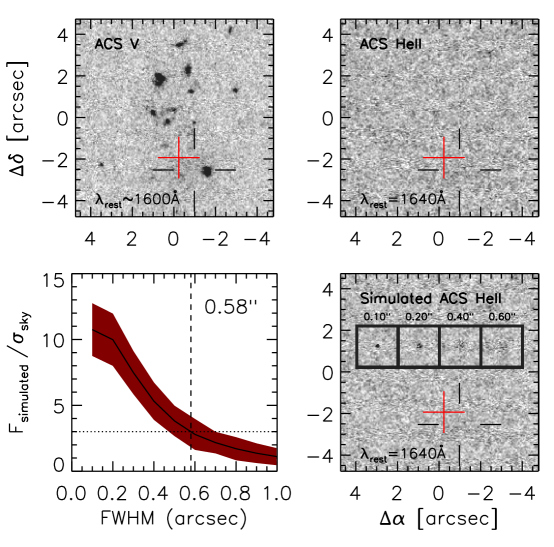
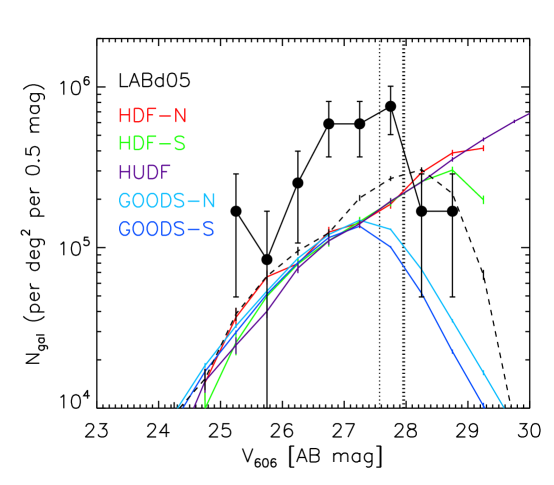
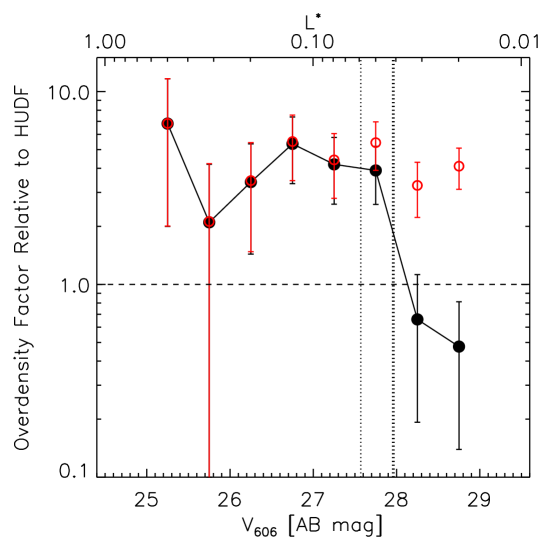
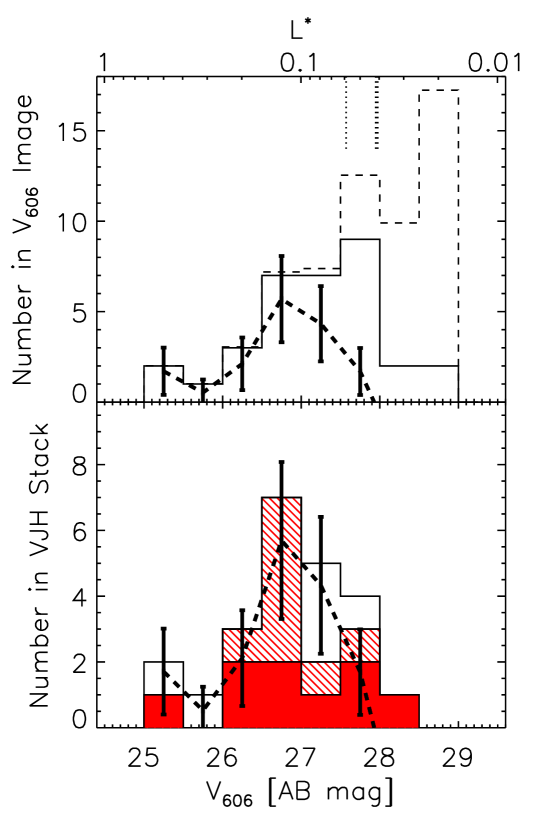
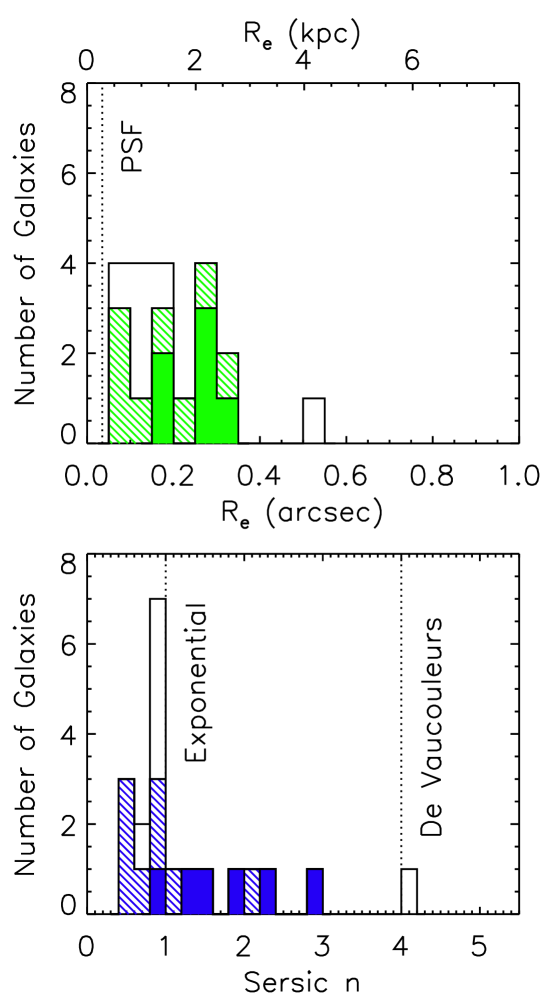
Appendix A Postage Stamps
Postage stamp images of the compact sources in the vicinity of LABd05 are shown in Figures 16-21. From left to right, the panels display the stacked image and the individual , , and -band images. Object ID numbers are shown in the upper left-hand corner of the stacked image, and the membership category (where applicable) is given in the upper right-hand corner. The AGN (#36) and both components of the LBG (#26 and #59) are labeled in the lower right-hand corner.
We note that the current data are not sufficient to distinguish whether the object pairs (#26+59, #1+57, #21+58, and #46+60) are true companions or just morphological peculiarities (i.e., tidal features, dust lanes, etc.) associated with the primary object. For our analysis we have chosen to treat each of the object pairs as two separate objects. Treating them each as a single object would decrease the number of sources in the “M1” category by one and the “M2” category by two, but this does not significantly alter our conclusions regarding the nature of the member galaxies or the overall luminosity function within the LABd05 system.