High-Energy Gamma-ray Emission Properties of an Anomalous X-ray Pulsar, 4U 0142+61
Abstract
Anomalous X-ray Pulsars (AXPs) are bright X-ray sources. Few AXPs emit highly pulsed emission in hard X-rays. Using data collected with the Large Area Telescope on board Fermi Gamma-ray Space Telescope, we explored high-energy gamma-ray emission from the brightest AXP, 4U 0142+61. We do not detect any significant emission from the source. Here, we present the upper limits to the persistent and pulsed emission of 4U 0142+61 in the high-energy gamma-ray domain.
I introduction
Anomalous X-ray Pulsars (AXPs) are bright X-ray emitters; their luminosities (below 10 keV) range from to erg s-1 that exceed their spin-down luminosity. Their spin periods are clustered between 212 s and spin-down rates are relatively large, i.e., between s s-1 (see (Mereghetti, 2008) for a review). Their observational properties are explained either with a fallback disk (Chatterjee et al., 2000; Alpar, M. A., 2001) or by the decay of their strong magnetic field (magnetar model) (Thompson & Duncan, 1996).
Until the discovery of hard X-ray emission from AXPs 1E 1841-045 (Kuiper et al., 2004), 4U 0142+61 (den Hartog et al., 2004) and 1RXS J170849.0-400910 (Revnivtsev et al., 2004) they were known to be emitting soft X-rays only ( 10 keV). The origin of hard X-ray emission is still not well understood. Emission from corona (Beloborodov & Thompson, 2007), breakdown of fast-modes via quantum electrodynamics effects (Heyl & Hernquist, 2005a, b) and resonant Compton upscattering of soft photons (Baring & Harding, 2007) are proposed to explain the hard-X ray emission.
Construction of spectral behaviors of these sources in a broad energy band is important for understanding the origin of the hard X-ray emission. Here we present the upper limits to the persistent and pulsed high-energy gamma-ray emission from 4U 0142+61 at the GeV range. We estimated an upper limit to the spectral break energy by extending the Fν spectrum of the source to GeV range.
II Observations and Data Analysis
The LAT observations between 2008 August 4 to 2010 April 29 with an exposure time of 31.7 Ms were used to investigate the persistent emission from 4U 0142+61. We obtained and analyzed the data from radius around the source and also, a radius region was selected and analyzed in order to avoid contamination from nearby bright sources. Spectral fits and flux calculations were done with the Python version of gtlike, pyLikelihood, for the 0.21.0 and 1.010.0 GeV energy bands. See (Şaşmaz Muş & Göğüş, 2010) for the details of LAT data calibration.
To perform timing analysis, all event photon arrival times were extracted from a region and converted by gtbary to the arrival times at the solar system barycenter. We used 210 keV RXTE observations and found the spin ephemeris of the source between 2008 August 4 and 2010 April 30 which also covers the extracted LAT observations.
To search for pulsed high-energy gamma-ray emission from 4U 0142+61, first we obtained the spin ephemeris of the source using contemporaneous RXTE/PCA observations in the 210 keV range with a total exposure of 196 ks. A Fourier based epoch folding technique was applied to the data to obtain the spin ephemeris. We generated the pulse profiles of the source using three consecutive PCA observations around the epoch (MJD 54713.5) which are grouped such as they are separated at least 0.2 days from each other. We determined the phase shift of each pointing with respect to the template by cross correlating the pulse profiles of each group of pointings with the template profile and fitted the phase shifts with a polynomial. In Table 1 we present the best fit spin ephemeris parameters of 4U 0142+61. We used the precise PCA spin ephemeris that we obtained to search for pulsed high-energy gamma-ray emission from 4U 0142+61. We generated the LAT pulse profiles in the 0.21.0 GeV and 1.010.0 GeV energy ranges and found that both LAT profiles are consistent with random fluctuations with respect to its mean.
| Parameter | Value |
|---|---|
| Range (MJD) | 54682.6 55315.1 |
| Epoch (MJD) | 54713.5 |
| (Hz) | 0.1150900026(9) |
| ( Hz s-1) | 2.745(8) |
| ( Hz s-2) | 3.6(3) |
III Results
After processing the data as explained in §2, we fitted a power-law to the data obtained from radius region with an index of 2.5. The fit results a test statistics (TS) value of 0.23 which implies a detection significance less than 1. We calculated 3 flux upper limits as 2.32 10-6 MeV cm-2 s-1 in the 0.21.0 GeV band and 1.28 10-6 MeV cm-2 s-1 in the 1.010.0 GeV band. For the radius region power-law fit with an index of 3 resulted in a TS value of 3 which implies a detection significance less than 2. The 3 flux upper limits are 5.72 10-6 MeV cm-2 s-1 and 1.29 10-6 MeV cm-2 s-1 for 0.21.0 GeV and 1.010.0 GeV, respectively.
We searched for pulsed high-energy gamma-ray emission from 4U 0142+61 by folding the Fermi/LAT data with the precise spin ephemeris obtained using contemporaneous RXTE/PCA observations. Our search for emission yields random fluctuations with respect to its mean (See Figure 2).
The 3 upper limits to the RMS pulsed amplitude are 1.5% and 2.3% in the 0.21.0 GeV and
1.010.0 GeV band, respectively. A search in the lower energy part of the LAT passband (30200 MeV) also yields in no evidence of pulsed emission; the 3 RMS pulsed amplitude upper limit is 1.6%.


IV Discussion
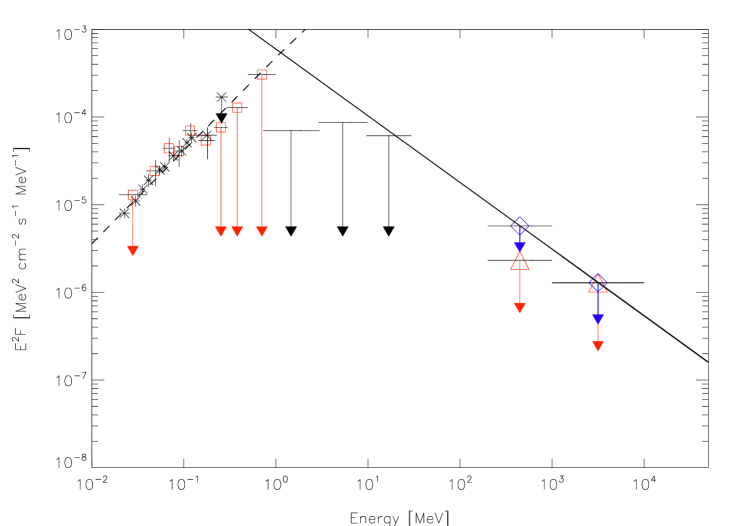
We used the LAT persistent emission upper limits to extend the Fν spectrum of 4U 0142+61 presented in (den Hartog et al., 2008) to the 10 GeV. We could place an upper limit to the very high-energy gamma-ray emission trend (i.e., the LAT results obtained using the region) which is a power law with an index of 0.76 (solid line in Figure 1). INTEGRAL/ISGRI data is fitted with a power law index of 0.93 0.06 by (den Hartog et al., 2008) as shown with dashed line in Figure 1. The intersection of two curves suggests an upper limit of 1.1 MeV to the spectral break energy.
The models presented in (Beloborodov & Thompson, 2007) and (Heyl & Hernquist, 2005a, b) estimate a spectral break energy of about 1 MeV which is consistent with the break energy that we estimated. If there is a significant excess emission in optical band as in the 4U 0142+61 (Hulleman et al., 2000), quantum electrodynamics model (Heyl & Hernquist, 2005a, b) predicts an increase in the 10 200 MeV range. Excess optical emission can be due to the star itself (Kern & Martin, 2002; Dhillon et al., 2005) or the disk around the star (Wang et al., 2006; Ertan & Çalışkan, 2006). If the source of the excess optical emission is the disk, quantum electrodynamics model is consistent with our results since the star itself would not be excessive in optical band. Outer gap model of AXPs within the magnetar interpretation (Cheng & Zhang, 2001) also predicts high-energy gamma-ray emission from the source. Recently, (Tong et al., 2010) and (Tong et al., 2011) suggested that non-detection is inconsistent with the outer gap model and fallback interpretation cannot be eliminated.
Acknowledgements.
S.Ş.M. and E.G. acknowledge EU FP6 Transfer of Knowledge Project, Astrophysics of Neutron Stars (MTKD-CT-2006-042722).References
- Mereghetti (2008) Mereghetti, S., A&AR, 2008, 15,225
- Chatterjee et al. (2000) Chatterjee, P. et al., ApJ, 2000, 534, 373
- Alpar, M. A. (2001) Alpar, M. A., ApJ, 2001, 554, 1245
- Thompson & Duncan (1996) Thompson, C., & Duncan, R. C., ApJ, 1996, 473, 322
- Kuiper et al. (2004) Kuiper, L., et al., ApJ, 2004, 613, 1173
- den Hartog et al. (2004) den Hartog, R. P. et al., ATel, 2004, 293, 1
- Revnivtsev et al. (2004) Revnivtsev, M. G. et al., Astron. Lett., 2004, 30, 382
- Beloborodov & Thompson (2007) Beloborodov, A. M. & Thompson, C., ApJ, 2007, 657, 967
- Heyl & Hernquist (2005a) Heyl, J. S., & Hernquist, L., ApJ, 2005a, 618, 463
- Heyl & Hernquist (2005b) Heyl, J. S., & Hernquist, L., MNRAS, 2005b, 362, 777
- Baring & Harding (2007) Baring M. G., & Harding, A. K., Ap&SS, 2007, 308, 109
- den Hartog et al. (2008) den Hartog, R. P. et al., A&A, 2008, 489, 245
- Hulleman et al. (2000) Hulleman, F. et al., Nature, 2000, 408, 689
- Kern & Martin (2002) Kern, B., & Martin, C., Nature, 2002, 417, 527
- Dhillon et al. (2005) Dhillion, V. S. et al., MNRAS, 2005, 363, 609
- Wang et al. (2006) Wang, Z. et al., Nature, 2006, 440, 772
- Ertan & Çalışkan (2006) Ertan, Ü., & Çalışkan, S., ApJ, 2006, 649, L87
- Cheng & Zhang (2001) Cheng, K. S. & Zhang, L., ApJ, 2001, 562, 918
- Tong et al. (2010) Tong, H. et al., ApJ, 2010, 725, L196
- Tong et al. (2011) Tong, H. et al., ApJ, 2011, 738, 31
- Şaşmaz Muş & Göğüş (2010) Şaşmaz Muş, S. & Göğüş, E., ApJ, 2010, 723, 100