Exchange–correlation effects in the monoclinic to tetragonal phase stabilization of Yttrium–doped : a first–principles approach
Abstract
We describe, within an ab–initio approach, the stabilization of the tetragonal phase vs. the monoclinic one in Yttrium–doped Zirconia. The process is believed to be influenced from different mechanisms. Indeed we show that there is a delicate balance between the change in electrostatic and kinetic energy and exchange–correlation effects. In the tetragonal phase the perturbation induced by doping is better screened at the price of sacrificing correlation energy. Our work opens the opportunity to use the same approach to predict the tetragonal phase stabilization of materials like Zirconia or Hafnia, with different and less characterized dopants.
pacs:
64.70.K-, 71.15.Mb, 81.05.Je, 81.30.BxI Introduction
Zirconia () is a hard and usually colorless material with a wide range of technological applicationsHeurer1981-84 . Being corrosion resistant it is used as a dental material and because of its low cost, durability, and close visual likeness to diamond, it is widely used to synthesize artificial gems. It is used as a thermal barrier in coating engines due to its high resistance. The addition of cations (as for example ) induces the generation of oxygen vacancies for charge compensation which makes it useful as oxygen sensor. Moreover Zirconia is an high dielectric constant (high-) material with potential applications in the micro–electronics. Finally, very recently, transition–metals doped Zirconia has been predicted to be a dilute magnetic semiconductor (DMS) with high Curie Temperature with potential applications in the field of spintronics Ostanin2007 ; while pure and doped has been proposed as a candidate material for resistive switching memories devices Wu2007 ; Zhang2010 (ReRAM) exploiting the high vacancies mobility of the system.
Pure exhibits at ambient pressure three polymorphisms. The monoclinic (M) phase is stable at low temperature and is the less symmetric structure with the ions exhibiting sevenfold coordination. Between 1440 and 2640 K the tetragonal (T) phase, with eightfold coordinated ions is stable. Finally above 2640 K, till melting temperature (K), the most symmetric cubic (C) phase is stabilizedRignanese2005 ; Dewhurst1998 . The only difference between the (C) and the (T) phase is a distortion of the oxygen sub–lattice with a spontaneous symmetry breaking. The (T) and (C) phases are more used in technological applications and both the (T)/(C) structures and the (T) (C) doping induced phase transition (DIPT) have been well characterized in the literature both form the theoretical and the experimental point of view Stefanovich1994 ; Stapper1999 ; Ostanin2002A ; Ostanin2002B ; Lau2009 ; Goff1999 ; Aldebert1985 ; Howard1988 ; Lamas2000 ; Clarke2003 ; Rignanese2005 , with ions the most used and studied dopants.
On the other hand the (M) (T) DIPT is much less characterized, especially from the theoretical point of view. It presents a volume change of about that causes extensive cracking in the material. This behavior destroys the mechanical properties of fabricated components and makes pure Zirconia useless for structural or mechanical application. Moreover the (T) phase, is metastable in pure and lightly doped over a very long time; a growth sample of doped Zirconia must be annealed in order to check if the reached tetragonal phase is stable or meta–stable. Hence a better understanding of the (M) (T) DIPT is desirable. In this paper we address the problem from a first principle perspective and, in particular, we show that the DIPT is a balance of the mean field (MF) description (i.e. kinetic plus electrostatic: ) with exchange–correlation effects which cannot be captured by simplified models.
II First principles description.
II.1 Computational details.
| Present work | Theory | Experiment | |||
|---|---|---|---|---|---|
| (M) | |||||
| Ref.[Jiang2010, ] | Ref.[Stapper1999, ] | Ref.[Howard1988, ] | Ref.[Wyckoff1966, ] | ||
| a (Å) | 5.18 | 5.05 | 5.15 | 5.15 | |
| b/a | 1.011 | 1.027 | 1.012 | 1.012 | |
| c/a | 1.037 | 1.028 | 1.023 | 1.032 | |
| (T) | |||||
| a (Å) | 5.11 | 5.02 | 5.03 | 5.07 | |
| c/a | 1.030 | 1.014 | 1.017 | 1.026 | 1.018 |
We work within density functional theory Hohenberg1964 ; Kohn1965 (DFT) in the generalized gradient approximation PBE (GGA) with ultrasoft pseudopotentials Vanderbilt1990 ; rrkjus1990 . Both for Yttrium an Zirconium the pseudopotentials includes semicore electrons and non–local core correction. The Quantum Espresso QE package is used to solve the Kohn–Sham Kohn1965 (KS) equations for a super–cell with 96 atoms (down to 92 when oxygen vacancies are considered). We checked that a cut–off of 35 Ry for the wave–functions and 400 Ry for the augmentation charge, a k-point grid are needed in order to have the energy difference between the tetragonal and the monoclinic phase converged to up to eV per molecular unit (m.u.), where the energy difference is of the order of - eV/m.u. .
As starting point we relaxed atomic positions and structure of pure with 12 atoms in the unit cell of the (T) and (M) phases. The (C) phase is unstable and is not considered at zero doping NoteD . The results, reported in Tables 1-2, are in good agreement with experimental data and previous theoretical works within the DFT error (%).
| Present work | Theory | Experiment | ||
| (M) | ||||
| Ref.[Stapper1999, ] | Ref.[Howard1988, ] | |||
| (0.276,0.044,0.210) | (0.277,0.043,0.210) | (0.275,0.040,0.208) | ||
| (0.065,0.327,0.350) | (0.064,0.324,0.352) | (0.070,0.332,0.345) | ||
| (0.451,0.757,0.475) | (0.450,0.756,0.479) | (0.450,0.757,0.479) | ||
| (T) | ||||
| Ref.[Aldebert1985, ] | Ref.[Fukuhara1993, ] | |||
| 0.057 | 0.044 | 0.057 | 0.042 | |
We correctly find that the (M) phase is favored with an energy difference [eV/mol] in agreement with previous works (0.063 [eV/mol]Stapper1999 , 0.144 [eV/mol]Dewhurst1998 ); the experimental estimation is 0.063 [eV/mol]Achermann1975 .
II.2 Yttria–stabilized Zirconia
The (T) and the (C) phase of Zirconia can be stabilized with Yttria () doping, with a phase diagram for Yttria–stabilized Zirconia (YSZ) which has been extensively characterized experimentally. Also the (T) and (C) phases of Y–doped Zirconia have been studied within a theoretical approach in a number of works Stapper1999 ; Ostanin2002A ; Ostanin2002B , while no systematic study of the Y–doped (M) phase or of the (M) (T) DIPT has been reported in the literature.
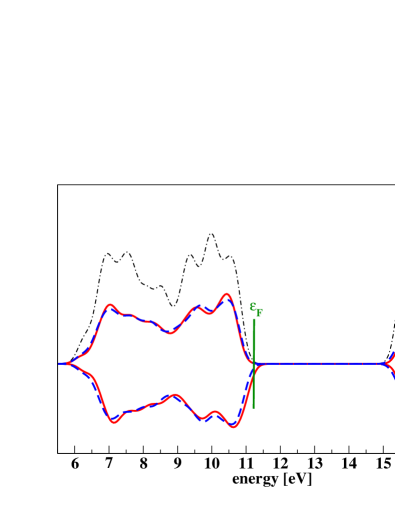
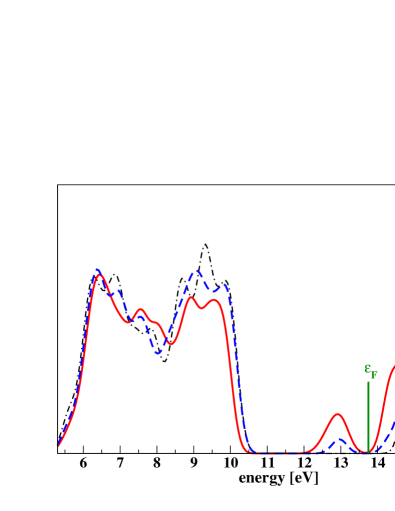
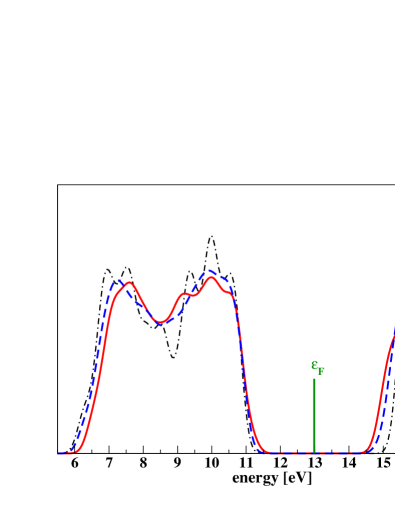
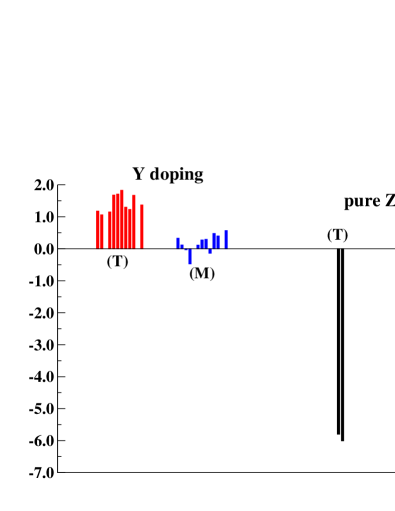
–doping is known to induce oxygen vacancies. We show in Fig. 1 how the Kohn–Sham (KS) density of states changes if vacancies are present both in pure and doped crystals at low doping NoteC .
Moreover we compute the energy the system gains producing vacancies (see the caption of Fig. 1 for more details) for different doping concentrations. A correct modelling of the material must consider the possible relative positions of the dopants (as substitutional defects) and the vacancies. We found out that the relative position of Y atoms among themselves plays a minor role, in agreement with the other works Ostanin2002A , and in our system we kept these as far as possible to mimic uniform doping. Instead the position of vacancies respect to Y atoms or to other vacancies influences significantly the total energy of the system. Stapper et al.Stapper1999 reported that in the cubic system isolated vacancies tend to be next nearest neighbor (NNN) to atoms with an energy gain of eV per vacancy against the nearest neighbor (NN) configuration in a supercell with 1 atom and 1 vacancy. This result is confirmed also by Ostanin et al.Ostanin2002A in a supercell with 2 atoms and 1 vacancy with eV between the two configurations -- and -- in favor of the second in the (C) phase and eV in the (T) phase. Also in the present work we found eV considering 1 vacancy and 2 atoms.
In the (M) phase two nonequivalent oxygen atoms exist, one with coordination and another with coordination , and, accordingly there are four possible configurations. we found that the case favored of 0.21, 0.36 and 0.80 eV against , and respectively; here the labels and refer to the coordination that would have the vacant oxygen. At the best of our knowledge, no results have been reported in the literature about the position of vacancies in the (M) phase.
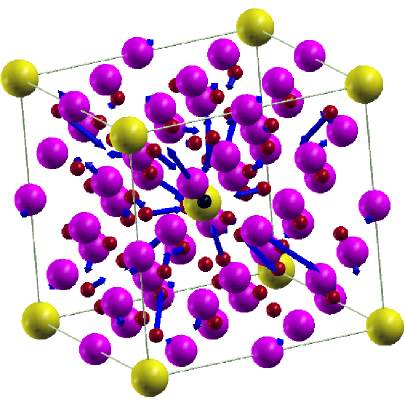
The most favored configuration, for both the (T) and the (M) phase, is represented in Fig. 2, together with the forces acting on each atom in the initial geometry of pure . The ions are not attracted by the oxygen vacancies and indeed in the (M) phase they are pushed away from the vacancy. Hence both the analysis of the energetically favored configuration and the internal relaxation of the ions does not follow the intuitive scheme of charged defects with the vacancies a and the ion a charged sites, suggesting that exchange–correlation effects play a role in the stabilization mechanism.
Also the relative vacancy–vacancy orientation and position is in contrast with an electrostatic based model. In the (C)/(T) phase, while Stapper et al.Stapper1999 based their calculation on the assumption that oxygen vacancies should remain as far as possible, Ostanin et al.Ostanin2002A results suggest that oxygen vacancies tend to couple along the direction with a single ion in between, thus at a relative distance of about Å. Also experimental X–ray data Goff1999 seems to support this idea. No data about the orientation of oxygen vacancies in the (M) phase is present in the literature.
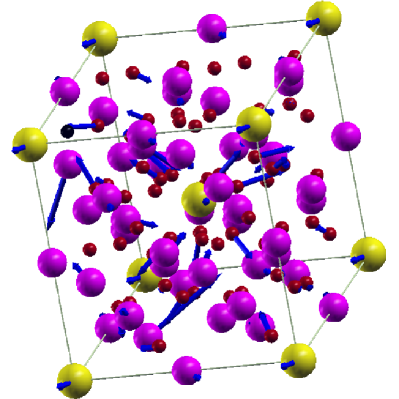
Changing the relative position of di–vacancy complex in our model (i.e. two vacancy at ) we found differences in total energy of eV (per di–vacancy). The oscillations in the mean field (MF), i.e. the sum of the kinetic NoteA and electrostatic energy, and the exchange–correlation (xc) component of the energy are much more pronounced, with eV and eV. We will discuss this more in detail in the next section. Our results are, in some aspects, different from the ones suggested by the two cited works. Indeed we found that, while vacancies does not repel, the configuration suggested as most favorable for the (T) structure by Ostanin et al.Ostanin2002A , is not the lowest in energy. Indeed, surprisingly, the latter comes out to be unstable, with one of the two vacancies which changes position if we let the system relax (Fig. 3). This last result suggests that, in presence of vacancies, oxygen atoms can move with (nearly) no potential barrier to overcome. This is a theoretical evidence that YSZ is a good ionic conductor. Indeed this property is important for many applications and has been investigated in other works Pietrucci2008 .
We also considered some cases at atomic doping concentrations of and one test case at . Both for and there is a huge number of possible relative position of the oxygens and we did not try to systematically explore which is the best configuration. At the best found configuration has two vacancies aligned in the plane. A simple explanation of this fact could be provided considering the axial anisotropy of the dielectric constant () of the (T) phase. The component are larger than the , thus providing a more effective screening of charged oxygen vacancies placed along the plane. However we did not find this to be the sole mechanism, as some of the other configurations with the vacancies aligned in the plane have higher energy than some configurations with the vacancies aligned, for example, in the plane.
To conclude this section, the behavior of the oxygen vacancies present some differences, and some similarities, between the two phases of Zirconia. A key important difference however is that the formation of vacancies is more favored in the (T) phase than in the (M) phase as one can see from Fig. 1(d). This fact indeed implies that doping tends to stabilize the (T) phase.
II.3 Theoretical stabilization: –energy and vacancies.
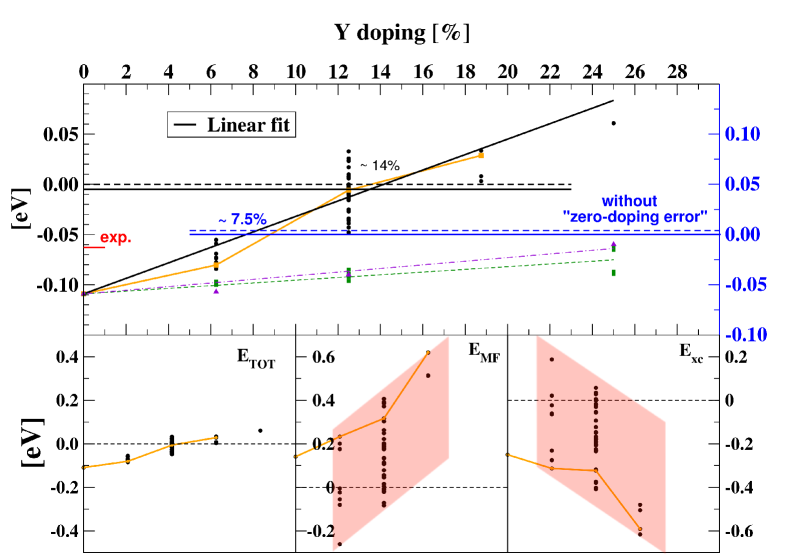
The configuration explored allow to model the (M)(T) DIPT as a function of the Yttria doping. In Fig. 4 we see that the energy difference between the (T) and the (M) phase decrease increasing the doping concentration. This is a clear signature that we are correctly describing the DIPT. However the stabilization of the (T) phase happens, after a linear fit of our data, at higher doping concentration, %, than the experimental value % Lamas2000 . The main error is due to an overestimation of the zero–doping energy difference of eV/m.u. ( eV/m.u. Achermann1975 while eV/mu.u.). Indeed it is reasonable to assume that the trend of the energy difference is better computed than its absolute value and accordingly assuming a constant “zero–doping error” for every concentration we can subtract it (the zero energy in Fig. 4 shifts from the black line to the blue line) obtaining , which is in excellent agreement with the experimental value. Similar results are obtained if one consider, instead of the linear fit, the energy difference between the two best configurations (orange dashed line in Fig. 4).
For the pure we have also computed the contribution to the Helmholtz free energy due to thermal excitations of phonons. We found that the difference in the thermal contribution is negligible at room temperature, while the difference of the zero point phonon energy between the two phases is eV/m.u. , with a small effect on the value of (In Fig. 4 this amounts to the shift of the zero from the dashed to the continuous line).
It is interesting to compare how the mean field energy, , and the exchange–correlation energy, , change considering different configurations. In Fig. 4, bottom panels, we see that the two component oscillate about 10 times more than the total energy as a function of the chosen atomic configuration. The mean field energy, in pure , is lower in the (T) phase (Fig. 4, central bottom panel); that is, if the xc–energy is neglected, the (T) phase is thermodynamically the most stable. The inclusion of doping and oxygen vacancies enhance this aspect as, on average , with the atomic doping content and . This is likely because the tetragonal phase, which has an higher dielectric constant, better screens the electrostatic perturbation induced by the doping NoteE .
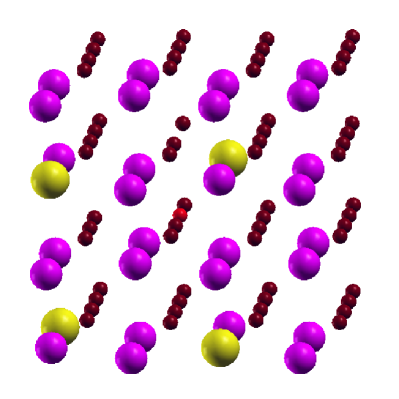
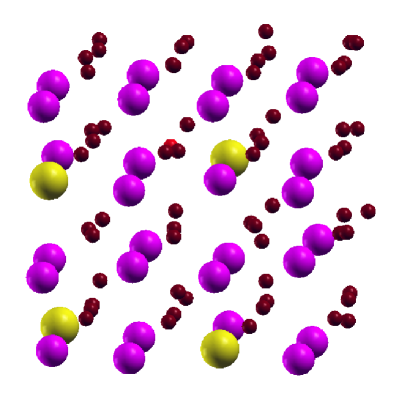
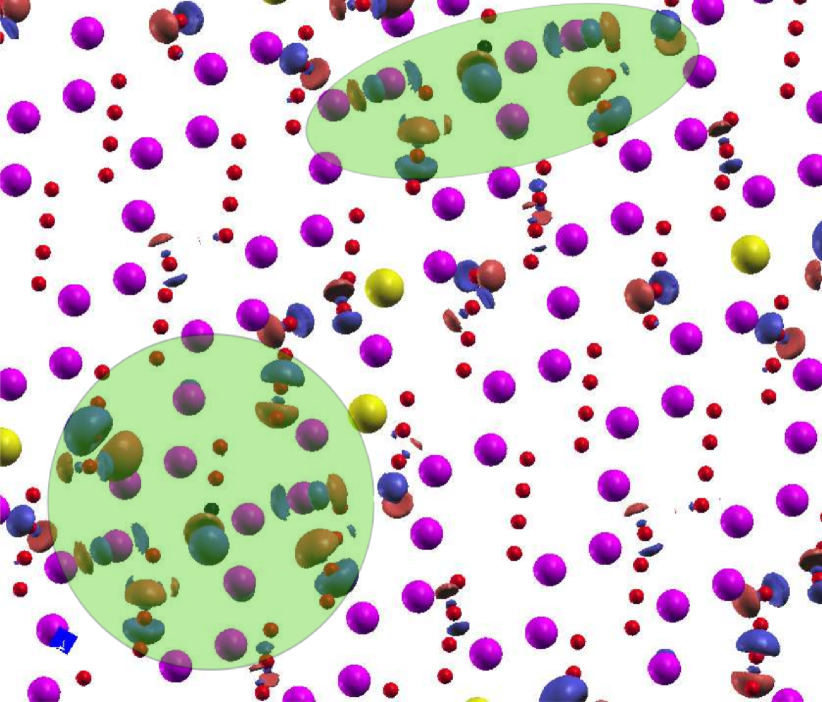
In order to have a picture of the screening effect we have defined (see Fig. 5 and caption) the polarization charge, that is the difference in the electronic density between the pure and the doped system. In Fig. 5 we see that the main perturbation is induced by the oxygen vacancies. The screening mechanism however is very efficient and accordingly the value of the polarization charge is sensibly different from zero only on the atoms NN to the vacancies.
The –energy in pure instead is lower in the (M) phase and on average . To understand this point we consider the perturbations induced in the electronic part of the Hamiltonian of pure , that is , where is the additional perturbation generated from the dislocation of the atoms. has the shape of a random potential in a perfect periodic system which tends to destroy the collective behavior of the electron gas and thus electrons lose correlation. This is not an “on site” correlation, but rather a “ranged” correlation energy and so we expect that GGA can better describe this effect than LDA. While is similar for the two phases, i.e. we are considering the same kind of doping, the term is greater in the (T) phase due to its higher screening (see note NoteE, ). Accordingly the –energy is more penalized, that is . This explains and thus we can infer that in the screening process electrons lose –energy.
III Conclusions
The phase transition of Zirconia induced with Yttria doping is very well known experimentally and indeed Yttria stabilized Zirconia is commonly used in many applications. Our results show that an ab–initio approach is able to correctly describe this mechanism, with a predicted phase transition at a doping concentration of , in good agreement with experimental data. This result confirms the opportunity to predict the effect of other less characterize kind of doping which could be of potential interest for new applications, as for example doping with magnetic materials Ostanin2007 .
Moreover, within density functional theory we can explore how physical properties of the system are influenced by doping. As an example we considered how different components of the energy changes and in particular the behavior of the exchange–correlation energy. We showed that oxygen defects play a major role in the phase transition and how the perturbation induced by oxygen vacancies to the system is screened in the high-k tetragonal phase. The same approach could be used to check the effect of doping on other quantities, which are not easily accessible experimentally; among others, the value of the dielectric constant, which has a key importance for applications in the field of micro–electronics.
Finally these results, improving our understanding of the phase transition, can also be used to tune the parameters of models for the description of realistic devices based on Zirconia, whose dimensions are still beyond the capabilities of first–principles simulations.
IV Acknowledgments
This work was funded by the Cariplo Foundation through the OSEA project (n. 2009-2552). The authors would like to acknowledge Professor Giovanni Onida and the ETSF ETSF Milan node for the opportunity of running simulations on the “etsfmi cluster”. We also acknowledge computational resources provided under the project OSEA by the Consorzio Interuniversitario per le Applicazioni di Supercalcolo Per Universitá e Ricerca (CASPUR).
References
- (1) Science and Technologies of Zirconia and Science and Technologies of Zirconia II, edited by A. Heurer and L. W. Hobbs in Advances in Ceramics, Vol. 3 (1981) and Vol. 12 (1984) (The American Ceramic Society, Westerville, OH)
- (2) S. Ostanin, A. Ernst, L. M. Sandratskii, P. Bruno, M. Däne, I. D. Hughes, J. B. Staunton, W. Hergert, I. Mertig, and J. Kudrnovskỳ, PRL 98, 016101 (2007)
- (3) X. Wu, P. Zhou, J. Li, L. Y. Chen, H. B. Lv, Y. Y. Li, and T. A. Tang, APL 90, 183507 (2007)
- (4) H. Zhang, B. Gao, B. Sun, G. Chen, L. Zeng, L. Liu, X. Liu, J. Lu, R. Han, J. Kang, B. Yu, APL 96, 123502 (2010)
- (5) G.-M. Rignanese, J. Phys.: Condens. Matter 17, R357 (2005)
- (6) J. K. Dewhurst, and J. E. Lowther, Phys. Rev. B 57, 741 (1998)
- (7) E. V. Stefanovich, A. L. Shluger, C. R. A. Catlow, Phys. Rev. B 49, 11560 (1994)
- (8) G. Stapper, M. Bernasconi, N. Nicoloso, and M. Parrinello, Phys. Rev. B 59, 797 (1999)
- (9) S. Ostanin, A. J. Craven, D. W. McComb, D. Vlachos, A. Alavi, A. T. Paxton, and M. W. Finnis, Phys. Rev. B 65, 224109 (2002)
- (10) S. Ostanin, E. Salamatov, A. J. Craven, D. W. McComb, and D. Vlachos, Phys. Rev. B 66, 132105 (2002)
- (11) K. C. Lau, and B. Dunlap, J. Phys.: Condens. Matter 21, 145402 (2009)
- (12) J. P. Goff, W. Hayes, S. Hull, M. T. Hutchings, and K. N. Clausen, Phys. Rev. B 59, 14202 (1999)
- (13) P. Aldebert, and J. P. Traverse, J. Am. Ceram. Soc. 68, 34 (1985)
- (14) C. J. Howard, R. J. Hill, and B. E. Reichert, Acta Crystallogr., Sect. B: Struct. Sci. 44, 116 (1988)
- (15) D. G. Lamas, N. E. Walsöe De Reca, Journal of Materials Science 35, 5563 (2000)
- (16) D.R. Clarke and C.G. Levi, Annu. Rev. Mater. Res. 33, 383 (2003)
- (17) H. Jiang, R. I. Gomez-Abal,P. Rinke, and M. Scheffler, Phys. Rev. B 81, 085119 (2010)
- (18) R. W. G. Wyckoff, Crystal Structure (Interscience, New York, 1996)
- (19) P. Hohenberg, and W. Kohn, Phys. Rev. 136, B864 (1964)
- (20) W. Kohn, and L. J. Sham, Phys. Rev. 140, A1133 (1965)
- (21) J. P. Perdew, K. Burke, and M. Ernzerhof, Phys. Rev. Lett. 77, 3865 (1996)
- (22) D. Vanderbilt, Phys. Rev. B 41, 7892R (1990)
- (23) A. M. Rappe, K. M. Rabe, E. Kaxiras, and J. D. Joannopoulos, Phys. Rev. B 41, 1227R (1990)
- (24) P. Giannozzi et al., J. Phys.:Condens. Matter 21 395502 (2009); http://www.quantum-espresso.org
- (25) Also for the doped case we considered only the (M) and the (T) phases. Indeed the (C) phase is a special (T) phase with and . The description of this phase is included in our work as we let the atoms relax their position and, in few cases, also the cell parameters.
- (26) M. Fukuhara and I. Yamauchi, J. Mater. Sci. 28 4681 (1993)
- (27) R. J. Achermann, E. G. Rauh, and C. A. Alexander, High. Temp. Sci. 7, 305 (1975)
- (28) Thought these are not the physical DOS, in other works Jiang2010 ; Gruning2010 it has been shown that for the main difference with the real DOS amounts in a red shift of the gap as common within DFT/LDA.
- (29) Here what we consider is the KS kinetic energy.
- (30) F. Pietrucci, M. Bernasconi, A. Laio, and M. Parrinello Phys. Rev. B 78, 094301 (2008)
- (31) Here we are studying the response of pure to a static external perturbation . The self–consistent solution, in the Bohr–Oppenheimer approximation, of the ionic plus the electronic Hamiltonian describes the full response of the system to this perturbation. For a comparison the static dielectric constant of pure can give an insight on how the system will react to this perturbation to linear order. In the self–consistent solution the phononic contribution to the dielectric constant, , is accounted by the relaxation of the atomic positions, while the electronic contribution, , is acconted by the the solution electronic part of the Hamiltonian . In high–k materials like Zirconia the contribution from the lattice is dominant. The (T) phase has higher dielectric constant and accordingly we expect a greater distortion of the crystal, provided that the linear order behavior is respected to all orders.
- (32) Recent experimental results seems to suggest that the (T) phase can be stabilized simply inducing oxygen vacancies, tailoring the growing conditions of the sample, without the inclusion of other dopants Lamperti2011 .
- (33) http://www.etsf.it; http://www.etsf.eu; Nature 450, 777 (2007)
- (34) M. Grüning, R. Shaltaf, and G.-M. Rignanese, Phys. Rev. B B 81, 035330 (2010)
- (35) A. Lamperti, L. Lamagna, G. Congedo, S. Spiga , J. of the Electr. Soc. 158(10), G221-G226 (2011)