1\Yearpublication2011\Yearsubmission2011 11institutetext: Department of Astronomy, University of Michigan, Ann Arbor, MI 48109-1042, USA 22institutetext: Leibniz-Institut für Astrophysik Potsdam (AIP), An der Sternwarte 16, D-14482 Potsdam, Germany
The absorption and emission spectrum of the magnetic Herbig Ae star HD 190073††thanks: Based on ESO Archival data, from ESO programme076.B-0055(A) and programme 082.D-0833(A)
Abstract
We determine abundances from the absorption spectrum of the magnetic Herbig Ae star HD 190073 (V1295 Aql). The observations are primarily from HARPS spectra obtained at a single epoch. We accept arguments that the presence of numerous emission lines does not vitiate a classical abundance analysis, though it likely reduces the achievable accuracy. Most abundances are closely solar, but several elements show departures of a factor of two to three, as an earlier study has also shown. We present quantitative measurements of more than 60 emission lines, peak intensities, equivalent widths, and FWHM’s. The latter range from over 200 (H, He D3) down to 10–20 (forbidden lines). Metallic emission lines have intermediate widths. We eschew modeling, and content ourselves with a presentation of the observations a successful model must explain. Low-excitation features such as the Na i D-lines and [O i] appear with He i D3, suggesting proximate regions with widely differing and as found in the solar chromosphere. The [O i] and [Ca ii] lines show sharp, violet-shifted features. Additionally, [Fe ii] lines appear to be weakly present in emission.
keywords:
stars: abundances – stars: individual (HD 190073) – stars: pre-main sequence1 Introduction
The intriguing spectrum of the magnetic Herbig Ae star HD 190073 (V1295 Aql) has attracted the attention of classical as well as modern spectroscopists (Merrill 1933; Swings & Struve 1940; Catala et al. 2007, henceforth CAT). Pogodin, Franco & Lopes (2005, henceforth P05) give a detailed description of the spectrum along with a historical resume of investigations from the 1930’s. We note that the nature of HD 190073 as a young, Herbig Ae star became widely recognized some three decades after Herbig’s (1960) seminal paper.
HD 190073 was included among the 24 young stars studied for abundances by Acke & Waelkens (2004, henceforth, AW). In this important paper, the authors made the bold assumption that abundances could be determined for stars of this nature using standard techniques-plane parallel, one dimensional models, in hydrostatic equilibrium. The models were used to obtain abundances from absorption lines with equivalent widths less than 150 mÅ. These assumptions might very well be questioned. Material is being accreted by these young stars, and the infall velocities are thought to be near free-fall, several hundred km s-1. Does this infall produce shocks and heating of the atmospheres that could invalidate models that neglect such complications?
AW nevertheless proceeded. Although they did not state this explicitly, the justification for their assumptions is empirical, and may be found in their results. Basically, these are the fact that their approach yields entirely reasonable stellar parameters and abundances, including agreement from lines of neutral and ionized elements. Stated simply, their assumptions led them to self-consistent results. We make these same assumptions in the present work, taking some comfort in the fact that self consistency is all one ever has in science.
While AW’s studies were both competent and thorough, better observational material is currently available, making it possible to use systematically weaker lines, and to study more elements. We have also made use of the wings of the Balmer lines, not used by AW.
The lower Balmer lines have central emissions. In the case of H, the emission dominates the feature. The Balmer lines and especially H, have been extensively studied (e.g. P05; Cuttela & Ringuelet 1990).
In the present paper we also study the weaker metallic emission lines, to provide information on the physical conditions where this emission occurs. This was discussed by CAT who were primarily concerned with the magnetic field of HD 190073. They also give a detailed qualitative description of the metallic emission lines (primarily Ti ii, Fe i/ii (cf. Sect. 6 and following).
Hubrig et al. (2006, 2009) reported a longitudinal magnetic field of 8430 Gauss, up to 10419 Gauss, while CAT found a longitudinal field of 7410 Gauss.
2 Observations
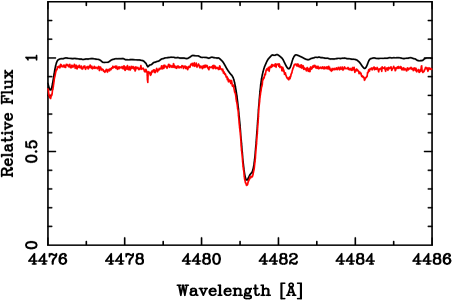
We downloaded 8 HARPS spectra from the ESO archive, all obtained on 11 November 2008 within 74 minutes of one another. These were averaged, binned to 0.02 Å and mildly Fourier filtered. The resulting spectrum has a signal-to-noise ratio of 350 or more. The resolution of HARPS spectra usually cited as over 100 000, is not significantly modified for our purposes on the averaged spectrum, as Fig. 1 illustrates.
UVES spectra, obtained on 18 September 2005 cover the region from 3044 to 10257 Å. They were used for special features (e.g. the [Ca ii] lines), but not for abundances.
3 Reduction

The averaged HARPS spectrum was measured for 1796 lines. The UVES spectrum was also measured for line identifications in the region 3054–3867 Å. We measured 760 absorption lines, which were often severely affected by emission.
Many absorption lines, especially weak ones, were not significantly affected by emission, and suitable for abundance determinations. Figure 2 shows a typical region with many relatively unperturbed absorptions. Preliminary, automated identifications were made, and wavelength coincidence statistics (WCS, Cowley & Hensberge 1981) were performed. A few spectra not investigated by AW were analyzed: He i, Na i, Al i, Si i, S i, S ii, Co i, Mn i, Mn ii, Ni i, Zn i, and Sr ii. We found no exotic elements, such as lanthanides, or unusual 4d or 5d elements.

Lines were chosen for equivalent width measurement with the help of the automated identification list, which lists plausible identifications within 0.03 Å of any measured feature. Blends were rejected. Usually, we avoided lines with equivalent widths greater than 20 mÅ but in order to compare our measurements with those of AW, we included a few stronger lines.
A comparison of measurements is given in Fig. 3. Generally, the measurements agree well with one another, and differences can usually be explained by judgments of where to draw the continuum when a line is partially in emission, or there is emission close by. Differences in the case of one of the solid circles is surely due to emission, as Ti ii 4398 Å falls between two strong emission lines. The other solid point is for O i 3947 Å. This is apparently a misidentification. Note that Fig. 3 is not logarithmic.
4 The model atmosphere and abundance methods
The methods used to obtain abundances from the equivalent widths, including model atmosphere construction are explained in some detail in two previous papers (Cowley et al. 2010a,b). Briefly, the from Atlas 9 (Kurucz 1993) as implemented by Sbordone et al. (2004) was used with Michigan software to product depth-dependent models. The effective temperature and gravity were selected from ionization and excitation equilibrium as well as fits to the wings of H–H.
We have adopted a somewhat lower temperature than used by AW, 8750 K, and . The former used 9250 K, and . We also used a lower microturbulence, 2 km s-1, compared to AW’s 3 km s-1, but this is not important for most of our weaker lines. Oscillator strengths were taken from the modern literature when possible, or from compilations by NIST (Ralchenko 2010, preferred) or VALD (Kupka et al. 1999). Default damping constants were used as in the studies cited, but they are unimportant for weak lines.
5 Abundances
| Ion | sd | Sun | AW | ||
|---|---|---|---|---|---|
| He i | –1.15 | 0.38 | 2 | –1.11 | |
| C i | –3.40 | 0.23 | 36 | –3.61 | –3.55 |
| N i* | –3.50 | 0.38 | 9 | –4.21 | –3.40 |
| O i | –3.29 | 0.10 | 12 | –3.35 | –3.38 |
| Na i | –5.25 | 0.24 | 5 | –5.80 | |
| Mg i | –4.29 | 0.23 | 3 | –4.44 | –4.52 |
| Mg ii | –4.54 | 0.16 | 8 | –4.44 | |
| Al i* | –6.07 | 1 | –5.59 | –6.01 | |
| Si i | –4.43 | 0.36 | 7 | –4.53 | –4.41 |
| Si ii | –4.61 | 0.13 | 10 | –4.53 | |
| S i | –4.62 | 0.06 | 3 | –4.92 | |
| S ii | –4.40 | 0.45 | 6 | ||
| Ca i | –5.78 | 0.11 | 2 | –5.70 | –5.41 |
| Ca ii | –5.63 | 0.19 | 6 | –5.70 | |
| Sc ii* | –9.16 | 0.13 | 10 | –8.89 | –9.00 |
| Ti ii | –7.18 | 0.19 | 32 | –7.09 | –7.07 |
| V ii | –8.07 | 0.11 | 14 | –8.11 | –7.93 |
| Cr i | –6.54 | 0.12 | 6 | –6.40 | –6.35 |
| Cr ii | –6.37 | 0.17 | 22 | –6.40 | |
| Mn i | –6.60 | 0.28 | 3 | –6.61 | |
| Mn ii | –6.53 | 0.24 | 13 | –6.61 | |
| Fe i | –4.54 | 0.15 | 182 | –4.54 | –4.53 |
| Fe ii | –4.54 | 0.21 | 145 | –4.54 | |
| Co i | –7.13 | 1 | –7.05 | ||
| Ni i | –5.86 | 0.15 | 18 | –5.82 | –5.73 |
| Ni ii | –5.68 | 0.23 | 5 | –5.82 | |
| Zn i | –7.48 | 0.08 | 2 | –7.48 | |
| Sr ii | –8.53 | 0.54 | 2 | –9.17 | |
| Y ii | –10.05 | 0.19 | 8 | –9.83 | –9.79 |
| Zr ii | –9.43 | 0.15 | 13 | –9.46 | –9.12 |
| Ba ii | –9.88 | 0.12 | 3 | –9.86 | –9.72 |
The AW abundances have been converted from differential values, using Anders & Grevesse (1989) abundances, which AG adopted. Our abundances (see Table 1) refer to the Asplund et al. (2009) scale. The case is not strong that any of these abundances differ significantly from the solar abundance. Nevertheless, we have highlighted in bold face some elements that deserve additional attention. Nitrogen, in particular, deserves attention, as it has been found in excess in the Herbig Ae star HD 101412 (Cowley et al. 2010a). Asterisks mark cases where AW and the present work agree on possibly significant departures from solar abundances. NLTE effects could also be responsible for some non-solar abundances (Kamp et al. 2001).
5.1 Neutral helium
The helium abundance is from 4026 (see Fig. 2) and 4713 Å. Both lines are weak, but in excellent agreement with one another. However 4471 Å was also found in absorption, and analyzed. The value of from this line was found to be 1.53, some 0.4 dex below the mean of the other two lines. We have chosen to disregard this value, as possibly weakened by partial emission. Should it be included in the average, we find (sd), still solar, within the errors. The D3 line (5876 Å) of He i is in emission, and included in Table 2. It was observed at numerous phases by P05, whose observations (see their Fig. 3) do not show the central reversal clearly seen in our Fig. 4. This feature was measured at 5875.60, virtually unshifted from the expected photospheric position 5875.64. Moreover, an LTE synthesis using Voigt profiles and an assumed solar abundance matches the observed absorption in shape and strength. Given the likelihood of NLTE, it is unclear how seriously to take this result. Nevertheless, the D3 absorption is consistent with photospheric absorption, and a solar abundance.
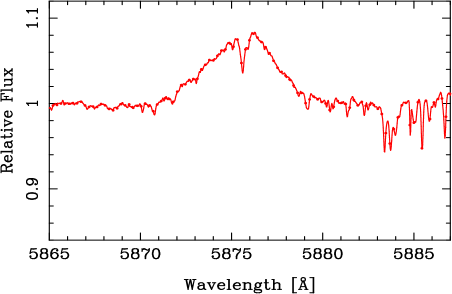
The D3 emission is remarkably similar in morphology to the metallic emissions (with unshifted absorptions), though it is much broader. It resembles the P05 illustrations at phases ‘a’ or ‘e’, with a maximum shifted somewhat to the red, and a longer violet tail.
6 The emission spectrum
A second focus of the current paper is the emission spectrum, in particular, permitted and forbidden metallic lines.

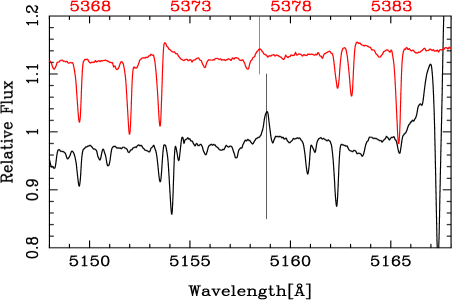
Previous studies (P05, CAT) provide detailed descriptions of numerous metallic emission lines, primarily of Fe i and ii, Ti ii, and Cr ii, as well as the Na D-lines, and have illustrations similar to the upper spectrum of Fig. 5. As the P05 work has a temporal dimension lacking in the present study, we briefly summarize their findings. The emissions show mild temporal variations both in strengths and widths. The profiles are somewhat asymmetric, with their peak intensities generally very slightly red shifted with respect to the photospheric absorption spectrum. The widths of the features are significantly larger than these shifts, and a considerable fraction of the emission is shifted to the blue.
The P05 observations are all in good agreement with the current findings, which we take to be a representative sample. Table 2 gives measurements of the peak intensities, equivalent widths, and FWHM for the strong relatively unblended emission lines as they appear on our averaged HARPS spectra. Multiplet numbers follow the spectrum designation. The intensities are in units of the continuum, and the equivalent widths are the areas of the emissions above the continuum, which is assumed to have unit intensity. The measurements are from segments fitted by eye to the emission lines, as illustrated in Fig. 6.
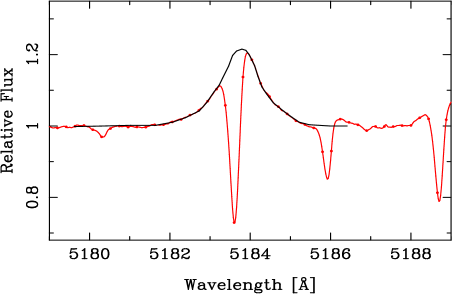
All lines in the table had central absorptions. In measuring the -values, an attempt was made to interpolate over this absorption, so the -value is a few per cent higher than the maximum of the emission. The accuracy of the measurements vary. Repeated measurements show consistency for FWHM are generally within 10 %. Underlying emission from other lines is the prime cause of the uncertainty.
| Ion/Mult. | [Å] | FWHM | FWHM | ||
|---|---|---|---|---|---|
| [Å] | [km s-1] | ||||
| 4045.81 | Fe I-43 | 1.11 | 0.130 | 1.02 | 75.6 |
| 4063.59 | Fe I-43 | 1.08 | 0.065 | 0.83 | 61.2 |
| 4071.74 | Fe I-43 | 1.11 | 0.113 | 0.82 | 60.4 |
| 4077.71 | Sr II-1 | 1.12 | 0.109 | 0.87 | 64.0 |
| 4143.87 | Fe I-43 | 1.05 | 0.032 | 0.61 | 44.1 |
| 4163.65 | Ti II-105 | 1.05 | 0.056 | 0.93 | 67.0 |
| 4173.46 | Fe I-27 | 1.12 | 0.095 | 0.80 | 57.5 |
| 4178.86 | Fe II-28 | 1.12 | 0.180 | 1.26 | 90.4 |
| 4215.52 | Sr II-1 | 1.06 | 0.472 | 0.81 | 57.6 |
| 4233.17 | Fe II-27 | 1.27 | 0.402 | 1.29 | 91.4 |
| 4246.82 | Sc II-7 | 1.07 | 0.062 | 0.82 | 57.9 |
| 4271.76 | Fe I-42 | 1.06 | 0.620 | 0.82 | 57.5 |
| 4290.22 | Ti II-42 | 1.12 | 0.112 | 0.87 | 60.8 |
| 4294.10 | Ti II-20 | 1.13 | 0.119 | 0.82 | 57.2 |
| 4300.05 | Ti II-41 | 1.23 | 0.308 | 1.06 | 73.9 |
| 4307.86 | Ti II-41 | 1.15 | 0.179 | 1.04 | 72.4 |
| 4351.77 | *Fe I-27 | 1.28 | 0.420 | 1.31 | 90.2 |
| 4383.55 | Fe I-41 | 1.14 | 0.119 | 0.83 | 56.8 |
| 4404.75 | Fe I-41 | 1.08 | 0.077 | 0.86 | 58.5 |
| 4443.79 | Ti II-19 | 1.24 | 0.311 | 1.06 | 71.5 |
| 4450.48 | Ti II-19 | 1.06 | 0.075 | 1.04 | 70.1 |
| 4468.51 | Ti II-31 | 1.25 | 0.281 | 0.89 | 59.7 |
| 4491.41 | *Fe II-37 | 1.12 | 0.155 | 1.15 | 76.8 |
| 4501.27 | Ti II-31 | 1.24 | 0.319 | 1.03 | 68.6 |
| 4508.29 | Fe II-38 | 1.17 | 0.198 | 1.04 | 69.2 |
| 4515.34 | Fe II-37 | 1.12 | 0.176 | 1.25 | 83.0 |
| 4533.97 | Ti II-50 | 1.19 | 0.261 | 1.18 | 78.0 |
| 4541.52 | Fe II-38 | 1.06 | 0.048 | 0.80 | 52.8 |
| 4558.65 | Cr II-44 | 1.14 | 0.186 | 1.17 | 76.9 |
| 4563.76 | Ti II-50 | 1.16 | 0.183 | 0.97 | 63.8 |
| 4571.97 | Ti II-82 | 1.26 | 0.332 | 1.07 | 70.2 |
| 4576.34 | Fe II-38 | 1.07 | 0.081 | 0.97 | 63.5 |
| 4588.20 | Cr II-44 | 1.09 | 0.105 | 0.96 | 62.7 |
| 4618.80 | Cr II-44 | 1.11 | 1.350 | 1.07 | 69.4 |
| 4629.34 | Fe II-37 | 1.17 | 0.211 | 1.00 | 64.8 |
| 4634.07 | Cr II-44 | 1.04 | 0.043 | 0.87 | 56.3 |
| 4731.45 | Fe II-43 | 1.05 | 0.058 | 0.93 | 58.9 |
| 4805.09 | Ti II92 | 1.04 | 0.332 | 0.86 | 53.7 |
| 4824.13 | Cr II-30 | 1.08 | 0.953 | 1.06 | 65.9 |
| 4923.92 | Fe II-42 | 1.65 | 1.340 | 1.70 | 103.5 |
| 4957.60 | Fe I-318 | 1.74 | 1.590 | 1.82 | 110.1 |
| 5169.03 | Fe II-42 | 1.77 | 1.890 | 2.14 | 124.1 |
| 5183.60 | Mg I-2 | 1.23 | 0.303 | 1.10 | 63.6 |
| 5197.58 | Fe II-49 | 1.23 | 0.231 | 1.23 | 70.9 |
| 5234.63 | Fe II49 | 1.22 | 0.437 | 1.22 | 69.9 |
| 5264.81 | Fe II-48 | 1.04 | 0.030 | 0.66 | 37.6 |
| 5284.11 | Fe II-41 | 1.08 | 0.117 | 1.20 | 68.1 |
| 5362.87 | Fe II-48 | 1.15 | 0.216 | 1.22 | 68.2 |
| 5534.85 | Fe II-55 | 1.10 | 0.140 | 1.10 | 59.6 |
| 5875.64 | He I-4 | 1.09 | 0.390 | 4.17 | 212.7 |
| 5889.95 | Na I-D2 | 1.76 | 1.380 | 1.38 | 70.2 |
| 5895.92 | Na I-D1 | 1.70 | 1.130 | 1.36 | 69.2 |
| 5991.38 | Fe II-55p | 1.03 | 0.043 | 1.38 | 69.1 |
| 6238.39 | Fe II-74 | 1.07 | 0.078 | 1.14 | 54.8 |
| 6247.56 | Fe II-74 | 1.13 | 0.217 | 1.46 | 70.1 |
| 6347.11 | Si II-2 | 1.11 | 0.325 | 2.50 | 118.1 |
| 6371.37 | Si II-2 | 1.08 | 0.228 | 2.86 | 134.6 |
| 6416.92 | Fe II-74 | 1.06 | 0.098 | 1.42 | 65.7 |
| 6432.68 | Fe II-40 | 1.05 | 0.073 | 1.16 | 54.1 |
| 6562.82 | H I | 6.82 | 32.20 | 5.34 | 243.9 |
| 5158.78 | [Fe II-19F] | 1.04 | 0.012 | 0.282 | 16.4 |
| 5577.35 | [O I-3F] | 1.01 | 0.004 | 0.44 | 23.4 |
| 6300.30 | [O I-1F] | 1.11 | 0.056 | 0.41 | 19.3 |
| 6363.78 | [O I-1F] | 1.04 | 0.019 | 0.42 | 19.7 |
| 7291.47 | [Ca II-1F] | 1.11 | 0.046 | 0.43 | 17.8 |
| 7323.89 | [Ca II-1F] | 1.10 | 0.033 | 0.28 | 11.3 |
6.1 Resumé: the permitted emissions
We summarize salient properties of the permitted emission lines:
-
–
The centers of gravity are shifted by ca. 5 to the red.
-
–
The profiles are somewhat asymmetric, with a longer violet than red tail.
-
–
The central absorption wavelengths are photospheric within the errors of measurement. That is, the radial velocities of the weaker photospheric absorptions agree with those of the central absorption components of the emission lines.
-
–
The emission lines are the intrinsically strongest lines. Weaker lines show weaker emission, until, for the weakest lines, the observed features are all in absorption.
CAT suggested the emissions arose in conditions similar to those of a photosphere. They suggested a heated region with densities and temperatures in the range of – cm-3 and –K.
Their value of 65 km s-1 as a typical FWHM for the emissions agrees well with our measurements (Table 2). The origin of this velocity, however, is not readily apparent. They speculate that these velocities are due to a supersonic turbulence. Such “turbulence” might arise from the roil of accreting material settling onto the photosphere.
6.2 Forbidden lines
6.2.1 The [O i] lines

Both 6300 and 6363 [O i] are present as well as the auroral transition 5577 Å. In addition to what we shall call the main features, all three lines show faint, sharp, “satellite” components shifted to the violet by ca. 25 . This structure is illustrated in Figs. 7 and 10. The main [O i] features are roughly one third the width of the typical permitted metallic-line features, but their peak intensities have comparably small red shifts of ca. 5 . It is plausible to assume the [O i] arises in a region further from the star, and therefore of lower density than the gas giving rise to the permitted metallic lines.
The satellite emissions may arise in a polar stream, if we assume the system is viewed pole on. The velocity, however, is not high. The satellite features of all three [O i] lines is ca. .
6.2.2 The [Ca ii-F1] doublet
Hamann (1994) has noted the presence of [Ca ii] in a number of young stars, including the Herbig Ae V380 Ori. We are not aware that the lines have been previously noted in HD 190073. They are also seen in supernovae (Kirshner & Kwan 1975) and extragalactic spectra. (Donahue & Voit 1993). Merrill (1943) reported [Ca II] lines in emission in the peculiar hydrogen-poor binary ß,Sgr (see also Greenstein & Merrill 1946).
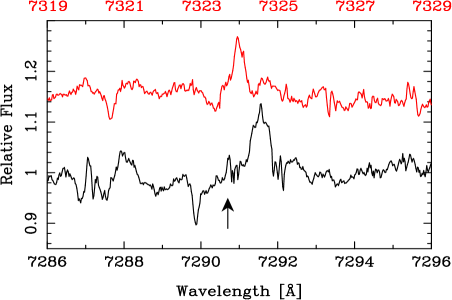
We find definite emissions at the positions of the forbidden – transitions. The air wavelengths, determined from the energy levels, are 7291.47 and 7323.89 Å. These features were identified on a the UVES spectrogram. The spectrum (Fig. 8) is too noisy or blended to show the presence of satellite features of 7324 Å, but it might be present for 7291 Å. Measurements of the main features are included in Table 2. The maxima are shifted to the red by 2 to 4 , in general agreement with the [O i] and metallic lines. The FWHM agree with those of other forbidden lines.
6.2.3 [Fe ii]
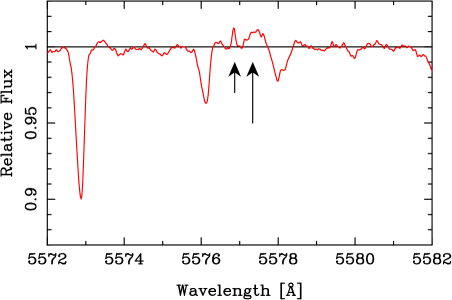
Several workers have discussed [Fe II] emission lines in Herbig Ae/Be stars (Finkenzeller 1985; Donati et al. 1997). We find a definite, sharp emission feature with a maximum measured at 5158.84 Å. This wavelength is close to that of [Fe ii-19F], 5158.78 Å. (Laboratory positions for [Fe ii] are from Fuhr & Wiese (2006) rather than the RMT). Another line from this multiplet is weakly present (Fig. 9). Both features are seen on the unaveraged HARPS spectra as well as UVES spectra taken some 3 years previously (see Sect. 2). Several other lines in Multiplet 19-F are arguably present (5261, 5296, 5072 Å), other lines are masked by blends or in a HARPS order gap. The line 5158 Å is entered in Table 2. It has a FWHM comparable to that of the other forbidden lines.
We found no other [Fe ii] features that could be said to be unambiguously present. The well-known [Fe ii] line 4244 Å is at best, marginally present.
6.2.4 Physical conditions from the forbidden lines
“Critical electron densities” are obtained from observed forbidden transitions by equating the Einstein spontaneous decay rate to the collisional deexcitation rate. Typical values are given by Draine (2011) for K. For the [O i] -level (the upper level of 6300 and 6363 Å), the critical is 1.6 cm-3. We calculate a similar critical density for the [Ca ii] lines with the help of rates calculated by Burgess et al. (1995), and a lifetime of the term given by NIST (Ralchenko et al. 2010).
We see no evidence of the [S ii-2F] pair at 6717 and 6731 Å, though they have been observed in Herbig Ae/Be stars (Corcoran & Ray 1997). For this pair, Draine gives critical densities of – cm-3. We conclude the forbidden lines we do see arise in a region where the electron density is between and cm-3.
When the nebular as well as auroral transitions of [O i] are available, the ratio may allow one to determine values of and compatible with the observation. The average of three measurements on 5577 gives Å, which with Å for 6300 yields a ratio of 13.3. If we assume the excited levels of O iarise from electron excitation, we may interpolate in the plot of Gorti et al. (2011) to find acceptable the values given in Table 3. With the electron density constraint given above, we find temperatures in the range 7500 to 10000 K for the volume where the forbidden lines are formed.
An alternate interpretation of [O i] emission in Herbig Ae/Be systems is discussed by Acke, van den Ancker & Dullemond (2005). In their model, the excited O ilevels arise primarily from the photodissociation of the OH molecule.
| 5000 | 8 |
|---|---|
| 7500 | 7 |
| 10000 | 6.5 |
| 12000 | 6.2 |
Acknowledgements.
We are grateful for the availability of the ESO archive. This research has made use of the SIMBAD data base, operated at CDS, Strasbourg, France. Our calculations have made extensive use of the VALD atomic data base (Kupka et al. 1999), as well as the facilities provided by NIST (Ralchenko et al. 2010). CRC thanks colleagues at Michigan for many helpful suggestions. Jesús Hernández suggested that we examine the forbidden lines.References
- [1] Acke, B., Waelkens, C.: 2004, A&A 427, 1017 (AW)
- [2] Acke, B., van den Ancker, M.E., Dullemond, C.P.: 2005, A&A 436, 209
- [3] Anders, E., Grevesse, N.: 1989, Geochim. Cosmochim. Acta 53, 197
- [4] Asplund, M., Grevesse, N., Sauval, A.J., Scott, P.: 2009, ARA&A 47, 481
- [5] Burgess, A., Chidichimo, M.C., Tully, J.A.: 1995, A&A 300, 627
- [6] Catala, C., Alecian, E., Donati, J.-F., et al.: 2007, A&A 462, 293 (CAT)
- [7] Corcoran, M., Ray, T.P.: 1997, A&A 321, 189
- [8] Cowley, C.R., Hensberge, H.: 1981, ApJ 244, 252
- [9] Cowley, C.R., Hubrig, S., González, J.F., Savanov, I.: 2010a, A&A 523, 65
- [10] Cowley, C.R., Hubrig, S., Palmeri, P., et al.: 2010b, MNRAS 405, 1271
- [11] Cuttela, M., Ringuelet, A.E.: 1990, MNRAS 246, 20
- [12] Donahue, M., Voit, G.M.: 1993, ApJ 414, L17
- [13] Donati, J.-F., Semel, M., Carter, B.D., Rees, D.E., Cameron, A.C.: 1997, MNRAS 291, 658
- [14] Drain, B.T.: 2011, Physics of the Interstellar and Intergalactic Medium, Princeton Univ. Press, Princeton, NJ
- [15] Finkenzeller, U.: 1985, A&A 151, 340
- [16] Fuhr, J. R. & Wiese, W. L.: 2006, J. Phys. Chem. Ref. Data, 35, 1669
- [17] Greenstein, J.L., Merrill, P.W.: 1946, ApJ 104, 177
- [18] Hamann, F.: 1994, ApJS 93, 485
- [19] Herbig, G.H.: 1960, ApJS 4, 337
- [20] Hubrig, S., Yudin, R.V., Schöller, M., Pogodin, M.A.: 2006, A&A 446, 1089
- [21] Hubrig, S., Stelzer, B., Schöller, M., et al.: 2009, A&A 502, 283
- [22] Kamp, I., Iliev, I.Kh., Paunzen, E., et al.: 2001, A&A 375, 899
- [23] Kirshner, R.P., Kwan, J.: 1975, ApJ 197, 415
- [24] Kupka, F., Piskunov, N.E., Ryabchikova, T.A., Stempels, H.C., Weiss, W.W.: 1999, A&AS 138, 119
- [25] Kurucz, R.L.: 1993, ATLAS9 Stellar Atmosphere Programs and 2 km/s grid, CD-Rom, No. 13, Smithsonian Ap. Obs., Cambridge/MA
- [26] Merrill, P.W.: 1933, ApJ 77, 51
- [27] Merrill, P.: 1943, PASP 55, 242
- [28] Pogodin, M.A., Franco, G.A.P., Lopes, D.F.: 2005, A&A 438, 239
- [29] Ralchenko, Yu., Kramida, A.E., Reader, J., NIST ASD team: 2010, NIST Atomic Spectra Database, version 3.1.5, http://physics.nist.gov/as of [2010, Feb 10], National Institute of Standards and Technology, Gaithersburg, MD
- [30] Sbordone, L., Bonifacio, P., Castelli, F., Kurucz, R.L.: 2004, Mem. Soc. Astron. Ital. Suppl. 5, 93
- [31] Swings, P., Struve, O.: 1940, ApJ 91, 546