Detection of Gamma-Ray Polarization in Prompt Emission of GRB 100826A
Abstract
We report the polarization measurement in prompt -ray emission of GRB 100826A with the Gamma-Ray Burst Polarimeter (GAP) aboard the small solar power sail demonstrator IKAROS. We detected the firm change of polarization angle (PA) during the prompt emission with 99.9 % () confidence level, and the average polarization degree () of % with 99.4 % () confidence level. Here the quoted errors are given at 1 confidence level for two parameters of interest. The systematic errors have been carefully included in this analysis, unlike any previous reports. Such a high can be obtained in several emission models of gamma-ray bursts (GRBs), including synchrotron and photospheric models. However, it is difficult to explain the observed significant change of PA within the framework of axisymmetric jet as considered in many theoretical works. The non-axisymmetric (e.g., patchy) structures of the magnetic fields and/or brightness inside the relativistic jet are therefore required within the observable angular scale of . Our observation strongly indicates that the polarization measurement is a powerful tool to constrain the GRB production mechanism, and more theoretical works are needed to discuss the data in more details.
Subject headings:
gamma-ray: bursts — gamma-ray: polarization — gamma-ray: emission mechanism1. Introduction
Gamma-ray bursts (GRBs) are the most energetic explosions in the universe, and the isotropic luminosity reaches for the brightest bursts. Since the discovery of X-ray afterglow of GRBs by BeppoSAX (Costa et al., 1997) and the identification of optical counterparts at cosmological distance, many observational facts and theoretical works have led us to understand the nature of GRBs. However, a crucial issue still remaining to answer is how to release such a huge energy as -ray photons. In spite of extensive discussions with the spectral and lightcurve information being collected, there are still several possible models of GRBs (Mészáros, 2006). The polarimetric observations provide us completely different information. A firm detection of linear polarization of -ray photons will further constrain the emission models (Lazzati, 2006; Toma et al., 2009).
The polarization measurement of GRBs has been performed in the late optical afterglows at first (Covino et al., 1999; Wijers et al., 1999; Rol et al., 2000; Gorosabel et al., 2004; Covino et al., 2004). All of these results show that the polarization degree () of a few % level. Mundel et al. (2007) set upper limit of % for the early optical afterglow. Detailed observations are performed for the optical afterglow of GRB 030329, and time variations of the polarization degree and angle (PA) were reported (Greiner et al., 2003). Recently, a polarization degree of % was reported for the early optical afterglow of GRB 090102, at hundreds of seconds since the burst trigger (Steele et al., 2009).
On the other hand, there are controversies on polarization detections in the prompt -ray emission of GRBs. The first report was the detection of a high linear polarization of % at a confidence level of by RHESSI from GRB 021206 (Coburn & Boggs, 2003), although independent groups could not confirm any polarization signals by reanalyzing the same data (Rutledge & Fox, 2004; Wigger et al., 2004). The second reports showed also high degree of polarization for GRB 041219A with % (Kalemci et al., 2007) and % (McGlynn et al., 2007) for the brightest pulse in the 100–350 keV energy band of INTEGRAL-SPI at confidence level for 2 parameters of interest ( and PA). Götz et al. (2009) also reported more significant detection for time resolved analyses111See Table 1 and Figure 3 of Götz et al. (2009). One should note that their definition of confidence level is given for one parameter of interest., and suggested possible variable polarization properties for the same GRB 041219A in the 200–800 keV energy band observed with INTEGRAL-IBIS. However, Götz et al. (2009) set a strict upper limit of % for the same brightest pulse showing high in the INTEGRAL-SPI data (Kalemci et al., 2007; McGlynn et al., 2007). (Götz et al. (2009) explained that the null net polarization degree results from the superposition of signals with different polarization angles. However, this interpretation cannot explain the positive detection by INTEGRAL-SPI simultaneously.) These inconsistent results between SPI and IBIS led to confusion again, and the existence of -ray polarization is still in debate. As the authors themselves pointed out in their reports, these results are with low statistics of level, and may be strongly affected by the instrumental systematics uncertainties (Kalemci et al., 2007; McGlynn et al., 2007; Götz et al., 2009). These controversies and conflicts indicate difficulties in detecting the -ray polarization.
In this Letter, we report the detection of -ray polarization and also the change of PA for extremely bright GRB 100826A using the newly developed GRB polarimeter. Our polarimeter is completely designed for the polarization measurement of prompt GRBs, and well calibrated during developing phase before launch. Especially, using a detector of proto-flight model, we experimentally and numerically understand the response for polarized -ray with low systematic uncertainties. In the following sections, we show the observation (section 2), data analysis (section 3) and discussion for the emission mechanism of the prompt GRBs (section 4).
2. Observations
IKAROS (Kawaguchi et al., 2008; Mori et al., 2010) (Interplanetary Kite-craft Accelerated by Radiation Of the Sun) is a small solar-power-sail demonstrator and was successfully launched on 21 May 2010. IKAROS has a large polyimide membrane of 20 m in diameter, and this translates the solar radiation pressure to the thrust of the spacecraft. Since the deployment of the sail on 9 June 2010, IKAROS started the solar-sailing toward Venus.
The Gamma-Ray Burst Polarimeter (GAP) (Yonetoku et al., 2011; Murakami et al., 2010; Yonetoku et al., 2006) aboard IKAROS is fully designed to measure a degree of linear polarization in the prompt emission of GRBs in the energy range of 70–300 keV. The detection principle is an anisotropy of Compton scattered photons. If the incident -rays are linearly polarized, the distribution of scattered photons is due to Klein-Nishina effect which approximately shows curves, where is the scattering angle. The GAP consists of a central plastic scatterer of 17 cm in diameter and 6 cm in thickness, and the surrounding 12 CsI(Tl) scintillators with 5 mm in thickness. The coincidence events within a gate time of between the signal from any CsI and that from the plastic are accepted for the polarization analysis. The GAP’s high axial symmetry in shape and the high gain uniformity are the keys for reliable measurement of polarizations, and to avoid a fake modulation due to background -rays. There are no external parts of spacecraft inside the GAP field of view. Moreover the detector cases (chassis), except for the detector top, are covered by thin lead sheets with 0.5 mm thickness. Therefore the effect of background -rays scattered by the spacecraft body are negligible.
The GAP detected GRB 100826A on 26 August 2010 at 22:57:20.8 (UT) on the way to Venus at about 0.21 AU apart from the Earth. The lightcurve of the prompt emission is shown in Figure 1. This burst was also detected by several satellites, and was localized by an interplanetary network (IPN) (Hurley et al., 2010). Combining the GAP data with the published IPN information, the direction of this burst is derived as , which corresponds to 20.0 degree off-axis from the center of the GAP field of view. An energy fluence of this burst is in 20 keV–10 MeV band by KONUS (Golenetskii et al., 2010), which is the top 1 % of the brightest events listed in BATSE catalog. The low- and high-energy photon indices are reported as and , respectively, and the peak energy as keV (Golenetskii et al., 2010). An optical afterglow of this GRB was not reported, so its redshift is unknown.
3. Data Analysis
We divided the entire data into two time intervals as labeled Interval-1 and -2 in a lightcurve of Figure 1. The total numbers of -ray photons after subtracting background are 32,924 and 19,007 photons for each interval, respectively. The first part of this burst shows a large flare lasting 47 seconds since the trigger, and a following 53 seconds consists of multiple spikes. Although the Interval-2 has several spikes, we combined all of them to keep photon statistics.
We used the background modulation curve obtained by the 36.7 hours integration just before and after the GRB trigger time. In this case, the averaged coincidence background rate is quite stable as , and its modulation curve can be described as constant with the standard deviation of 0.1 % level. After subtracting the background modulation, the total numbers of the coincidence -rays (polarization signals) are 4,821 and 2,733 for Interval-1 and -2, respectively.
3.1. Model Functions
When we perform the polarization analysis, we calculated the model function (or the detector response) for the polarized gamma-rays with Geant 4 Monte-Carlo simulator. A geometrical mass model of GAP was introduced in Yonetoku et al. (2011). We can set all the possible situations with different off-axis angles, azimuthal phase angles, spectral parameters, as well as polarization degrees and angles of incoming -rays. In this analysis, the free parameters are the polarization degrees and angles, since the other parameters are constrained as shown in section 2.
Simulating the interactions between the incoming gamma-rays and the geometrical mass model with Monte-Carlo method, we created the model functions of the modulation curves. Then we selected the coincidence events between the plastic and one CsI scintillator as the polarization signals. We simulated the model function with the step resolutions of 5 % for polarization degrees and 5 degrees for phase angles. We will fit the observed modulation curves with the model function by a least squares method in the following subsections.
3.2. Systematic Uncertainty
We should treat not only the statistical error but also the systematic uncertainties correctly. Here, the systematic uncertainties mean any unexplainable difference between the observed modulation curve and the simulated one.
Imperfect tunings of parameters in the ground and in-orbit calibrations for the incident radiation, especially from off-axis direction, cause more important systematic uncertainty. First, we performed some ground based experiments with non-polarized radio isotopes 57Co (122 keV) and 241Am (59.5 keV). They were set at the distance of 1.0 m from the center of proto-flight model with several incident angles from zero to 50 degrees with the step resolutions of 5 degrees. We measured experimental modulation curves for each setup. After that, on the assumption of non-polarized -rays with the monochromatic energy of 122 keV and/or 59.5 keV, we calculated the numerical modulation curve with Geant 4 simulator.
Then, of course, the both modulation curves show some discrepancy which cannot be explained within the statistical uncertainty, because of instrumental systematic uncertainties. We calculated the standard deviation of two modulations and derived the systematic errors to be % of the total coincidence -rays for the case of 20.0 degree incident angle. Although this value is not negligible, the statistical error (about % leves) still dominates the systematic one in this case. We included the systematic uncertainty into the total errors as for each bin of polarization data.
3.3. Fitting the Polarization Data
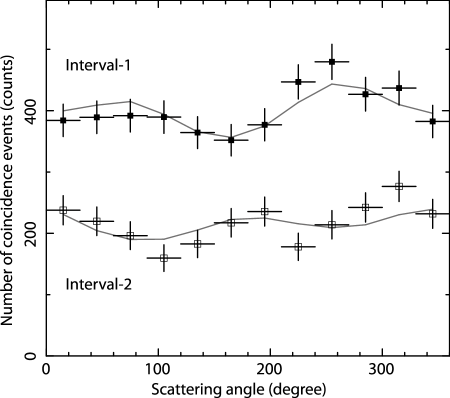
First of all, we performed the polarization analysis for the whole dataset of time interval of 0–100 seconds. Then we obtained an acceptable result with the model of non-polarized modulation curve, and set only upper limit of % ( confidence level). We consider the possibility that the polarization degree may be weak if the polarization angle changes during the entire burst duration, as suggested by Götz et al. (2009). Therefore, we performed time resolved polarization analyses for datasets of Interval-1 and -2. In Figure 2, we show the observed source modulation curves as a function of scattering angle for both time intervals after subtraction of background. The error bars shown in Figure 2 include not only the statistical uncertainty but also the 1.8 % of systematical one as estimated the above subsection.
At the first step, we investigated the polarization degrees, , and the polarization angle (), measured from north with anticlockwise direction, separately for Interval-1 and -2. Then, the response of GAP for irradiation from 20.0 degree off-axis is modeled by the Monte-Carlo method with Geant 4 simulator. The gray solid lines are the best-fit functions for Interval-1 and -2. The best values are % with degrees for Interval-1 and % with degrees for Interval-2, respectively. Hereafter the quoted errors are confidence for two parameters of interest. The significance of polarization detection is rather low of 95.4 % and 89.0 % for Interval-1 and -2, while the difference of polarization angles is significant with 99.9 % () level.
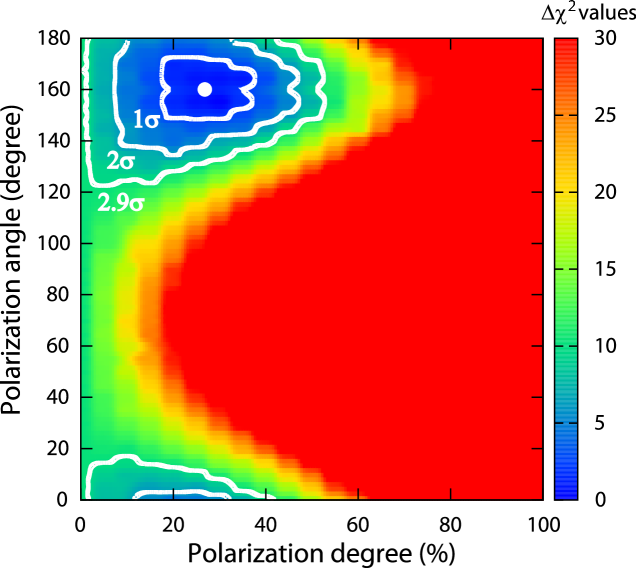
In the next step, we performed a combined fit for the two intervals, assuming that the polarization degree for Interval-2 is the same as that for Interval-1. This means that we treat as one free parameter to improve the statistics with the reduction of model parameters. Here the two polarization angles were still free parameters for both intervals, because the change of angle is apparent. The best-fit polarization degree is % with for 19 degrees of freedom. We show a map in the plane in Figure 3, where we represent . The significance of detection of polarization is 99.4 % confidence level.
Gamma-ray detectors aboard RHESSI and INTEGRAL have complex geometry, the polarization analysis may be highly affected by the instrumental systematics as the authors mentioned (Kalemci et al., 2007; McGlynn et al., 2007). In contrast to them, GAP is developed for the purpose of GRB polarimetry with the high axial symmetry in shape. The systematic uncertainty is quantitatively estimated and found to be as small as 1.8 % of the total polarization signals, as described above. Of course, GAP is well calibrated for polarized gamma-rays before launch (Yonetoku et al., 2011). Therefore, for the prompt emission of GRB, we conclude that this is probably the most convincing detection of polarization degree and angles so far.
4. Discussion
The emission mechanisms of GRBs which are being actively discussed with the spectral and lightcurve information collected so far includes synchrotron emission of electrons at the optically-thin regions of relativistic jets and quasi-thermal emission from the photospheres of jets (for a review, Mészáros, 2006). Our reliable polarimetric observations may help further constrain the emission mechanisms as well as the structure of the emission sites and the magnetic fields. The main results of our polarimetric observation of GRB 100826A are: (1) The polarization degree averaged over the burst duration is % in the energy range of keV below ; and (2) The PA significantly varies from Interval-1 to -2.
It has been theoretically shown that sizable net polarizations can be obtained both in the synchrotron and photospheric emission mechanisms. The synchrotron mechanism involves several different types of models with respect to magnetic field structure (for reviews, Lazzati, 2006; Toma et al., 2009); (a) synchrotron in globally ordered toroidal field (SO model; Granot, 2003; Lyutikov et al., 2003; Zhang & Yan, 2011), (b) in random fields on plasma skin depth scales (SR model; Granot, 2003; Nakar et al., 2003), and (c) in random fields on hydrodynamic scales (SH model; Inoue et al., 2011; Gruzinov & Waxman, 1999). In the SR model, the magnetic field directions are assumed to be random not isotropically but mainly in the plane perpendicular to the local expansion direction. In this case a high degree of polarization can be obtained only when the observer sees the jet slightly off-axis, i.e., , where is the angle between the line of sight and the jet axis, and and are the opening half angle and the bulk Lorentz factor of the jet, respectively. On the other hand, (d) in the photospheric emission model (Ph model), we also expect the strongly polarized radiation when the radiation energy is comparable to or smaller than the baryon kinetic energy at the photosphere (Beloborodov, 2011). Around the photosphere the photon distribution is highly anisotropic, which can lead to high levels of polarization through the last electron scatterings (see also Eichler & Levinson, 2003; Lazzati et al., 2004, for the other Comptonization models). We need the condition also in this model to have a high net polarization. The above four models can be consistent with our result (1).
Our result (2) provides us with very important information, which excludes the axisymmetric jets both in the synchrotron and photospheric emission models. If the emitting surface is symmetric around the jet axis as assumed by most of authors in the SO, SR, and Ph models, the direction of the net polarization in the high case is determined to be either parallel or perpendicular to the direction from the jet axis towards the line of sight. Therefore we conclude that non-axisymmetric structure of the brightness and/or the magnetic fields on the observable angular scale are required to have the substantial change of PA (see also Lazzati & Begelman, 2009).
A possible solution for the results (1) and (2) is the patchy emission in the SO, SR, or Ph model, or the patchy magnetic field structure, i.e., the SH model. For instance, the SH model produces the net polarization as , where is the number of independent patches with coherent magnetic field in the observable region. The polarization degree for can be consistent with the individual results for Intervals-1 and -2 within the confidence. The angle of the averaged polarization is statistically random, so that they can be consistent with our result (2). Similar arguments may be made in the patchy SO, SR, and Ph models. In the patchy SO model, the emission from each patch can have different PA easily when . In the patchy SR and Ph models, we no longer require the off-axis viewing of the jet, and the emission from each of off-axis viewed patches has high and different PA.
How can we further constrain the models with the analysis results of other bursts detected by GAP and the future polarimetry missions? We note that the statistical analysis results of the SO, SR and Ph models in Toma et al. (2009) are not applicable since they assume the axisymmetric jets. In the Ph model, the patch scales are constrained as . Then high local polarizations are obtained from patches with , although their brightness is much smaller than that from patches with because of the relativistic beaming effect. Thus it is not expected that all the bright bursts have a high net polarization in the patchy Ph model. The statistical studies of the GAP bursts might provide us some implications for further constraining the emission mechanism.
This polarimetric observation for GRB 100826A has been performed in the energy range below . In reality, the spectral indices of bursts below are not fully explained in the framework of synchrotron or photospheric mechanism. In the synchrotron mechanism, the radiative cooling of emitting electrons should not be so rapid to produce the spectrum sufficiently hard below , so that the emission region could be thick, unlike the thin shell emission assumed in many papers (e.g., Asano & Terasawa, 2009). The photospheric models include an idea that the emission below is superposition of many quasi-thermal components with different temperature and/or (e.g., Ryde et al., 2010; Toma et al., 2011). Clearly, more studies on the energy dependence of polarization (as well as the non-axisymmetric structure of the jet) in each model are needed to discuss the observational results quantitatively.
References
- Asano & Terasawa (2009) Asano, K., & Terasawa, T. 2009, ApJ, 705, 1714
- Beloborodov (2011) Beloborodov, A. 2011, ApJ, 737, 68
- Coburn & Boggs (2003) Coburn, W. & Boggs, S. E., 2003, Nature, 423, 415-417
- Costa et al. (1997) Costa, E. et al., 1997, Nature, 387, 783-785
- Covino et al. (1999) Covino, S. et al., 1999, Astron, Astrophys. 348, L1-L4
- Covino et al. (2004) Covino, S. et al., 2004, ASP, 312, 169
- Eichler & Levinson (2003) Eichler, D., & Levinson, A. 2003, ApJ, 596, L147
- Golenetskii et al. (2010) Golenetskii, S. et al., 2010, GCN Circular, 11158
- Gorosabel et al. (2004) Gorosabel, J. et al., 2004, Astron, Astrophys. 422, 113-119
- Götz et al. (2009) Götz, D. et al., 2009, Astrophys. J. 695, L208-L212
- Granot (2003) Granot, J. 2003, ApJ, 596, L17
- Greiner et al. (2003) Greiner, J. et al., 2003, Nature, 426, 157-159
- Gruzinov & Waxman (1999) Gruzinov, A., & Waxman, E. 1999, ApJ, 511, 852
- Hurley et al. (2010) Hurley, K. et al., 2010, GCN Circular, 11156
- Inoue et al. (2011) Inoue, T., Asano, K., & Ioka, K. 2011, ApJ, 734, 77
- Kalemci et al. (2007) Kalemci, E. et al., 2007, Astrophys. J. Supplement, 169, 75-82
- Kawaguchi et al. (2008) Kawaguchi, J. et al., 2008, Proceedings of the 59th International Astronautical Congress, IAC-08-A3.6.15
- Lazzati et al. (2004) Lazzati, D. et al., 2004, MNRAS, 347, L1
- Lazzati (2006) Lazzati, D. et al., 2006, New Journal of Physics, 8, 131
- Lazzati & Begelman (2009) Lazzati, D., & Begelman, M. C., 2009, ApJ, 700, L141
- Lyutikov et al. (2003) Lyutikov, M., Pariev, V. I., & Blandford, R. 2003, ApJ, 597, 998
- McGlynn et al. (2007) McGlynn, S. et al., 2007, A&A, 466, 895-904
- Mészáros (2006) Mészáros, P. 2006, Rep. Prog. Phys., 69, 2259
- Mori et al. (2010) Mori, O. et al., Proceedings of the 2nd International Symposium on Solar Sailing (2010)
- Mundel et al. (2007) Mundel, C. G. et al., 2007, Science, 315, 1822-1824
- Murakami et al. (2010) Murakami, T. et al., Proceedings of Deciphering the ancient universe with gamma-ray burst, AIP Conference Proceedings, 1279, 227-230 (2010)
- Nakar et al. (2003) Nakar, E., Piran T., & Waxman, E. 2003, JCAP, 10, 5
- Piran (1999) Piran, T. 1999, Physics Reports, 314, 575-667
- Rol et al. (2000) Rol, E. et al., 2000, Astrophys. J. 544, 707-711
- Rutledge & Fox (2004) Rutledge, R. E. & Fox, D. B., 2004, MNRAS, 350, 1288-1300
- Ryde et al. (2010) Ryde, F., et al. 2010, ApJ, 709, L172
- Steele et al. (2009) Steele, I. A. et al., 2009, Nature, 462, 767-769
- Toma et al. (2009) Toma, K., Sakamoto, T., Zhang, B., et al. 2009, ApJ, 698, 1042
- Toma et al. (2011) Toma, K., Wu, X.-F., & Mészáros, P. 2011, MNRAS, 415, 1663
- Wigger et al. (2004) Wigger, C. et al., 2004, ApJ, 613, 1088-1100
- Wijers et al. (1999) Wijers, R. A. M. et al., 1999, ApJ, 523, L33-L36
- Yonetoku et al. (2006) Yonetoku, D. et al., 2006, SPIE, 6266, 62662C-1 - 62662C-9
- Yonetoku et al. (2011) Yonetoku, D. et al., 2011, PASJ, 63, 3
- Zhang & Yan (2011) Zhang, B., & Yan, H. 2011, ApJ, 720, 90