∎
22email: y.unruh@imperial.ac.uk 33institutetext: W. Ball 44institutetext: Astrophysics Group, Blackett Laboratory, Imperial College London, SW7 2AZ, UK
44email: william.ball08@imperial.ac.uk 55institutetext: N. A. Krivova 66institutetext: Max-Planck Institut für Sonnensystemforschung, D-37191 Katlenburg-Lindau, Germany
66email: natalie@mps.mpg.de
Solar irradiance models and measurements: a comparison in the 220 nm to 240 nm wavelength band
Abstract
Solar irradiance models that assume solar irradiance variations to be due to changes in the solar surface magnetic flux have been successfully used to reconstruct total solar irradiance on rotational as well as cyclical and secular time scales. Modelling spectral solar irradiance is not yet as advanced, and also suffers from a lack of comparison data, in particular on solar-cycle time scales. Here we compare solar irradiance in the 220 nm to 240 nm band as modelled with SATIRE-S and measured by different instruments on the UARS and SORCE satellites.
We find good agreement between the model and measurements on rotational time scales. The long-term trends, however, show significant differences. Both SORCE instruments, in particular, show a much steeper gradient over the decaying part of cycle 23 than the modelled irradiance or that measured by UARS/SUSIM.
Keywords:
Sun: activity Sun: irradiance1 Introduction
The solar irradiance, i.e., the solar energy flux received at the top of the Earth’s atmosphere, changes on a wide range of time scales. Changes in total solar irradiance (TSI) have been monitored since 1978 and a number of composites combining data from different satellites are available (see, e.g., Domingo et al (2009) for a discussion of TSI composites). Detailed modelling of the TSI has shown that solar irradiance changes on rotational to cyclical time scales can be well modelled as being due to changes in the solar surface magnetic flux alone (e.g. Preminger et al, 2002; Wenzler et al, 2006; Krivova et al, 2003; Ball et al, 2011).
Quantifying changes in solar spectral irradiance (SSI) is a more arduous task. Up until the launches of the SCIAMACHY imaging spectrometer onboard ENVISAT and the SOlar Radiation and Climate Experiment (SORCE) satellite in 2002 and 2003, respectively, most of the spectral data were restricted to wavelengths below 400 nm, and more reliable data were only available for wavelengths below 300 nm (Woods et al, 1996). A compilation of UV irradiance measurements up to 2005, though not yet including SORCE data, was presented by DeLand and Cebula (2008). This compilation includes the authors’ best estimate of which of the instruments yield the most reliable measurements at different times over the last three solar cycles, though no wavelength-by-wavelength cross-calibrations are applied at this stage.
The SOLar STellar Irradiance Comparison Experiment (SOLSTICE) (McClintock et al, 2005a, b) and Spectral Irradiance Monitor (SIM) (Harder et al, 2005a, b) onboard SORCE measure spectral solar irradiance between 115 nm and 320 nm and between 200 nm and 2.4 m, respectively. Results from the decaying phase of cycle 23 have shown rather unexpected long-term behaviour, in particular a much steeper UV decline than that measured in cycle 22 by the Solar Ultraviolet Spectral Irradiance Monitor (SUSIM) and by SOLSTICE onboard UARS (Upper Atmosphere Research Satellite). In addition, SORCE/SIM also suggested an anticorrelation of SSI between wavelengths of nm to nm with TSI (Harder et al, 2009).
Model-based reconstructions of the solar UV irradiance have been presented by a number of authors, including Krivova et al (2009, 2006) and Morrill et al (2011). Here we present reconstructions of the UV irradiance over the last solar cycle for wavelengths between 220 nm and 240 nm using the SATIRE-S (Spectral And Total Irradiance REconstructions - Satellite era) model. We compare the UV reconstructions with data from UARS/SUSIM and UARS/SOLSTICE, as well as to data from SIM and SOLSTICE onboard SORCE. A more in-depth analysis covering a wider spectral range as well as solar cycles 21 and 22 will be presented in Ball et al (in prep).
2 SATIRE-S
The reconstructions presented here are obtained with SATIRE-S (Krivova et al, 2011) and assume that all changes in solar irradiance are due to changes in the solar surface magnetic flux. The emergent magnetic flux forms dark and bright surface features that can be identified from magnetograms and continuum images. Having identified the magnetic features and knowing their contrast with respect to the quiet Sun (see Unruh et al, 1999), the irradiance change can be calculated by summing the different contributions over the solar surface.
SATIRE-S has one free parameter, ; it effectively determines the field strength above which the facular contrast saturates and depends on the resolution and image characteristics of the magnetograms and continuum images (see Krivova et al, 2011 for more detail).
3 Solar UV irradiance from 1999 to 2010
The reconstructions presented here are based on magnetograms and continuum images from the Michelson Doppler Imager (MDI) onboard the Solar and Heliospheric Observatory (SoHO). We consider the period between 1999 and 2009 after the SoHO ‘vacation’. During this time we have previously found excellent agreement between the PMOD TSI composite (Fröhlich, 2006, 2000) and the SATIRE-S reconstructions. The free parameter, , was fixed so that the regression slope of the TSI values calculated with SATIRE-S and those of the PMOD composite was unity for times between February 1999 and February 2010. The resulting value for is 424 G and the correlation coefficient over this period is (). Note that this value of can not be compared directly to earlier values (e.g. Krivova et al, 2003) on account of the changes in the magnetogram calibrations introduced for the MDI level 1.8 data.
The UV irradiances integrated between 220 nm and 240 nm are shown in Fig. 1 for times between 1999 and 2010. This spectral region has been selected as it had previously been found that the SATIRE-S calculations reproduce the UARS/SUSIM measurements well, despite SATIRE’s reliance on LTE which tends to be a poor approximation in this wavelength region. For other UV wavelengths, irradiance changes can be derived from the integrated 220 nm to 240 nm irradiance by linear regression (Krivova et al, 2006).
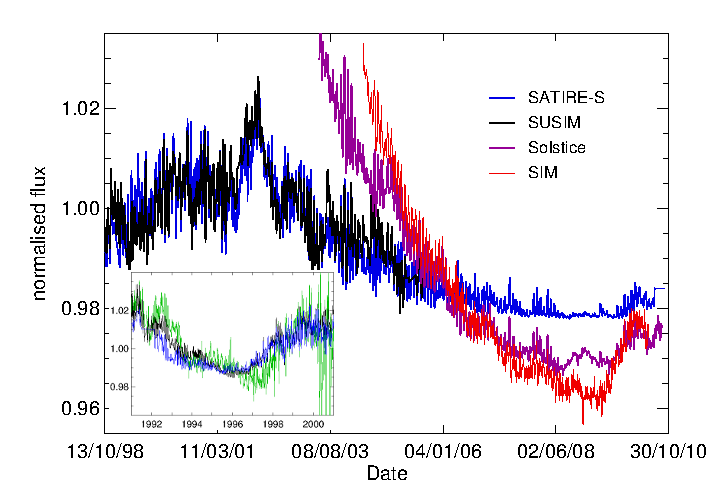
The SATIRE-S reconstructions are shown in blue, the UARS/SUSIM measurements are plotted in black. The error in the absolute measurements is significantly larger than the error in the relative changes of the irradiance (see, e.g., Woods et al, 1996). The SUSIM and SATIRE-S data have thus been normalised so that their mean values after the SoHO vacation agree. The SORCE/SIM and SORCE/SOLSTICE data are overplotted in red and purple, respectively. They have been normalised using the mean values during their overlap period (May 2005 to May 2010); they have also been shifted by 0.02 for ease of comparison with SUSIM and SATIRE. The inset shows a comparison between UARS/SOLSTICE (green), UARS/SUSIM (black) and SATIRE-S (blue, based on Kitt Peak images pre-1999) during the lifetime of the UARS/SOLSTICE instrument. As the data quality of UARS/SOLSTICE deteriorated from about 2001 onwards (as, e.g., indicated by the increase in spurious downward spikes), the irradiances shown on the inset have been normalised to their pre-2000 mean.
The UV irradiance measured with both SORCE instruments shows a much steeper long-term trend than that found with SUSIM, either during cycle 23 or cycle 22 (see Krivova et al (2009) for an in-depth discussion of UV irradiance measurements during cycle 22).
4 Discussion
4.1 Rotational time scales
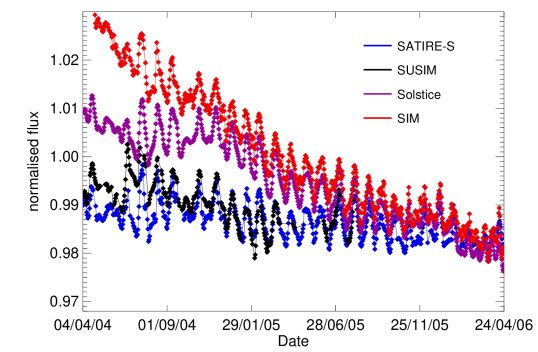
The modelled and the measured UV irradiances show excellent agreement on rotational time scales. This is illustrated in more detail in Fig. 2, where the irradiances are plotted over the shorter timespan of approximately two years. The irradiance changes by approximately 1% as the active regions rotate in and out of view and we find that the variability amplitude is well matched between the different instruments and the model. Indeed, on rotational time scales, the scatter between the irradiances measured with the different instruments is comparable to the scatter between the modelled and observed irradiance, as illustrated by the results of a regression analysis. The slopes and correlation coefficients are listed in Tab. 1. Rows 2 to 7 are for detrended data sets where the cyclical variability has been removed and only rotational variability retained. The number of data points for which the correlation was calculated is also listed in Tab. 1; note that the UARS/SUSIM measurements cover a much longer timespan compared to SORCE/SIM. UARS/SOLSTICE data have not been included in the analysis here as they do not overlap with SORCE/SIM. We note, however, that the UARS/SUSIM and UARS/SOLSTICE rotational variability agree well with each other and also with SATIRE-S.
| [1] | [2] | [3] | [4] | [5] | [6] | [7] |
|---|---|---|---|---|---|---|
| row | data set 1 | data set 2 | () | slope | points | Time span |
| 1 | SATIRE-S | SUSIM | 0.92 (0.85) | 1.03 | 1641 | 1999/02/19 – 2005/07/31 |
| 2 | SATIRE-S | SUSIM | 0.88 (0.77) | 1.04 | 1641 | 1999/02/19 – 2005/07/31 |
| 3 | SATIRE-S | SIM | 0.76 (0.58) | 1.14 | 1665 | 2004/04/22 – 2009/10/30 |
| 4 | SATIRE-S | SOLSTICE | 0.91 (0.83) | 0.97 | 523 | 2003/05/14 – 2005/07/31 |
| 5 | SUSIM | SOLSTICE | 0.75 (0.56) | 0.89 | 523 | 2003/05/14 – 2005/07/31 |
| 6 | SUSIM | SIM | 0.72 (0.52) | 0.96 | 293 | 2004/04/22 – 2005/07/31 |
| 7 | SIM | SOLSTICE | 0.80 (0.64) | 0.91 | 1665 | 2004/04/22 – 2009/10/30 |
On rotational timescales, we find that the best agreement is between SATIRE-S and SORCE/SOLSTICE; the model is able to explain at least 83% of the rotational variability. This suggests that, on these timescales and for the instruments considered here, SORCE/SOLSTICE has the lowest instrumental noise. The higher instrumental noise of SIM is not too surprising as the nm wavelength band is relatively near the blue edge of the SIM instrument (see also the discussion in Unruh et al, 2008). Considering the instrument designs and capabilities, SORCE/SOLSTICE should yield better results for wavelengths below 240 nm, while SORCE/SIM is the instrument of choice above approximately 290 nm (J Harder, priv comm). Probably due to the loss of one of the reaction wheels in 2008, the noise level of SORCE/SIM increased slightly towards the end of the mission (see the period around cycle minimum in Fig. 1). This is borne out by the correlation analysis. Restricting the analysis to times between April 2004 and January 2008 results in higher correlation coefficients ( vs for the comparison with SIM and vs for the comparisons with and SOLSTICE). At the same time, the correlation slopes improve to values nearer unity; in the case of SATIRE-S vs SIM (see row 3) the slope decreases from 1.14 to 1.05, while it increases from 0.91 to 0.97 for the SIM to SOLSTICE comparison (see row 7).
The rather low correlation coefficient for UARS/SUSIM with either SORCE/SIM or SORCE/SOLSTICE is mainly due to the short time-span considered and due to what appears to be increased noise in SUSIM after mid 2003. The correlation cofficient between the detrended SATIRE-S and SUSIM time series for the time span after 2003 falls to compared to the more typical for the period starting in 1999.
4.2 Cycle variability
The most striking feature in Fig. 1 is the much more pronounced long-term trend observed by the two SORCE instruments compared to UARS/SUSIM and also to SATIRE-S. As already pointed out by Krivova et al (2009, 2006) for the descending phase of cycle 22 and the rising phase of cycle 23, we find that the SATIRE-S reconstructions are in excellent agreement with the SUSIM measurements in the 220 nm to 240 nm range. But while SUSIM and SATIRE-S suggest a difference of the order of 4% between cycle minimum and maximum in cycle 22, SORCE/SIM and SOLSTICE show a significantly larger change during part of the declining phase of cycle 23.
The decline observed with SORCE/SOLSTICE is of the order of 6% between May 2003 and the cycle 23/24 minimum. A similar decline is seen for SORCE/SIM between May 2004 and the cycle minimum. We note that in terms of the TSI change, the period between May 2003 (and indeed also May 2004) and the cycle minimum only corresponds to approximately half of the total cycle change in TSI. The % decline in the 220 to 240 nm integrated irradiance would thus be a lower limit and suggest an overall cycle change of the order of 12%. This is compared to the % change in UARS/SUSIM and SATIRE-S (recall that the typical rotational variability measured by all instruments out of minimum is of the order of 1 to 2% in this wavelength range).
The relative accuracy of both UARS instruments over a timescale of a few years has conservatively been estimated to be of the order of 1% (Woods et al, 1996). In the 220 nm to 240 nm region, the SORCE/SOLSTICE accuracy and long-term stability is considered to be better than that of SIM (Harder et al, 2010). Snow et al (2005) estimate the SORCE/SOLSTICE stability to be of the order of 1% per year currently, though it is expected that, pending outstanding corrections, SORCE/SOLSTICE will achieve a long-term stability of 0.5% per year by the end of the mission (Snow, priv comm).
We thus find that the cycle variability observed with UARS/SUSIM, with UARS/SOLSTICE, and modelled with SATIRE-S agrees within the estimated uncertainty. Taking the 1%-per-year uncertainty at face value, the observed trends for SORCE lie just outside the long-term instrumental uncertainties and it is not clear how to reconcile the UARS and SORCE measurements in this wavelength region. Note that, while considerably steeper overall, the trends observed with the two SORCE instruments do not always agree well. The slope seen in SORCE/SIM during the first 9 months is substantially steeper than that recorded by SORCE/SOLSTICE. Both instruments show good long and short-term agreement over a timespan of approximately two years (February 2005 to January 2007) where they both record a decline of approximately 1% per year. Their subsequent trends, however, disagree at the estimated 1% stability level: SORCE/SIM shows a deeper minimum combined with a sharper decline and rise in and out of the minimum.
5 Summary
The typical rotational variability in the 220 nm to 240 nm band is of the order of 1%. On rotational timescales, we find excellent agreement between the irradiances recorded by UARS/SUSIM, SORCE/SOLSTICE and SORCE/SIM, and those reconstructed from SoHO/MDI images using the SATIRE-S model.
On yearly time scales and longer, the observed trends with the newer SORCE instruments, SORCE/SOLSTICE and SORCE/SIM, are much more pronounced than those measured with UARS/SUSIM or modelled with SATIRE-S. It is currently unclear how these trends can be reconciled and whether the differences are purely instrumental, or due to a change in the Sun’s behaviour. One might argue that, after 14 years in space, UARS/SUSIM suffered from instrumental degradation during the declining phase of cycle 23. This seems unlikely, however, when considering the long-term trends measured during the second half of cycle 22 that are of a similar magnitude as those in cycle 23 and, furthermore, agree with those modelled by SATIRE-S. While it is simplistic to assume that UV irradiance trends will scale linearly with TSI, the approximately fourfold larger drop in the nm irradiance during cycle 23 when the change in the TSI was comparable to that in cycle 22 remains intriguing.
Acknowledgements.
The authors would like to thank ISSI for the hospitality and lively meeting. The authors would also like to thank Jerry Harder for providing the SORCE/SIM data, as well as Linton Floyd for helpful discussions and information on SUSIM data and Marty Snow for information on the SORCE/SOLSTICE data. This work was supported by the Deutsche Forschungsgemeinschaft, DFG project number SO 711/1-3 and by the NERC SolCli consortium grant; we are indebted to Sami Solanki and Thomas Wenzler for many useful discussions.References
- Ball et al (2011) Ball WT, Unruh YC, Krivova NA, Solanki S, Harder JW (2011) Solar irradiance variability: a six-year comparison between SORCE observations and the SATIRE model. Astron. Astrophys.530:A71+, 1104.0885
- DeLand and Cebula (2008) DeLand MT, Cebula RP (2008) Creation of a composite solar ultraviolet irradiance data set. Journal of Geophysical Research (Space Physics) 113:A11,103
- Domingo et al (2009) Domingo V, Ermolli I, Fox P, Fröhlich C, Haberreiter M, Krivova N, Kopp G, Schmutz W, Solanki SK, Spruit HC, Unruh Y, Vögler A (2009) Solar Surface Magnetism and Irradiance on Time Scales from Days to the 11-Year Cycle. Space Sci. Rev.145:337–380
- Fröhlich (2000) Fröhlich C (2000) Observations of Irradiance Variations. Space Sci. Rev.94:15–24
- Fröhlich (2006) Fröhlich C (2006) Solar Irradiance Variability Since 1978. Revision of the PMOD Composite during Solar Cycle 21. Space Sci. Rev.125:53–65, DOI 10.1007/s11214-006-9046-5
- Harder et al (2005a) Harder J, Lawrence G, Fontenla J, Rottman G, Woods T (2005a) The Spectral Irradiance Monitor: Scientific Requirements, Instrument Design, and Operation Modes. Sol. Phys.230:141–167
- Harder et al (2005b) Harder JW, Fontenla J, Lawrence G, Woods T, Rottman G (2005b) The Spectral Irradiance Monitor: Measurement Equations and Calibration. Sol. Phys.230:169–204
- Harder et al (2009) Harder JW, Fontenla JM, Pilewskie P, Richard EC, Woods TN (2009) Trends in solar spectral irradiance variability in the visible and infrared. Geophys. Res. Lett.36:L07,801
- Harder et al (2010) Harder JW, Thuillier G, Richard EC, Brown SW, Lykke KR, Snow M, McClintock WE, Fontenla JM, Woods TN, Pilewskie P (2010) The SORCE SIM Solar Spectrum: Comparison with Recent Observations. Sol. Phys.263:3–24, DOI 10.1007/s11207-010-9555-y
- Krivova et al (2003) Krivova NA, Solanki SK, Fligge M, Unruh YC (2003) Reconstruction of solar irradiance variations in cycle 23: Is solar surface magnetism the cause? Astron. Astrophys.399:L1–L4
- Krivova et al (2006) Krivova NA, Solanki SK, Floyd L (2006) Reconstruction of solar UV irradiance in cycle 23. Astron. Astrophys.452:631–639
- Krivova et al (2009) Krivova NA, Solanki SK, Wenzler T, Podlipnik B (2009) Reconstruction of solar UV irradiance since 1974. Journal of Geophysical Research (Atmospheres) 114:D00I04, 0907.1500
- Krivova et al (2011) Krivova NA, Solanki SK, Unruh YC (2011) Towards a long-term record of solar total and spectral irradiance. Journal of Atmospheric and Solar-Terrestrial Physics 73:223–234
- McClintock et al (2005a) McClintock WE, Rottman GJ, Woods TN (2005a) Solar-Stellar Irradiance Comparison Experiment II (Solstice II): Instrument Concept and Design. Sol. Phys.230:225–258
- McClintock et al (2005b) McClintock WE, Snow M, Woods TN (2005b) Solar-Stellar Irradiance Comparison Experiment II (SOLSTICE II): Pre-Launch and On-Orbit Calibrations. Sol. Phys.230:259–294
- Morrill et al (2011) Morrill JS, Floyd L, McMullin D (2011) The Solar Ultraviolet Spectrum Estimated Using the Mg ii Index and Ca ii K Disk Activity. Sol. Phys.269:253–267
- Preminger et al (2002) Preminger DG, Walton SR, Chapman GA (2002) Photometric quantities for solar irradiance modeling. Journal of Geophysical Research (Space Physics) 107 (A11):1354, DOI:10.1029/2001JA009,169
- Snow et al (2005) Snow M, McClintock WE, Rottman G, Woods TN (2005) Solar Stellar Irradiance Comparison Experiment II (Solstice II): Examination of the Solar Stellar Comparison Technique. Sol. Phys.230:295–324, DOI 10.1007/s11207-005-8763-3
- Unruh et al (1999) Unruh YC, Solanki SK, Fligge M (1999) The spectral dependence of facular contrast and solar irradiance variations. Astron. Astrophys.345:635–642
- Unruh et al (2008) Unruh YC, Krivova NA, Solanki SK, Harder JW, Kopp G (2008) Spectral irradiance variations: comparison between observations and the SATIRE model on solar rotation time scales. Astron. Astrophys.486:311–323, DOI 10.1051/0004-6361:20078421
- Wenzler et al (2006) Wenzler T, Solanki SK, Krivova NA, Fröhlich C (2006) Reconstruction of solar irradiance variations in cycles 21–23 based on surface magnetic fields. Astron. Astrophys.460:583–595
- Woods et al (1996) Woods TN, Prinz DK, Rottman GJ, et al (1996) Validation of the UARS solar ultraviolet irradiances: Comparison with the ATLAS 1 and 2 measurements. Journal of Geophysical Research (Space Physics) 101 (D6):9541–9570