Terahertz and infrared spectroscopic evidence of phonon-paramagnon
coupling
in hexagonal piezomagnetic YMnO3
Abstract
Terahertz and far-infrared electric and magnetic responses of hexagonal piezomagnetic YMnO3 single crystals are investigated. Antiferromagnetic resonance is observed in the spectra of magnetic permeability [H oriented within the hexagonal plane] below the Néel temperature . This excitation softens from 41 to 32 on heating and finally disappears above . An additional weak and heavily-damped excitation is seen in the spectra of complex dielectric permittivity within the same frequency range. This excitation contributes to the dielectric spectra in both antiferromagnetic and paramagnetic phases. Its oscillator strength significantly increases on heating towards room temperature thus providing evidence of piezomagnetic or higher-order couplings to polar phonons. Other heavily-damped dielectric excitations are detected near 100 in the paramagnetic phase in both and spectra and they exhibit similar temperature behavior. These excitations appearing in the frequency range of magnon branches well below polar phonons could remind electromagnons; however, their temperature dependence is quite different. We have used density functional theory for calculating phonon dispersion branches in the whole Brillouin zone. A detailed analysis of these results and of previously published magnon dispersion branches brought us to the conclusion that the observed absorption bands stem from phonon-phonon and phonon-paramagnon differential absorption processes. The latter is enabled by a strong short-range in-plane spin correlations in the paramagnetic phase.
I Introduction
Spin waves (magnons) in magnetically ordered materials can be excited by the magnetic component H of the electromagnetic radiation, giving rise to a resonant dispersion of magnetic permeability in the microwave or terahertz (THz) frequency region. Recently, new coupled spin–lattice excitations named electromagnons have been discovered in multiferroics, where the magnetic order coexists with the ferroelectric one.pimenov06 ; sushkov07 Electromagnons are excited by the electric component E of the electromagnetic radiation, therefore they can be detected in the THz dielectric permittivity spectra. Though they were theoretically predicted in 1970,chupis70 the first experimental confirmation appeared as late as in 2006.pimenov06 These excitations were mainly investigated in the rare earth (R) orthorhombic manganites RMnO3 and RMn2O5 (for reviews see e.g. Refs. pimenov08, ; kida09, ; shuvaev11, ), and in hexaferrites.kida09b
Multiferroics can be roughly divided into two groups.khomskii06 ; khomskii09 ; lotter09 In the so-called type-I multiferroics the ferroelectric (FE) order takes place both above and below the magnetic ordering temperature and the spontaneous polarization is large. However, the coupling between magnetic and electric order parameters is weak.
A general feature of type-II multiferroic materials is that the ferroelectric phase is induced by magnetic ordering characterized by a particular type of incommensurate spiral magnetic structure. In this case the magnetically-induced polarization is by several orders of magnitude smaller than in type-I multiferroics. However the coupling between electric and magnetic subsystems is large and giant magnetoelectric effects are observed. The magnon dispersion branch in the incommensurate phase exhibits a minimum at the wave vector qm corresponding to the modulation vector of the ordered spins. In contrast to the magnetic resonance (magnon at q0) characterized by sharp spectral features, the electromagnons manifest themselves as very broad spectral bands because their activation in the dielectric spectra is closely related to the high density of states close to the extrema of the magnon dispersion branches. Since the probing THz radiation has a long wavelength (i.e. the wave vector q0), the electromagnons cannot be excited by a resonant single-photon absorption due to the wave vector conservation law; in this sense polar phonons should be involved in the interaction process.
An experimentally observed low-frequency electromagnon in type-II multiferroics was found to be related to the spin waves near the magnetic Brillouin zone (BZ) center with q=qm pimenov08 ; lee09 or to those with q=q-2qm; rovillain11 here q stands for the wave vector at the BZ edge. In both cases the low-frequency electromagnon has a similar frequency as the magnon with q=0 which is expected because all these excitations are related to the same magnon branch. A high-frequency electromagnon corresponds to an excitation of the BZ-edge magnons (q=q) which can induce a quasi-uniform modulation (q0) of the local electric dipole moment.lee09 ; valdes09 As for mechanisms of the electromagnon excitations, some researchers claim that the low-frequency electromagnons are activated by the inverse Dzyaloshinskii-Moriya mechanism, while the high-frequency one by the Heisenberg exchange coupling.kida09 ; shuvaev11 Other authors believe that both types of electromagnons can be explained by the Heisenberg exchange coupling.mochizuki10
Formerly, it was assumed that the electromagnons can be activated only in type-II multiferroics due to the large magnetoelectric coupling. Nevertheless, electromagnons were recently observed also in BiFeO3, cazayous08 ; komandin10 ; talbayev11 which is the most prominent type-I multiferroic with a rather weak magnetoelectric coupling. In this context, THz dielectric spectra of multiferroics may shed new light on the nature of magnetoelectric coupling.
Hexagonal manganites RMnO3 belong to the type-I multiferroics. In particular, the hexagonal YMnO3 is ferroelectric below 1250 Kgibbs11 and the antiferromagnetic (AFM) ordering sets only below T K.bertaut63 ; chatterji07 The magnetic symmetry is P63cm fiebig00 and therefore the linear magnetoelectric coupling is forbidden. However, piezomagnetic and magnetoelastic couplings, and higher-order magnetoelectric couplings are allowed.Birss ; fiebig02 ; goltsev03 The piezomagnetic coupling is characterized by a bilinear interaction between the magnetic order parameter and strain, in contrast to the magnetoelastic coupling which is proportional to the product of squared order parameter and strain.Birss ; Landau By using the method of optical second harmonic generation,Fiebig-JOSAB the piezomagnetic coupling was observed owing to the interaction between AFM and FE domain walls in YMnO3.fiebig02 ; goltsev03 Switching of the FE polarization triggers a reversal of the AFM order parameter.fiebig02 ; goltsev03 ; choi10 Higher order magnetoelectric coupling in YMnO3 has been observed in several works. Exceptionally large atomic displacements at were observed in structural studies and they demonstrate unusually strong magnetoelastic coupling.lee08 The large spin–polar-phonon coupling manifests itself by a decrease of the low-frequency permittivityaikawa05 near which is probably caused by anomalous hardening of several infrared-active phononszaghrioui08 . Similar phonon anomalies were observed near also in the Raman spectra.fukumura07 Ultrasound measurements on a single crystal of the hexagonal YMnO3 showed anomalous behavior of the elastic moduli and due to a strong coupling of the lattice with the in-plane exchange interaction.poirier07
The AFM resonance in hexagonal YMnO3 crystal was first observed and briefly (without any figures) reported in Ref. penney69, . More detailed THz studies of YMnO3 ceramics were recently published in Ref. goian10, . The AFM resonance lies near 43 at 4 K and its frequency softens on heating towards , where it disappears.penney69 ; goian10 Three magnon branches were discovered below using inelastic neutron scattering (INS).sato03 ; petit07 ; chatterji07 Two of them are degenerated near the BZ center and their frequencies correspond to the above mentioned AFM resonance. Moreover, a possible existence of magnons and short-range correlations between spins at Mn sites in paramagnetic phase were indicated by INS.park03 ; roessli05 ; demmel07 The magnetoelastic coupling manifests itself also by a strong mixing of magnons with acoustic phonons; this leads to a gap in the transverse acoustic (TA) phonon branch occurring at the frequencies and wave vectors where the uncoupled magnon and TA branches would intersect.petit07 Recent polarized INS measurements revealed that the excitation detected at liquid helium temperatures near 43 has a mixed character of magnetic spin wave and lattice vibration,pailhes09 i.e. its contribution to both the magnetic permeability and the dielectric permittivity is possible.
The reported piezomagnetic, magnetoelastic, and higher-order magnetoelectric couplings in optical, acoustic and mainly INS data stimulated our spectroscopic study of hexagonal single crystals of YMnO3. In this paper, we present results on far-infrared (FIR) and THz polarized spectra in this material emphasizing interaction between magnetic, electric and phonon subsystems. We demonstrate that strongly underdamped AFM resonance observed near 40 contributes only to the magnetic permeability spectra below TN. An additional broad and weak absorption band was observed in the same frequency range in the dielectric spectra both below and above TN. In contrast to electromagnons which are typically observed only below 50 K, the oscillator strength of this excitation significantly increases on heating when room temperature is approached. This indicates that the feature must be related to the occupation number of magnons and/or phonons. Additional absorption band with similar temperature behavior was observed also near 100. We will show that both these excitations can be explained by differential multiphonon and magnon-phonon processes.
II Experimental details
The experiments were performed using a Fourier-transform infrared (FTIR) spectrometer Bruker IFS 113v and a custom-made THz time-domain spectrometer.kuzel10 In both experiments, Optistat CF cryostats (Oxford Instruments) with polyethylene (FIR) or Mylar (THz) windows were used for measurements between 10 and 300 K. Helium-cooled bolometer operating at 1.6 K was used as a detector in the FTIR spectrometer. Principles of THz time-domain spectroscopy are explained in Ref. dexheimer08, . The output of a femtosecond Ti:sapphire laser oscillator (Coherent, Mira) excites an interdigitated photoconducting switch TeraSED (Giga-Optics) to generate linearly polarized broadband THz probing pulses. A gated detection scheme based on an electro-optic sampling with a 1 mm-thick [110] ZnTe crystal permits to measure the time profile of the electric field of the transmitted THz pulse (see Ref. kuzel10, for further details).
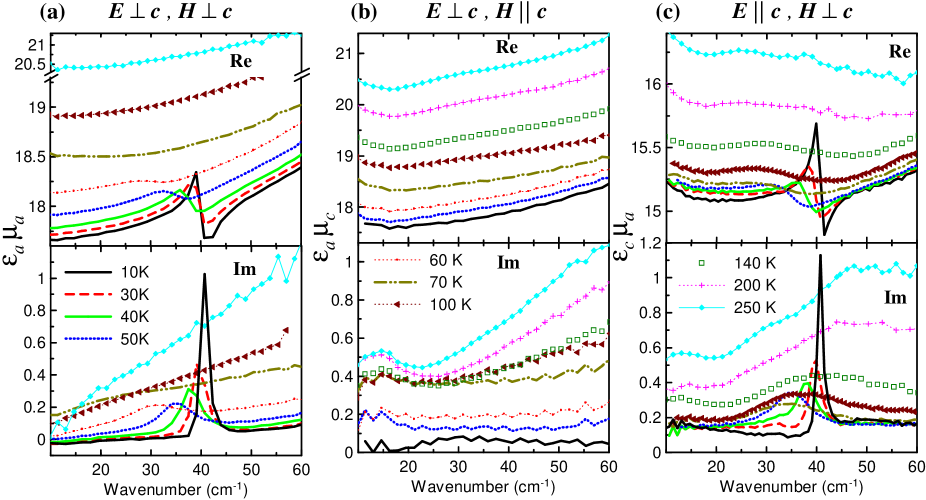
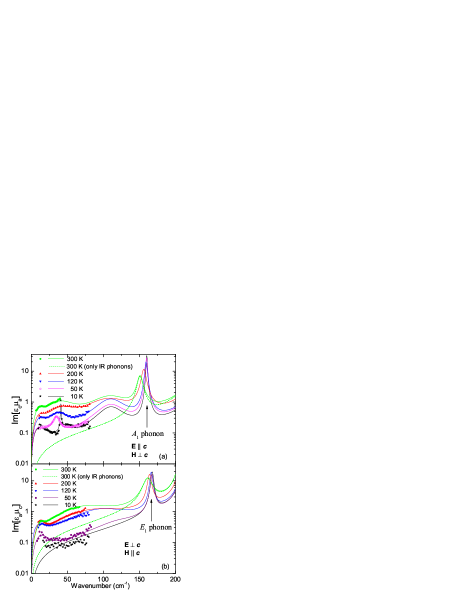
Hexagonal YMnO3 single crystals were grown by the floating zone method.Kohn00 Two crystal plates with lateral dimensions of mm2 and with the c-axis oriented either in-plane or out-of-plane along its normal, were cut and polished to obtain highly plane-parallel samples (within 1 m) with thicknesses of 1100 and 348 m for each orientation, respectively. These crystal plates were probed using the THz and FIR beam in all possible geometries: Ec, Hc; Ec, Hc and Ec, Hc. It enabled us to get access to the complex spectra of the products , , and as shown in Fig. 1(a), (b), and (c), respectively.
III Results
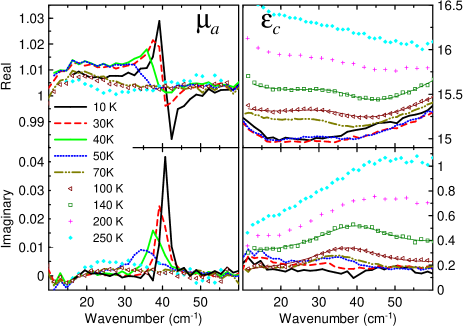
At low temperatures, the peak around 40 cm-1 seen in the spectra of and [Fig. 1(a, c)] but not in those of [Fig. 1(b)] is definitely due to the AFM resonance as it contributes only to the magnetic permeability . The AFM resonance vanishes above . The data shown in Fig. 1(b) allow us to assume that in the THz range. This is in agreement with the magnetic order of YMnO3 in the AFM phase: the spins are ordered in adjacent layers in the hexagonal plane in such a way that the magnetic resonances are not expected to be excited with Hc. Based on this assumption, we are able to retrieve the complex values of the permeability and of the permittivity (see Fig. 2).
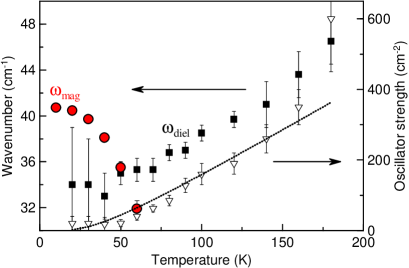
The spectra of were fitted by a damped harmonic oscillator and the resulting AFM resonance frequency is plotted in Fig. 3; a strong softening is observed upon heating towards . Similar temperature dependence was briefly published earlier,penney69 ; goian10 with the magnon frequency higher by approximately 2.
Besides the sharp AFM resonance line in the low-temperature spectra one can observe a broad dielectric absorption band around 40 in the spectra. This feature is detected even above , where its strength remarkably increases with temperature. The presence of such a resonance in is qualitatively expected from a simple comparison of the raw data in Figs. 1(a) and (c). The accessible spectral range of the THz measurements for our sample is limited to 60, therefore we have performed also FTIR transmission (up to 100) and reflectivity (up to 650) measurements for all polarizations.
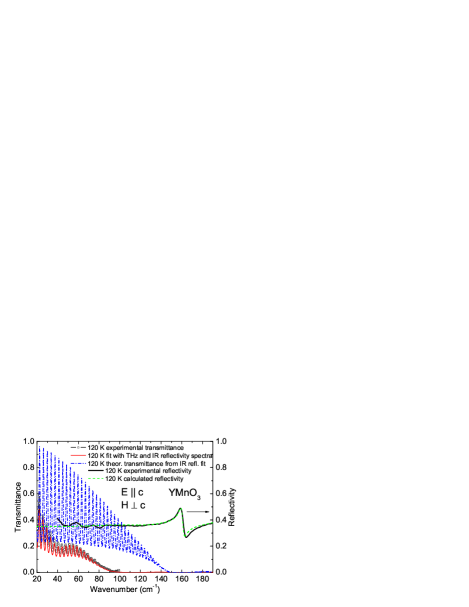
An example of FTIR experimental transmittance and reflectivity spectra obtained at 120 K and their various fits are shown in Fig. 4. Regular oscillations observed in the transmittance spectrum are due to Fabry-Pérot interferences in the plane-parallel sample; a weak minimum near 40 corresponds to the broad absorption band detected in the THz dielectric spectra (see Fig. 2). According to Ref. zaghrioui08, as well as according to our FTIR reflectivity (see e.g. Fig. 4), the lowest frequency polar phonons lie above 150 in both polarized Ec and Ec spectra. Nevertheless, our simultaneous fits of the THz complex permittivity and FTIR transmittance and reflectivity data reveal several additional modes below these phonon frequencies. The relevant spectra are plotted in Fig. 5. Besides the sharp magnon line at 40 three other broad modes at roughly 10, 40 and 100 were used in the fitting procedure in order to account for the measured shape of the Ec spectra at 10 K (see Fig. 5a). The additional modes remain in the spectra up to room temperature and their strength increases on heating. Also in Ec polarized spectra, two broad modes observed near 10 and 90 were used for the fits above 50 K.
The feature observed near 10 in both polarized spectra could be related to low-frequency magnonssato03 (cf. the low-frequency magnon branches shown in Fig. 7). However, the sensitivity and accuracy of our THz spectra below 20 is limited; therefore we cannot exclude that it is only an artifact. For this reason we will not speculate about the origin of this excitation. All other modes appearing below 150 are clearly observed in the THz and/or FTIR transmittance spectra while the FTIR reflectivity measurements are not sensitive enough to detect and resolve these weak and broad spectral features (see Fig. 4). Their origin will be discussed in the next section.
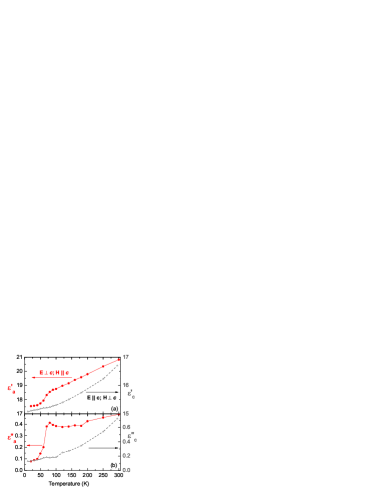
The temperature dependence of the sub-THz complex dielectric permittivity plotted in Fig. 6 for 20 exhibits a pronounced drop below . Such anomaly is a typical feature of large spin-phonon coupling which occurs only in hexagonal planes of YMnO3, where the spins are ordered. For that reason the anomaly is not observed in (T). The AFM phase transition is accompanied by unusually large atomic displacements, which were detected by neutron diffraction;lee08 for this reason the phonon frequencies change below . The decrease in and is mainly caused by hardening of the symmetry polar mode seen near 250 in the IR reflectivity spectra with polarization Ec.zaghrioui08 Fits of our IR reflectivity spectra show that the mode near 250 hardens from 246 (at 300 K) to 256 (at10 K) and therefore its dielectric contribution is reduced from 9.1 (300 K) to 7.6 (10 K). This decrease of is mainly responsible for the change of the permittivity (T) seen in Fig. 6. Hardening of other modes brings a minor contribution to the decrease of (T) on cooling. Similar temperature dependence of was observed also in the radio-frequency regionaikawa05 providing evidence of the absence of dielectric dispersion below 100 GHz. Gradual decrease of and on cooling from 300 to 100 K is a usual behavior caused by a small phonon stiffening as a consequence of thermal contraction.
IV Discussion
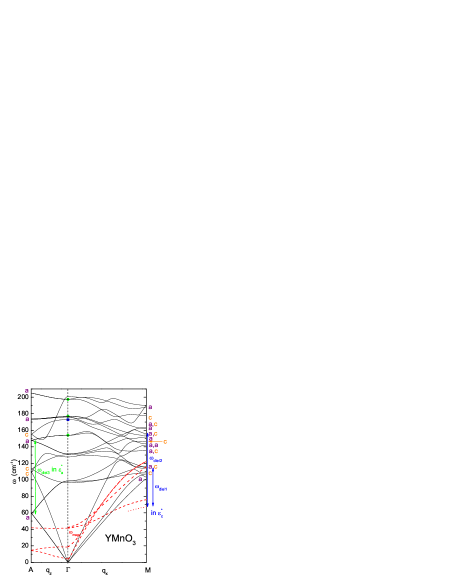
The question arises about the origin of the absorption bands appearing below phonon resonances in Fig. 5. They are much weaker and significantly broader than those of polar phonons and their strength increases when the temperature is increased, i.e., the strength is high in the paramagnetic phase. Their frequencies lying in the range of 40–100 coincide with those of the magnon branch observed by INS at 7 K over the BZsato03 (see Fig. 7). In the following text we discuss whether these features can be related to the magnon dispersion branches.
Could a spin wave still exist in hexagonal YMnO3 at room temperature? It is well established that Mn spins exhibit a strong short-range correlation in hexagonal YMnO3 far above TN. This was proved by an anomalous behavior of the thermal conductivity,sharma04 elastic moduli,poirier07 as well as by neutron scattering experiments.park03 ; roessli05 ; demmel07 Nevertheless, due to the short-range correlation of the spins in the hexagonal plane of YMnO3, one can expect the existence of only short-wavelength paramagnons, i.e. magnons with large wavevectors qx near the M-point of the BZ. A part of such a paramagnon branch is schematically plotted in Fig. 7. Note that its frequency is lower than that of the magnon branch at 7 K, as the magnon frequency decreases by almost 10 on heating towards TN (see Fig. 2).
Electromagnons are excitations with frequencies close to those of spin waves, which, due to specific couplings, are activated in the dielectric spectra. In perovskite manganites, the parts of magnon branches exhibiting a high density of states are mainly involved in these interactions (at BZ edge or close to the spin modulation wave vector).valdes09 However, these electromagnons were observed only at very low temperatures (typically less than 50 K). Their strength dramatically decreases on heating and they usually disappear from the spectra at TN or close above TN.pimenov08 ; kida09 ; shuvaev11 This is in contradiction with our observations in YMnO3.
We came to the conclusion that the broad absorption bands we observe in the dielectric spectra reflect excitations which must be coupled to phonons. Let us discuss in brief which types of interaction between the magnetic subsystem and other degrees of freedom might be expected on the basis of the point group crystallographic symmetry 6 and the magnetic symmetry .fiebig00 The magnetic order parameter of YMnO3 was analyzed in several publications and it was shown to transform following B1 () irreducible representation of the 6 group.Nedlin ; Pashkevich ; Sa ; Koster The symmetry strictly forbids the linear magnetoelectric effect, i.e. bilinear terms (where and are components of the magnetic and electric field, respectively) are not allowed in the thermodynamic potential.Birss However, a higher order magnetoelectric effect (called sometimes the magnetodielectric effect), accounted for by the terms in the thermodynamic potential, is allowed. This effect manifests itself in our measurements as a kink near in the temperature dependence of (see Fig. 6).
The magnetic symmetry of YMnO3 allows the piezomagnetic contribution to the thermodynamic potential described by the terms , where is a stress component and denotes components of the piezomagnetic tensor.Birss ; goltsev03 We believe that this type of bilinear coupling must play an important role in the interaction between the magnetic subsystem and the lattice. Usually, the piezomagnetic effect is allowed thanks to the relativistic part of spin-lattice and spin-spin interactions, provided the symmetry restrictions are met.Landau However, in YMnO3 which is a noncollinear antiferromagnet the exchange (Coulomb) interactions may be by several orders of magnitude stronger than the relativistic ones and, therefore, they can be the origin of piezomagnetism.Vitebsk For example, extraordinary spin-phonon interactions were shown to contribute to the thermal conductivity of YMnO3 below .sharma04 Higher order effects such as are naturally also allowed in YMnO3.
In order to provide a more quantitative explanation of the interaction between magnetic subsystem and phonons, we calculated the phonon spectrum from first principles within the spin-polarized local density approximation PhysRevB.23.5048 . We used projector augmented-wave potentials as implemented in Vienna Ab Initio Simulation Package (VASP) VASP_Kresse:1993 ; VASP_Kresse:1996 ; Bloechl:1994 ; VASP_Kresse:1999 . The following valence-electron configurations were considered: for Y, for Mn, and for oxygen. To account for the strong electron correlation effects on the d-shells of Mn atoms, we used LDA+U approach Anisimov_et_al:1997 ; Dudarev with an on-site Coulomb parameter eV and Hund’s exchange eV as calculated in Ref. Medvedeva_2000, . The spin-orbit interaction was not taken into account. We used an A-type antiferromagnetic structure, where spins on Mn honeycomb layers are aligned ferromagnetically and the layers with opposite spin-direction alternate along the -axis. Spaldin_NMat_2004 ; fennie05 A kinetic energy cutoff of 500 eV and a -centered -point mesh was used in the structural relaxation of the unit cell, where the Hellman-Feynman forces were minimized to a value smaller than 0.5 meV/. Phonon calculations were performed on a - centered -point mesh, with a supercell within the force-constant method. Kunc:1982 ; Alfe:2009 The Hellman-Feynman forces were calculated for displacements of atoms of up to 0.04 . The dynamical matrix for each -point in the BZ was constructed by a Fourier transformation of the force constants, calculated for the -point and for the BZ boundaries. Phonon-mode frequencies and atomic displacement patterns for each -point were obtained as eigenvalues and eigenvectors of the dynamical matrices. The result for directions A--M and wavenumbers up to 200 cm-1 are presented in Fig. 7.
As we have already pointed out, the absorption strength significantly increases on heating. This is typical for difference frequency absorption. Such process includes the annihilation of one quasi-particle (phonon or magnon) with frequency and the creation of another quasi-particle with a higher frequency . The dielectric resonance then occurs at frequency . This process can involve excitations from the whole BZ provided that the total wave vector is conserved. The contribution of the parts of the dispersion branch with the highest density of states is expected to dominate. The high number of available states is found namely at the flat parts of the bands close to the BZ boundaries, as it was observed, for example, in MgO.komandin09
Obviously such a process is strongly temperature dependent, as it is related to the population of excitations with frequency , which follows the Bose-Einstein statistics. At low temperatures the population of the levels which we study is close to zero and the differential absorption then practically vanishes. It becomes more probable when the energy level is thermally populated at higher temperatures. This is in qualitative agreement with our observations.
The differential transitions at the BZ boundary are possible only between phonons with the same symmetry and if the total wave vector is conserved (i.e. the transition must be vertical in the wave-vector space). The broad absorption around 90 seen in spectra (Fig. 5b) can be explained by differential multiphonon absorption. Phonons near 60 and 150 at the A-point of BZ are polarized in the hexagonal plane (marked as a in Fig. 7) and their difference gives the frequency = 90 , as observed.
However, the two bands seen in spectra around = 40 and = 100 are impossible to explain by multiphonon absorption. The frequency of the c-polarized phonons at the BZ edge is higher than 100. It means that the population of such phonons should be much lower than that of the a-polarized phonon at 60 . For this reason the strength of the differential multiphonon absorption in the spectra should be weaker than in spectra. Moreover, within such a hypothesis, a continuous absorption band would be expected in the spectra due to the large number of c-polarized phonons at the M-point (see scheme in Fig. 7). This is in contradiction with the experimental results presented in Fig. 5.
We assume the existence of paramagnons near the M-point, and in this case a differential paramagnon-phonon absorption with several maxima can be obtained. Moreover, because of the similar Bose-Einstein factor for the paramagnon close to 70 and phonon near 60 at the A-point, the absorptions observed in both and should have comparable strengths. This fits well with the experiment. The frequency increases on heating (Fig. 3) presumably due to the softening of the paramagnon branch with increasing temperature. The increase of the oscillator strength of the mode observed in Fig. 3 is compatible with the temperature increase of the Bose-Einstein factor: this is demonstrated by the dotted line which shows the expected population increase of an energy level at 66 (i.e. the frequency of paramagnon at q).
V Conclusions
The THz and FTIR transmission spectra of hexagonal YMnO3 clearly revealed two kinds of excitations of different nature, which exist below polar phonon frequencies. The sharp AFM resonance band observed near 40 at low temperatures broadens upon heating and disappears close to . This resonance is the main contributor to the magnetic permeability . Additional broad excitations were observed in the frequency range 40–100 in the dielectric permittivity spectra in both the AFM and paramagnetic phases. Our theoretical explanation of the activation of these excitations in the THz dielectric spectra is based on a two-particle differential processes schematically shown in Fig. 7. The resonance observed in spectra is caused by differential phonon absorption in the A-point of the BZ. The two broad absorption bands in spectra were described as differential phonon-paramagnon processes. The absorption strength of these excitations in the THz spectra increases on heating due to the growing population of paramagnons and phonons with temperature. This is possible in the paramagnetic phase owing to strong short-range spin correlations within hexagonal planes of YMnO3. The processes we observe in YMnO3, where the linear magnetoelectric coupling is forbidden, are clearly different from the one responsible for the appearance of electromagnons in multiferroics with spin-induced ferroelectricity.pimenov06 ; sushkov07 ; pimenov08 ; kida09 The multiphonon absorptions are allowed by symmetry in all dielectric systems, while paramagnon-phonon absorptions can be expected only in paramagnetic systems with a strong short-range magnetic order (e.g. in hexagonal manganites). Magnon-phonon absorption should be also detectable in all magnetically ordered systems (FM, AFM, ferrimagnets etc.) with relatively high critical temperatures. In such conditions the magnons at the Brillouin zone edge may become sufficiently populated to allow multiparticle effects in the spectra. This may stimulate further THz and FIR studies of other magnetically polarizable systems.
Acknowledgements
The authors thank M. Mostovoy for valuable discussions. This work was supported by the Czech Science Foundation (Project No. 202/09/0682), by AVOZ10100520, and by the Young Investigators Group Program of the Helmholtz Association (Contract VH-NG-409). The contribution of Ph.D. student V.G. has been supported by projects 202/09/H041 and SVV-2011-263303. R.V.P. acknowledges the support by the RFBR (Project No. 09-02-00070). The support of the Jülich Supercomputing Center is gratefully acknowledged.
References
- (1) A. Pimenov, A. A. Mukhin, V. Yu. Ivanov, V. D. Travkin, A. M. Balbashov, and A. Loidl, Nature Phys. 2, 97-100 (2006).
- (2) A. B. Sushkov, R. V. Aguilar, S. Park, S.-W. Cheong, and H. D. Drew, Phys. Rev. Lett. 98, 027202 (2007).
- (3) V. G. Baryakhtar and I. E. Chupis, Sov. Phys.-Solid State 11, 2628 (1970).
- (4) A. Pimenov, A. M. Shuvaev, A. A. Mukhin, and A. Loidl, J. Phys.: Condens. Matter 20, 434209 (2008).
- (5) N. Kida, Y. Takahashi, J. S. Lee, R. Shimano, Y. Yamasaki, Y. Kaneko, S. Miyahara, N. Furukawa, T. Arima, and Y. Tokura, J. Opt. Soc. Amer. B 26, A35-A51 (2009).
- (6) A. M. Shuvaev, A. A. Mukhin and A. Pimenov, J. Phys.: Condens. Matter 23, 113201 (2011).
- (7) N. Kida, D. Okuyama, S. Ishiwata, Y. Taguchi, R. Shimano, K. Iwasa, T. Arima, and Y. Tokura, Phys. Rev. B 80, 220406(R) (2009).
- (8) D. I. Khomskii, J. Magn. Magn. Mater. 306, 1 (2006).
- (9) D. Khomskii, Physics 2, 20 (2009).
- (10) Th. Lottermoser, D. Meier, R. V. Pisarev, and M. Fiebig, Phys. Rev. B 80, 100101 (2009).
- (11) J. S. Lee, N. Kida, S. Miyahara, Y. Takahashi, Y. Yamasaki, R. Shimano, N. Furukawa, and Y. Tokura, Phys. Rev. B 79, 180403(R) (2009).
- (12) P. Rovillain, M. Cazayous, Y. Gallais, M-A. Measson, A. Sacuto, H. Sakata, and M. Mochizuki, Phys. Rev. Lett. 107, 027202 (2011).
- (13) R. Valdés Aguilar, M. Mostovoy, A. B. Sushkov, C. L. Zhang, Y. J. Choi, S.-W. Cheong, and H. D. Drew, Phys. Rev. Lett. 102, 047203 (2009).
- (14) M. Mochizuki, N. Furukawa, and N. Nagaosa, Phys. Rev. Lett. 104, 177206 (2010).
- (15) M. Cazayous, Y. Gallais, A. Sacuto, R. de Sousa, D. Lebeugle and D. Colson, Phys. Rev. Lett. 101, 037601 (2008).
- (16) G. Komandin, V. Torgashev, A. Volkov, O. Porodinkov, I. Spektor, and A. Bush, Phys. Sol. State 52, 734 (2010).
- (17) D. Talbayev, S. A. Trugman, S. Lee, H. T. Yi, S.-W. Cheong, and A. J. Taylor, Phys. Rev. B 83, 094403 (2011).
- (18) A. S. Gibbs, K. S. Knight, and P. Lightfoot, Phys. Rev. B 83, 094111 (2011).
- (19) E. Bertaut and M. Mercier, Phys. Lett. 5, 27 (1963).
- (20) T. Chatterji, S. Ghosh, A. Singh, L. P. Regnault, and M. Rheinstädter, Phys. Rev. B 76, 144406 (2007).
- (21) M. Fiebig, D. Fröhlich, K. Kohn, St. Leute, Th. Lottermoser, V. V. Pavlov, and R. V. Pisarev, Phys. Rev. Lett. 84, 5620-5623 (2000).
- (22) R. R. Birss, Symmetry and Magnetism, North-Holland, 1967.
- (23) M. Fiebig, Th. Lottermoser, D. Fröhlich, A. V. Goltsev, and R. V. Pisarev, Nature 419, 818-820 (2002).
- (24) A. V. Goltsev, R. V. Pisarev, Th. Lottermoser, and M. Fiebig, Phys. Rev. Lett. 90, 177204 (2003).
- (25) L. D. Landau and E. M. Lifshitz, Electrodynamics of Continuos Media, 2ed., Pergamon, 1984.
- (26) M. Fiebig, V. V. Pavlov, and R. V. Pisarev, J. Opt. Soc. Amer. B 22, 96 (2005).
- (27) T. Choi, Y. Horibe, H. T. Yi, Y. J. Choi, Wu Weida, and S.-W. Cheong, Nature Mat. 9, 253-258 (2010).
- (28) S. Lee, A. Pirogov, M. Kang, K.-H. Jang, M. Yonemura, T. Kamiyama, S.-W. Cheong, F. Gozzo, N. Shin, H. Kimura, Y. Noda, and J.-G. Park, Nature 451, 805-809 (2008).
- (29) Y. Aikawa, T. Katsufuji, T. Arima, and K. Kato, Phys. Rev. B 71, 184418 (2005).
- (30) M. Zaghrioui, V. Ta Phuoc, R. A. Souza, and M. Gervais, Phys. Rev. B 78, 184305 (2008).
- (31) H. Fukumura, S. Matsui, H. Harima, K. Kisoda, T. Takahashi, T. Yoshimura, and N. Fujimura, J. Phys.: Condens. Matter 19, 365239 (2007).
- (32) M. Poirier, F. Laliberté, L. Pinsard, and A. Revcolevschi Phys. Rev. B 76, 174426 (2007).
- (33) T. Penney, P. Berger, and K. Kritiyakirana, J. Appl. Phys. 40, 1234-1235 (1969).
- (34) V. Goian, S. Kamba, C. Kadlec, D. Nuzhnyy, P. Kužel, J. Agostino Moreira, A. Almeida and P. B. Tavares, Phase Transitions 83, 931 (2010).
- (35) T. J. Sato, S.-H. Lee, T. Katsufuji, M. Masaki, S. Park, J. R. D. Copley, and H. Takagi, Phys. Rev. B 68, 014432 (2003).
- (36) S. Petit, F. Moussa, M. Hennion, S. Pailhès, L. Pinsard-Gaudart, and A. Ivanov, Phys. Rev. Lett. 99, 266604 (2007).
- (37) J. Park, J.-G. Park, G. S. Jeon, H.-Y. Choi, Ch. Lee, W. Jo, R. Bewley, K. A. McEwen, and T. G. Perring, Phys. Rev. B 68, 104426 (2003).
- (38) B. Roessli, S. N. Gvasaliya, E. Pomjakushina, and K. Conder, JETP Letters 51, 287 (2005).
- (39) F. Demmel, T. Chatterji, Phys. Rev. B 76, 212402 (2007).
- (40) S. Pailhès, X. Fabrèges, L. P. Régnault, L. Pinsard-Godart, I. Mirebeau, F. Moussa, M. Hennion, and S. Petit, Phys. Rev. B 79, 134409 (2009).
- (41) P. Kužel, H. Němec, H., F. Kadlec, and C. Kadlec, Opt. Express 18, 15338 (2010).
- (42) S. L. Dexheimer, THz Spectroscopy: Principles and Applications (Boca Raton, FL: CRC Press).
- (43) H. Yamagichi, T. Fujita, T. Shinozaki, H. Sigie, and K. Kohn, Ferrites: Proceedings of the Eighth International Conference on Ferrites (ICF 8), Kyoto and Tokyo, Japan 2000.
- (44) P. A. Sharma, J. S. Ahn, N. Hur, S. Park, S. B. Kim, S. Lee, J.-G. Park, S. Guha, and S.-W. Cheong, Phys. Rev. Lett. 93, 177202 (2004).
- (45) G. M. Nedlin, Sov. Phys. Solid St. 6, 2165 (1965).
- (46) Yu. G. Pashkevich, V. L. Sobolev, S. A. Fedorov, and A. V. Eremenko, Phys. Rev. B 51, 15898 (1995).
- (47) D. Sa, R. Valentí, and C. Gros, Eur. Phys. Journ. B 14, 301 (2000).
- (48) G. F. Koster, J. O. Dimmock, R. G. Wheeler, and H. Statz, Properties of the Thirty Two Point Groups, MIT, 1963.
- (49) I. M. Vitebskii, N. M. Lavrinenko, and V. L. Sobolev, J. Magn. Magn. Mater. 97, 263 (1991).
- (50) C. J. Fennie, and K. M. Rabe, Phys. Rev. B 72 100103(R) (2005).
- (51) J. P. Perdew, and A. Zunger, Phys. Rev. B 23, 5048 (1981).
- (52) G. Kresse, and J. Hafner, Phys. Rev. B 47, 558 (1993).
- (53) G. Kresse, and J. Furthmüller, Phys. Rev. B 54, 11169 (1996).
- (54) P. E. Blöchl, Phys. Rev. B 50, 17953 (1994).
- (55) G. Kresse, and D. Joubert, Phys. Rev. B 59, 1758 (1999).
- (56) V. I. Anisimov, F. Aryasetiawan, and A. I. Lichtenstein, J. Phys.: Condens. Matter 9, 767 (1997).
- (57) S. L. Dudarev, G. A. Botton, S. Y. Savrasov, C. J. Humphreys, and A. P. Sutton, Phys. Rev. B 57, 1505 (1998).
- (58) J. E. Medvedeva, V. I. Anisimov, M. A. Korotin, O. N. Mryasov, A. J. Freeman, J. Phys.: Condens. Matter 12, 4947 (2000).
- (59) B. B. van Aken, T. T. M. Palstra, A. Filippetti, and N. A. Spaldin, Nat. Mater. 3, 164 (2004).
- (60) D. Alfè, Comp. Phys. Commun. 180, 2622 (2009).
- (61) K. Kunc and R. M. Martin, Phys. Rev. Lett. 48, 406 (1982).
- (62) G. A. Komandin, O. E. Porodinkov, I. E. Spector, and A. A. Volkov, Phys. Sol. State 51, 2045 (2009).